Silver Trapped Near Critical Inflection Point
Silver remains at risk of further declines, unless it can reclaim key near-term resistance levels. It has been trading near three trend indicators – a rising trendline and the 20-day and 50-day moving averages – since May 15. Although the price zone was undercut over the past four days, further downside momentum failed to materialize. Instead, silver has been consolidating near that price support zone, reflecting indecision following recent weakness. During Monday’s shortened session due to a U.S. holiday, silver reclaimed the 20-day moving average and uptrend line for the first time in four days.
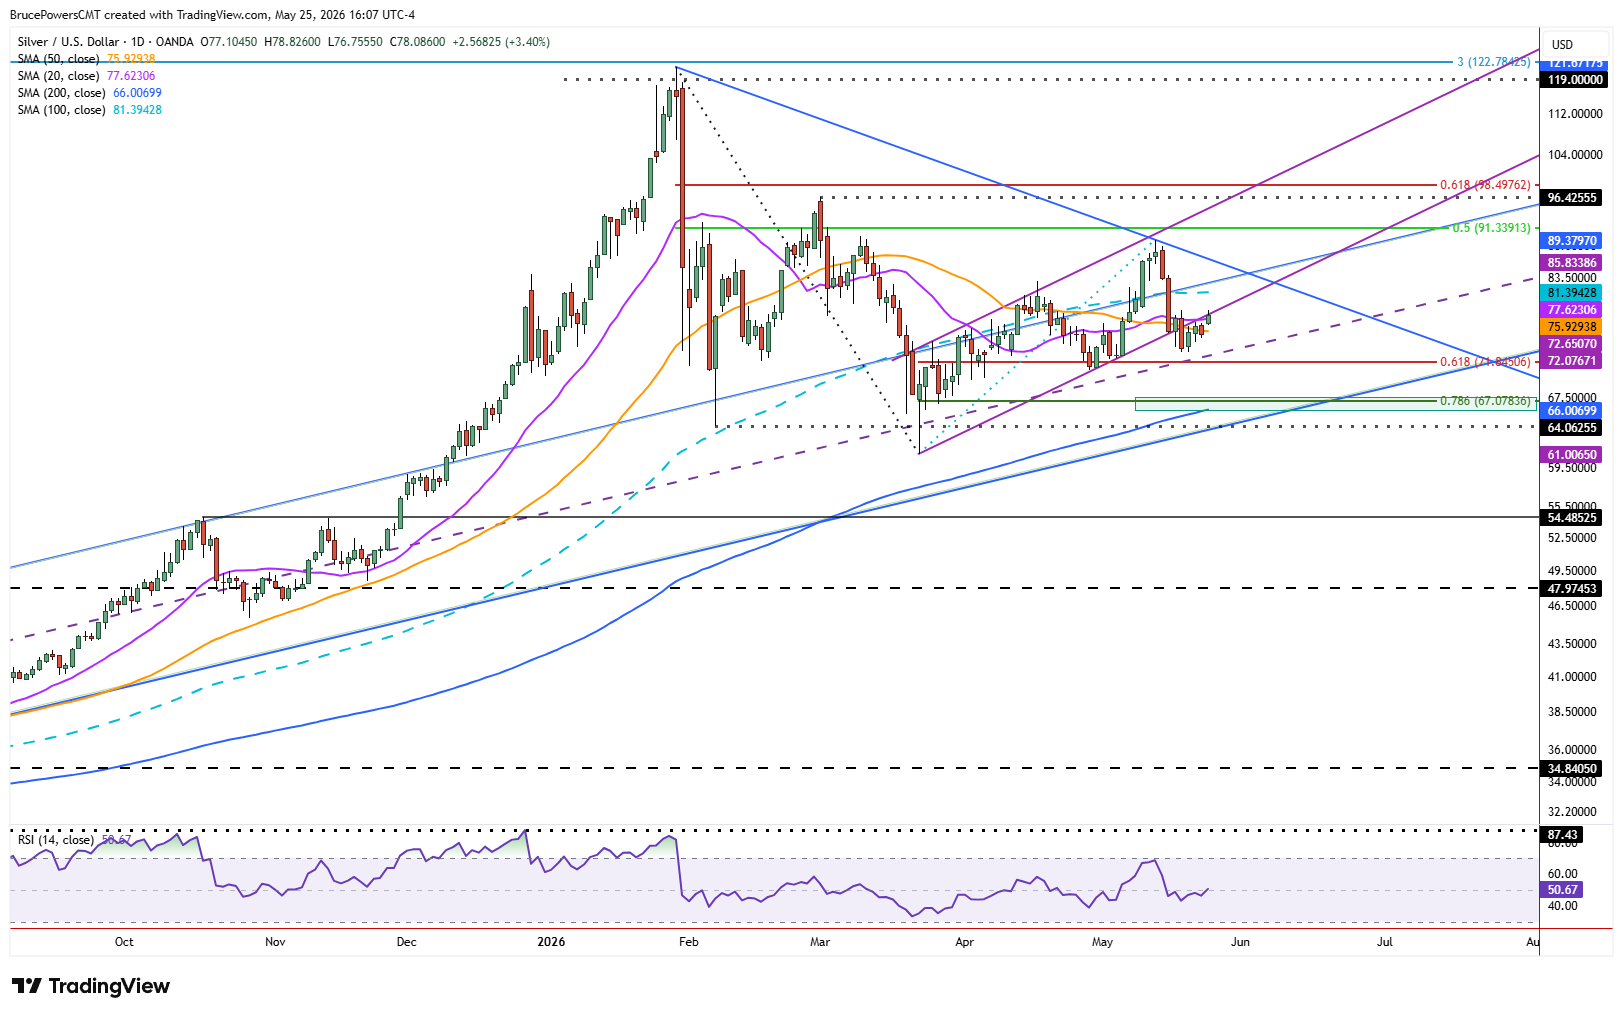
Bullish strength would be confirmed by a close above the trendline, while last week’s high of $78.89 marks key near-term resistance. A breakout above that level on a weekly basis would trigger a bullish continuation signal, further confirming strength indicated by the recovery of the three trend indicators. Until there are additional signs of strength, Monday’s advance can still be viewed as a pullback to test prior support as resistance. If resistance continues to hold near the trendline and 20-day moving average, now at $77.62, then a bearish continuation may unfold.

Bearish Scenario Opens Door to Deeper Correction
Last week’s low of $73.09 is key structure support. If it fails to hold, then the previous swing low of $70.87 becomes the next downside target and would likely be tested quickly. That would generate a bearish reversal signal of trend structure. Lower potential targets would then become likely. A drop below $70.87 will confirm weakening as the 61.8% Fibonacci retracement of the recent advance will be broken, along with the midline of the rising trend channel.
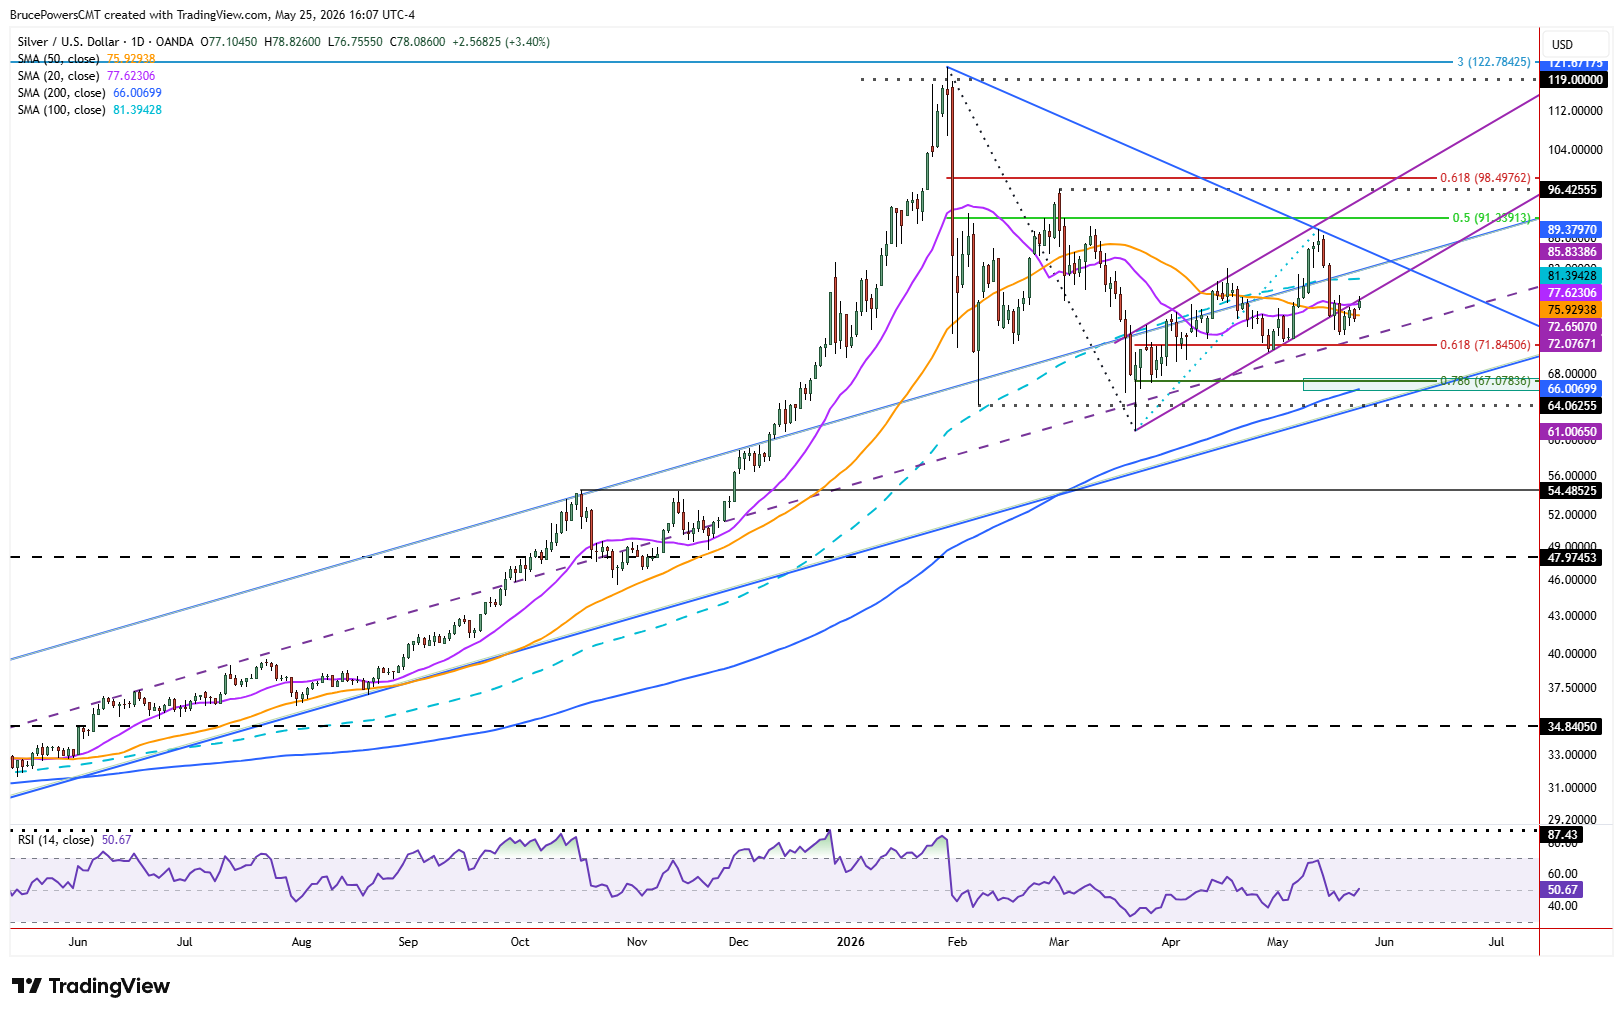
Likely lower targets include the 78.6% Fibonacci retracement at $67.08 and the 200-day moving average, now near $66.01 and rising. There is also a long-term uptrend line nearby. Together, those indicators identify a potentially strong support zone. It would be the first test of support near the 200-day average since June 2025, highlighting the significance of that price area if selling pressure accelerates.
Recovery Above Resistance Needed for Bullish Shift
Alternatively, if a decisive breakout above last week’s high triggers and it is sustained, a higher swing low will be established, improving the outlook for a bullish continuation. That would indicate a failed breakdown, which could lead to renewed upside momentum following the recent consolidation near support.
Key resistance is near the 100-day moving average, currently around $81.39. However, the recent lower swing high at $89.38 would need to be recovered for a bullish reversal signal of trend structure. Until then, silver remains at an inflection point, with price action around current support likely to determine whether the next significant move is a deeper correction or the beginning of a renewed advance.
Silver Price Forecast
Every new Silver analysis as it publishes, today's technical signal and key levels, live price — on one page.
See all Silver forecastsIf you’d like to know more about how to trade gold and silver, please visit our educational area.