Chip Stocks Give Back Thursday’s Gains
S&P 500 futures are trading 7,581.75, down 7.00 or -0.09% at 09:45 GMT on Friday. Nasdaq-100 futures are at 29,823.00, down 114.00 or -0.38%. Dow futures are trading 52,825.00, up 64.00 or +0.12%. The Nasdaq is carrying the weakness and chip stocks are the reason.
For the week the Nasdaq is still up about 1.5% and the S&P 500 has added 0.8%. The Dow is off 0.8%. The split tells you where the conviction has been and where it is pulling back this morning.

Daily September E-mini S&P 500 Index (ES) Futures Technical Analysis
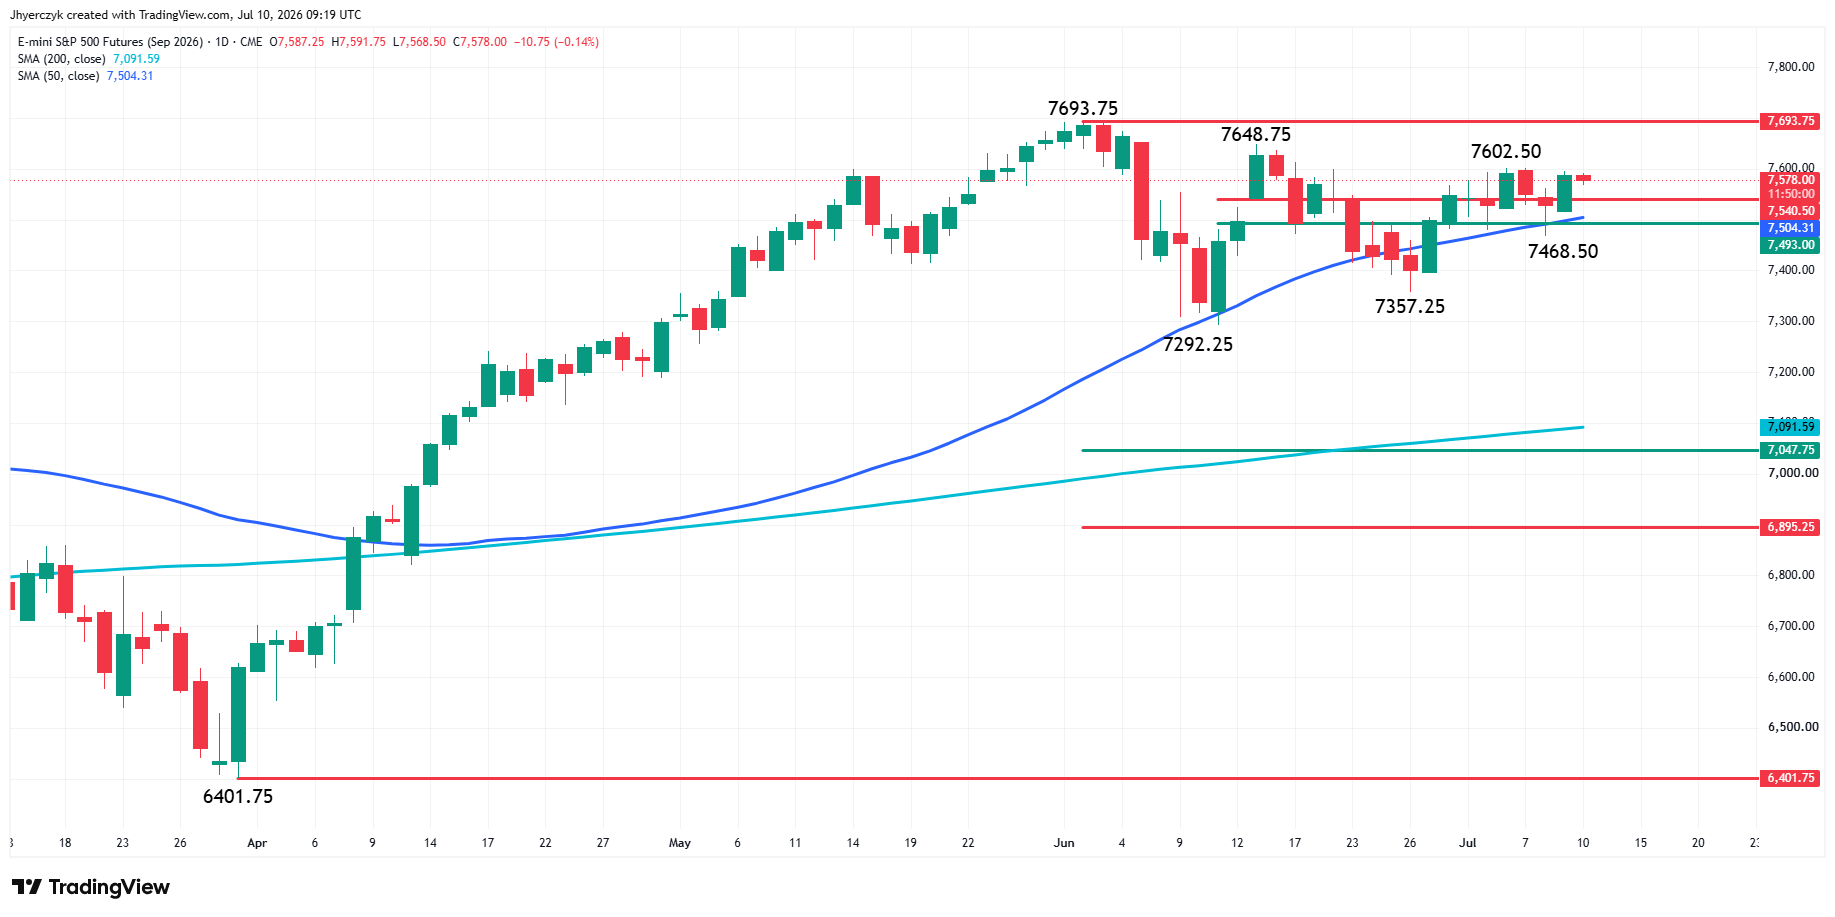
September E-mini S&P 500 Index futures are edging lower early Friday as investors look to close out the week with a gain. The benchmark index is currently trading on the strong side of a short-term retracement zone at 7540.50 to 7504.25, but more importantly, the 50-day moving average at 7504.25.
The support base is there for a breakout to the upside, but the price action suggests investors are waiting for a clear-cut catalyst to set in motion the next leg up. With support clearly established, traders are now facing potential headwinds at swing tops positioned at 7602.50, 7648.75 and the record high at 7693.75.
There is no guarantee that the rally will resume soon, but the set up is there. Fed policy, geopolitics and upcoming earnings season concerns, may be making investors tentative at current price levels. Usually with this type of set-up, new money is more than willing to buy strength by aggressively taking out offers.
The bullish outlook will fail under the 50-day moving average, in my opinion. We’ve seen three penetrations of this indicator since June 11, perhaps the fourth time will be the charm. The catalyst that drives it lower is going to have to be strong enough to force the “buy the dip” crowd to pull their bids.
If there is a 50-day MA breakdown, the market could fall like dominos with stops under swing bottoms at 7468.50, 7357.25 and 7292.25, fueling the sell-off. This would open the door for a potential acceleration to the downside with the first target the 200-day moving average, followed by the long-term retracement zone at 7047.75 to 6895.25.
One more takeaway from the current chart pattern, it’s one of the compression variety, which means get ready for heightened volatility.
S&P 500 Price Forecast
Every new S&P 500 analysis as it publishes, today's technical signal and key levels, live price — on one page.
See all S&P 500 forecastsDaily Volatility S&P 500 Index (VIX) Technical Analysis
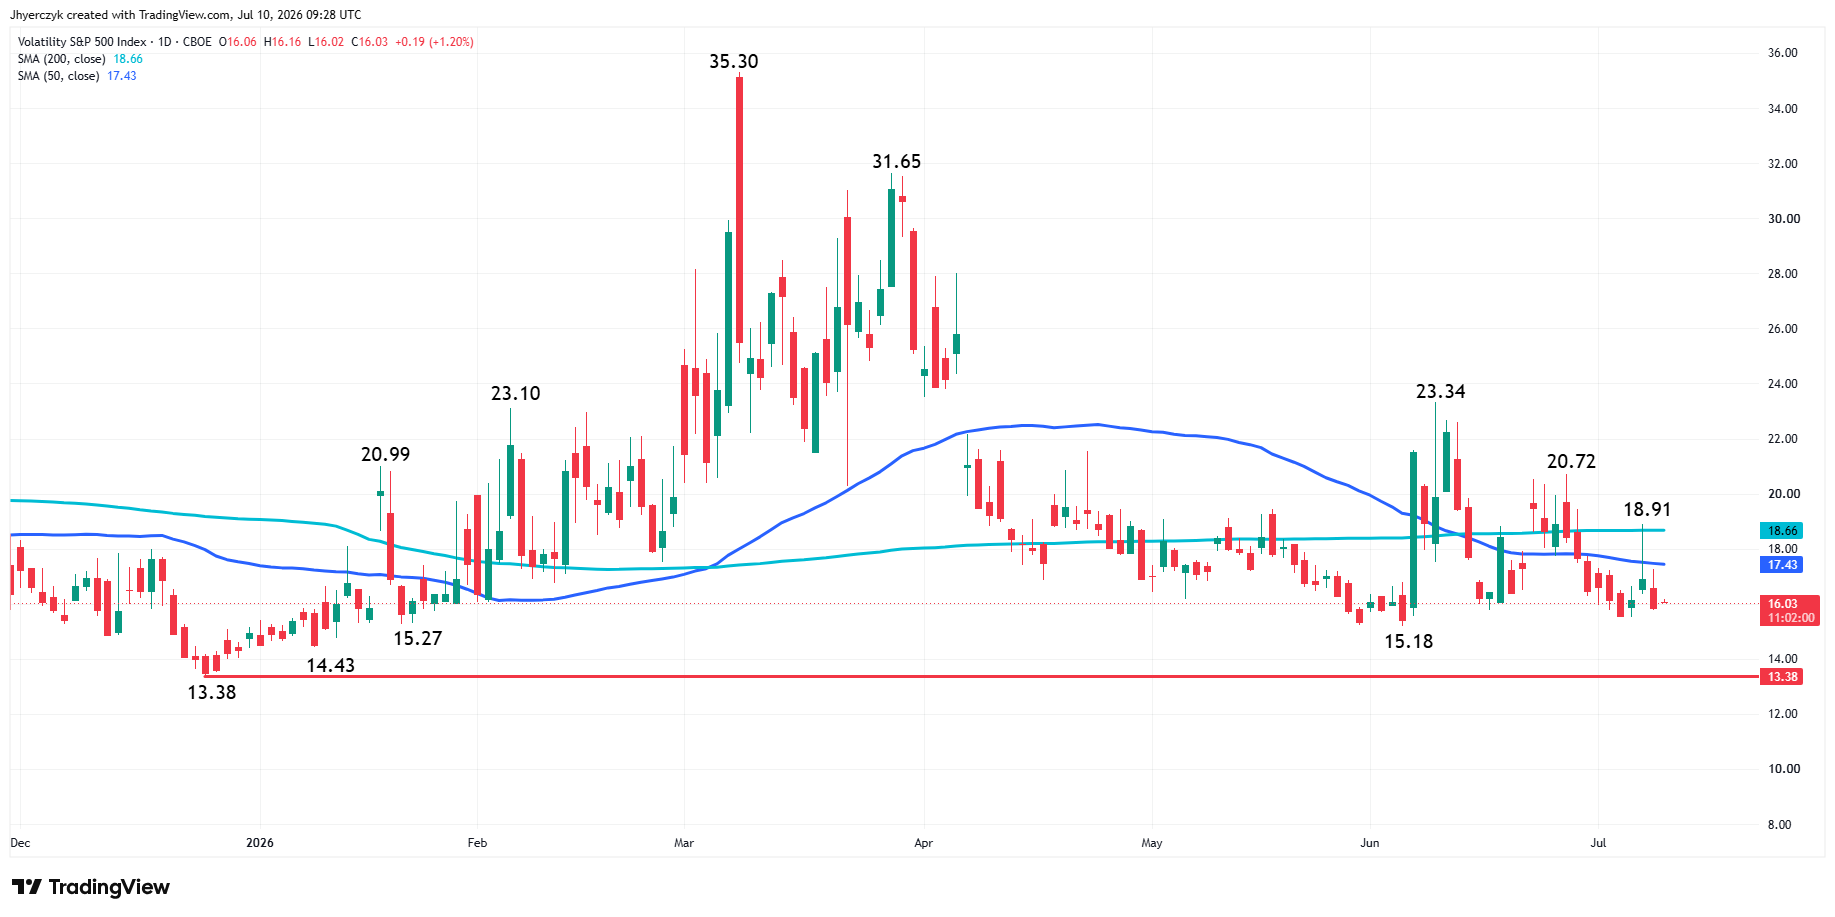
Traders should start monitoring the CBOE’s VIX because it is nearing support levels that have been known to signal sharp sell-offs. The last price is 16.04, which puts it on the weak side of both the 50-day moving average at 17.43 and the 200-day moving average at 18.66.
The recent low is 15.18 on June 4. In early January, it traded down to 14.43 and on December 24 it was down to 13.38.
The move from December and January was a gradual climb to a massive spike on March 9 at 35.30. Shortly before the massive rally that began at the end of March and early April, the VIX was trading 31.65. Since then, it gradually retreated to 15.18 on June 4.
Beginning with that bottom at 15.18, the action has been volatile with a spike to 23.34, followed by a pair of lower tops at 20.72 and 18.91. The unusual activity the past month is drawing my attention so it is suggested that you also put it on your radar.
Given the compression in the S&P 500 Index and the low VIX value, I’m looking for something major to occur that could send the VIX soaring. Establishing a bottom then overtaking the moving averages and the swing tops will be your best indicators.
Semiconductor Sellers Didn’t Wait for the Bell
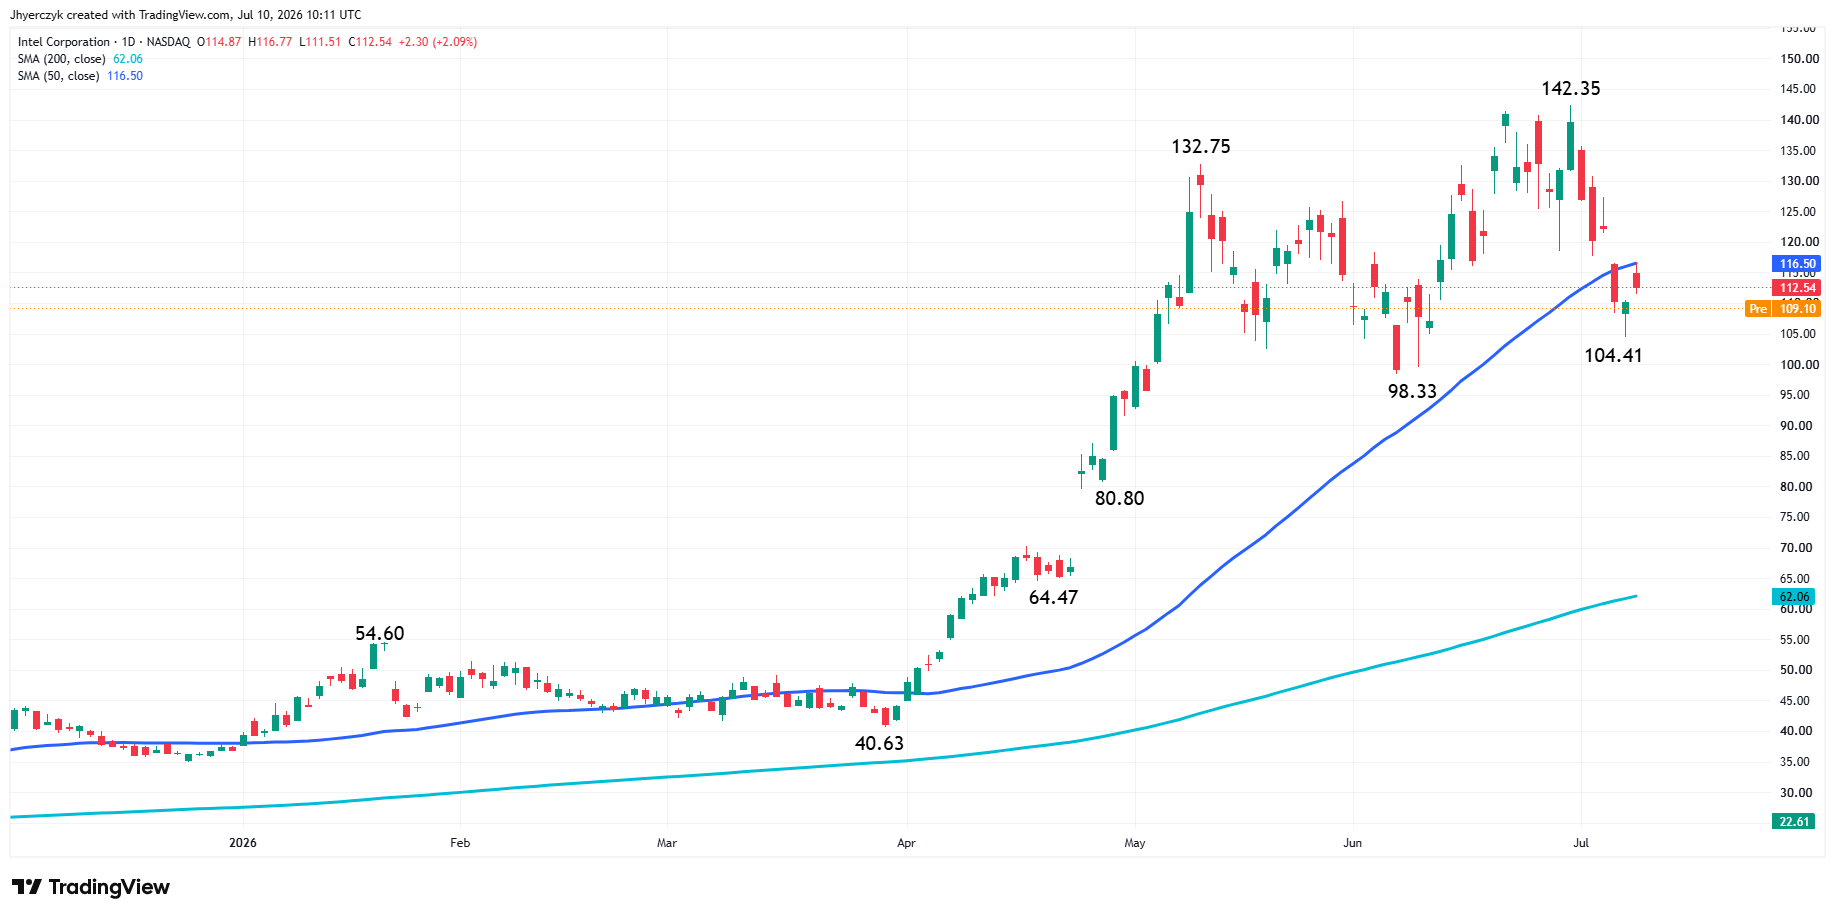
Thursday’s chip rally lasted exactly one session. Intel fell more than 3% in pre-market trading. Micron, Marvell Technology, and Lam Research each gave back more than 2%. Nvidia, Broadcom, and AMD are all lower. The semiconductor ETFs are off 1.2% to 1.4% across the board and the selling started before most traders were at their desks.
SK Hynix makes its Nasdaq debut later today after pricing American shares around $149. The stock added 1.3% in Asian trading overnight. A strong open could stabilize the group heading into next week. A soft one gives sellers another reason to press.
Iran Headline Gave Thursday’s Rally Room to Run
President Donald Trump said Thursday that Iran had reached out about a possible deal, with other countries helping to facilitate talks. Oil dropped on the headline and stocks ran with the relief. That is the same sequence that has worked all year. Iran headline moves crude, crude reprices risk appetite, and the indexes follow inside the session. Nothing in Friday’s pre-market is adding to it.
The 10-year U.S. Treasury yield is sitting near 4.54% and bond traders are not moving until the data or the Fed give them a reason. VIX fear pricing fell back near 16 after spiking earlier in the week but the options market is telling a different story. Volatility in the large-cap tech names is running above the index and institutional money is still buying downside protection. The headline number says calm. The book underneath says something else.
Stocks in the News
South Korea’s Kospi jumped 2.5% overnight with Samsung leading the move. Japan’s Nikkei gained 1.2%.
China’s main stock index dropped nearly 2% while European markets are edging lower on tech weakness.
Delta Air Lines reports second-quarter earnings Friday morning and the print sets the early tone for the airline group heading into earnings season.
What to Watch
The chip trade is the only trade this morning. Thursday’s rally ran hard on Iran relief and semiconductor strength and Friday is testing how much of that move was real. SK Hynix pricing at $149 makes the debut a referendum on the memory chip bid specifically. A clean listing keeps the group intact. A fade puts Thursday’s entire chip rally under pressure and the Nasdaq weekly gain with it.
September S&P 500 futures are sitting above the 50-day moving average at 7,504.25 and the compression in the chart says the next move out of this range is going to be fast.
Vix fear pricing near 16 with institutional protection bids underneath means the next spike comes without much warning. The Dow losing ground for the week while the Nasdaq holds its gain is the kind of split that resolves with rotation or breaks with tech dragging everything lower. Either way the catalyst is close.
More Information in our Economic Calendar.