The S&P 500 formed a slightly negative candle on Friday, but it appears more than likely we are going to continue to go sideways in general. If we can
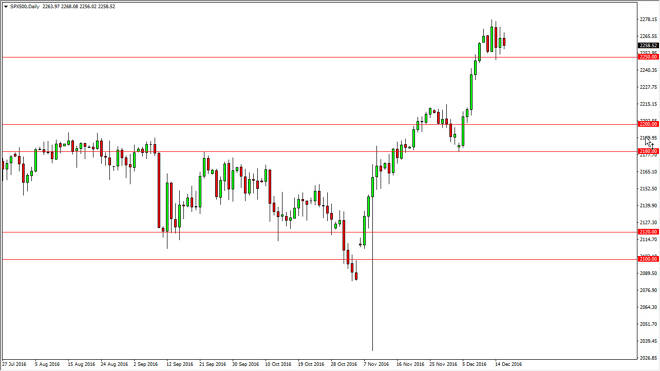
The S&P 500 formed a slightly negative candle on Friday, but it appears more than likely we are going to continue to go sideways in general. If we can break down below the 2250 level, the market will more than likely find support somewhere between here and 2200. If we break above the 2275 level, the market should continue to go much higher, perhaps reaching towards the 2300 level, and then the 2350 level. Ultimately, I have no interest whatsoever in selling this market, but do recognize that we are a bit extended at this point.
Chris is a proprietary trader with more than 20 years of experience across various markets, including currencies, indices and commodities. As a senior analyst at FXEmpire since the website’s early days, he offers readers advanced market perspectives to navigate today’s financial landscape with confidence.