
Advertisement
Advertisement

Two AI Market Leaders Are on Sale

By: 
Lucas Downey
Wall Street buildings and panel

AI has been THE trade for a while. But it’s been under pressure lately – and it presents an incredible opportunity.

Specifically, storage and memory stocks are in a bear market. And that means two AI market leaders are on sale.

Loading

Companies With Great Fundamentals Are Way Down

Equity prices reflect supply and demand in the short term. But over time, prices reflect earnings power.
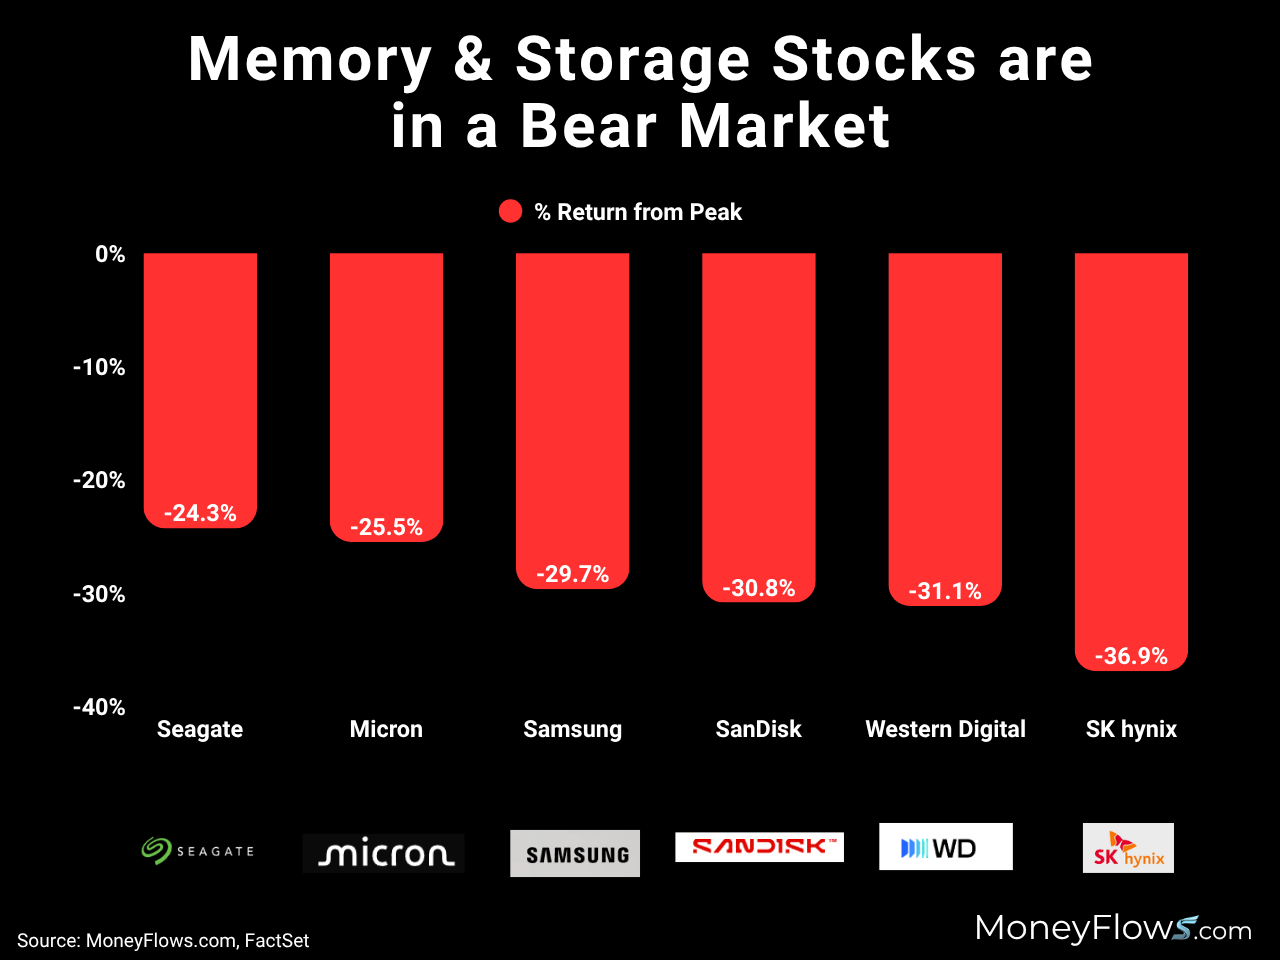
Sometimes short-term action creates imbalances. It’s happening now with AI memory stocks. Some companies with great fundamentals are way down, including SK Hynix (SKHY), Western Digital (WDC), SanDisk (SNDK), and Micron (MU):

Bar chart showing percentage return from peak for memory and storage stocks, indicating a bear market with all stocks displaying negative returns. Red bars represent declines ranging from -24.3% for Seagate to -36.9% for SK hynix, highlighting significant losses across major companies like Micron, Samsung, SanDisk, and Western Digital.
Top AI memory stocks are averaging a decline of 29.7% from their peaks. Source: MoneyFlows.com

Is it time to sell and head to cash? Or are great companies on sale and it feels uncomfortable?

For me, it’s door number two. Some great stocks are oversold.

Key AI Suppliers

The memory and storage supply bottleneck took hold last year and it’ll be with us for a while. Data center build-outs aren’t stopping, keeping chip demand high.

That’s great for Micron. The $1 trillion memory giant is a key supplier for hyperscalers. The company has noted how HBM, DRAM, and NAND shortages will persist well past 2026.

The latest selloff has sent shares down 25% from highs, driving the forward price-earnings ratio to just 6.3 times:
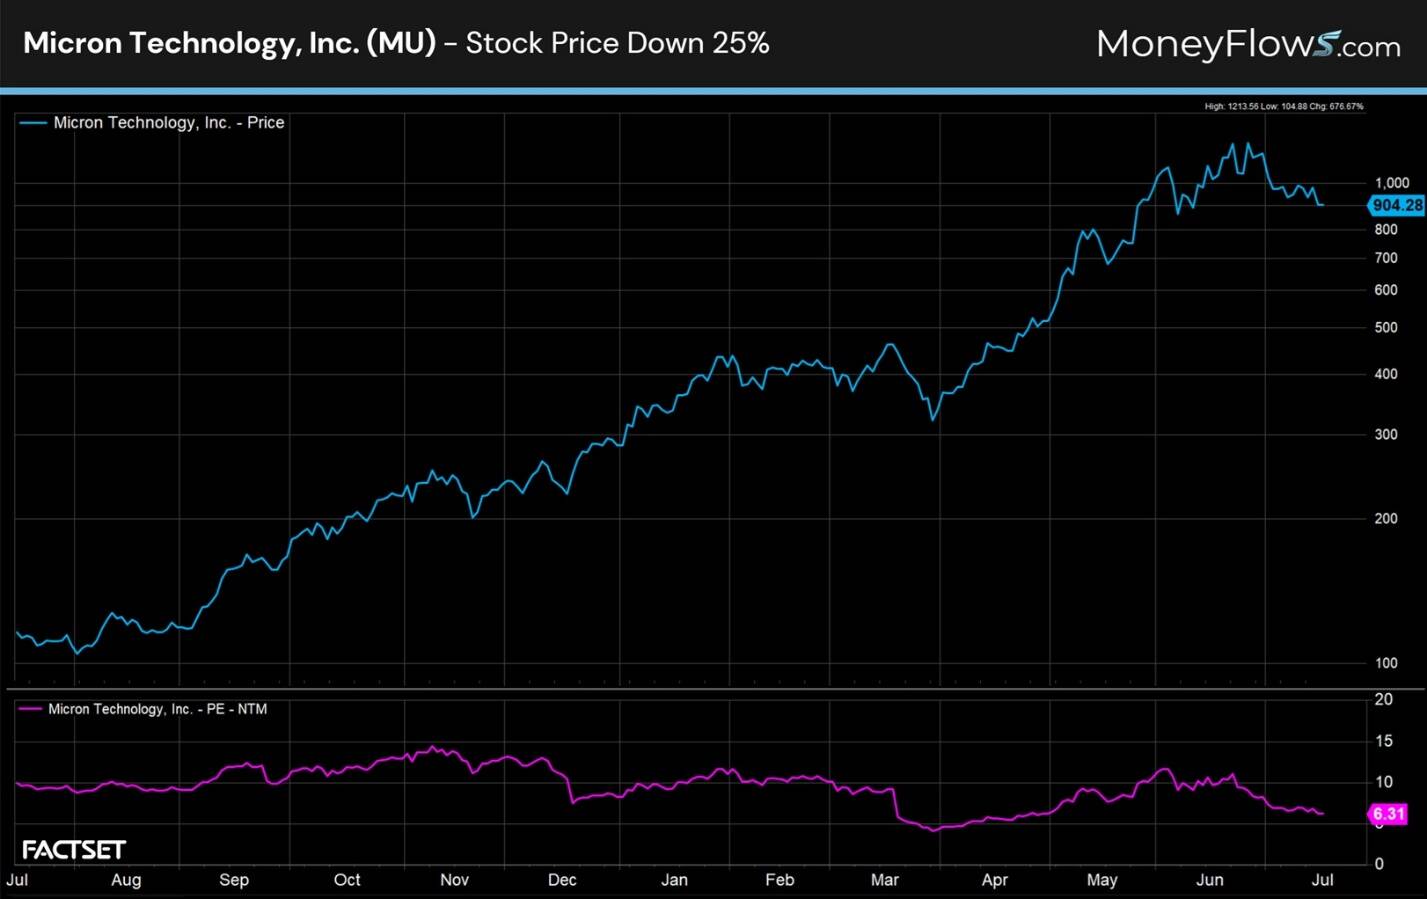
Line chart showing Micron Technology, Inc. stock price and price-to-earnings ratio from July to July, with stock price rising from around 100 to over 900 before a slight decline. Chart features blue line for stock price on top graph and purple line for P/E ratio on bottom graph, highlighting a 25% stock price drop and P/E ratio fluctuating mostly between 5 and 15.
MU is in growth mode, as earnings continue to improve. The PEG ratio sits at just 0.05, making it the cheapest stock in the S&P 500 by this metric. Source: MoneyFlows.com

This pullback is attractive because per-share earnings are expected to grow to over $166 by 2028. That helps attract institutional investors, which has been no issue for Micron.

It’s been under big accumulation, drawing many outlier inflows:
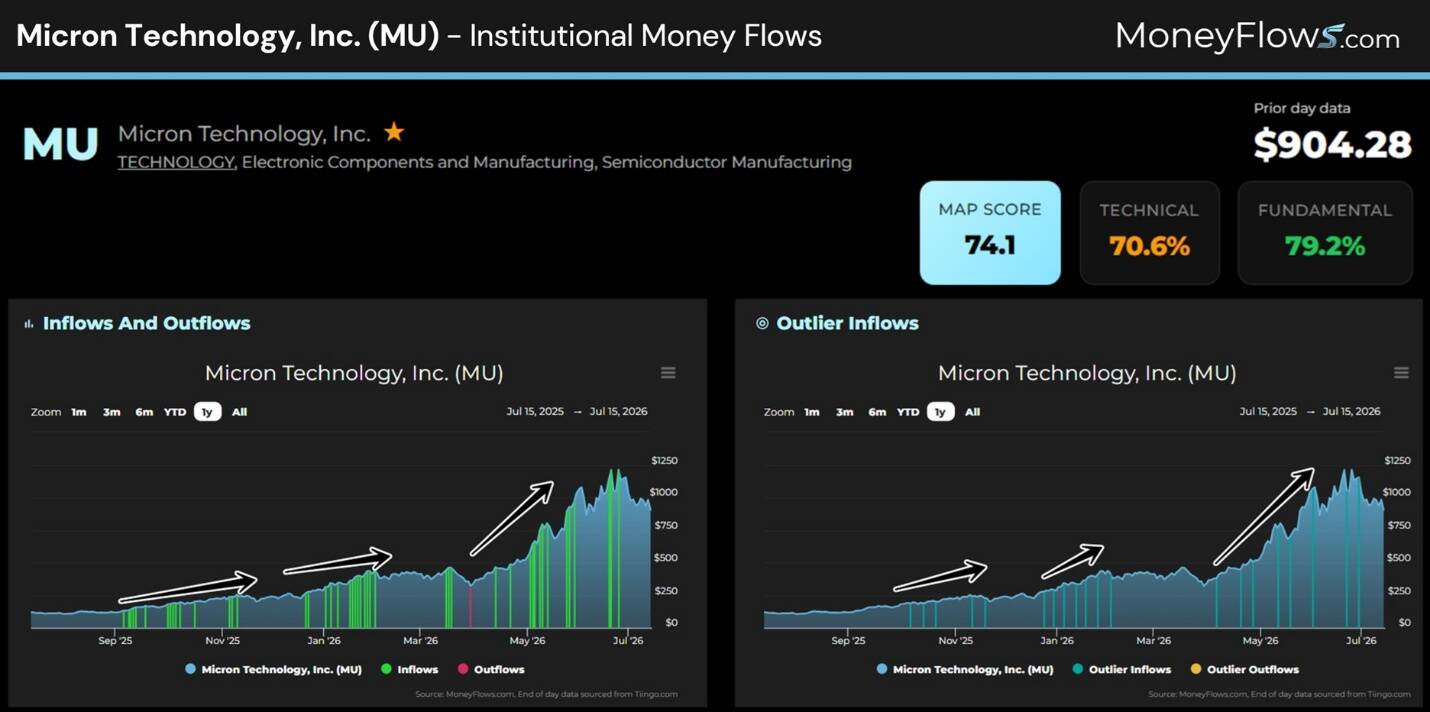
Bar chart showing institutional money flows for Micron Technology, Inc. from July 15, 2023, to July 15, 2024, with inflows and outflows represented by green and red bars, respectively, highlighting a general upward trend in inflows and notable spikes in outlier inflows. Key metrics include a MAP score of 74.1, technical score of 70.6%, fundamental score of 79.2%, and a prior day closing price of $904.28.
Low-volume summertime gyrations are normal. The longer trend on MU is upward – 789% in a year – even with the bumps. Source: MoneyFlows.com

Another oversold AI leader is SanDisk, the $250 billion flash memory giant.

Shares have fallen 31%, perhaps due to emotional short-term action:
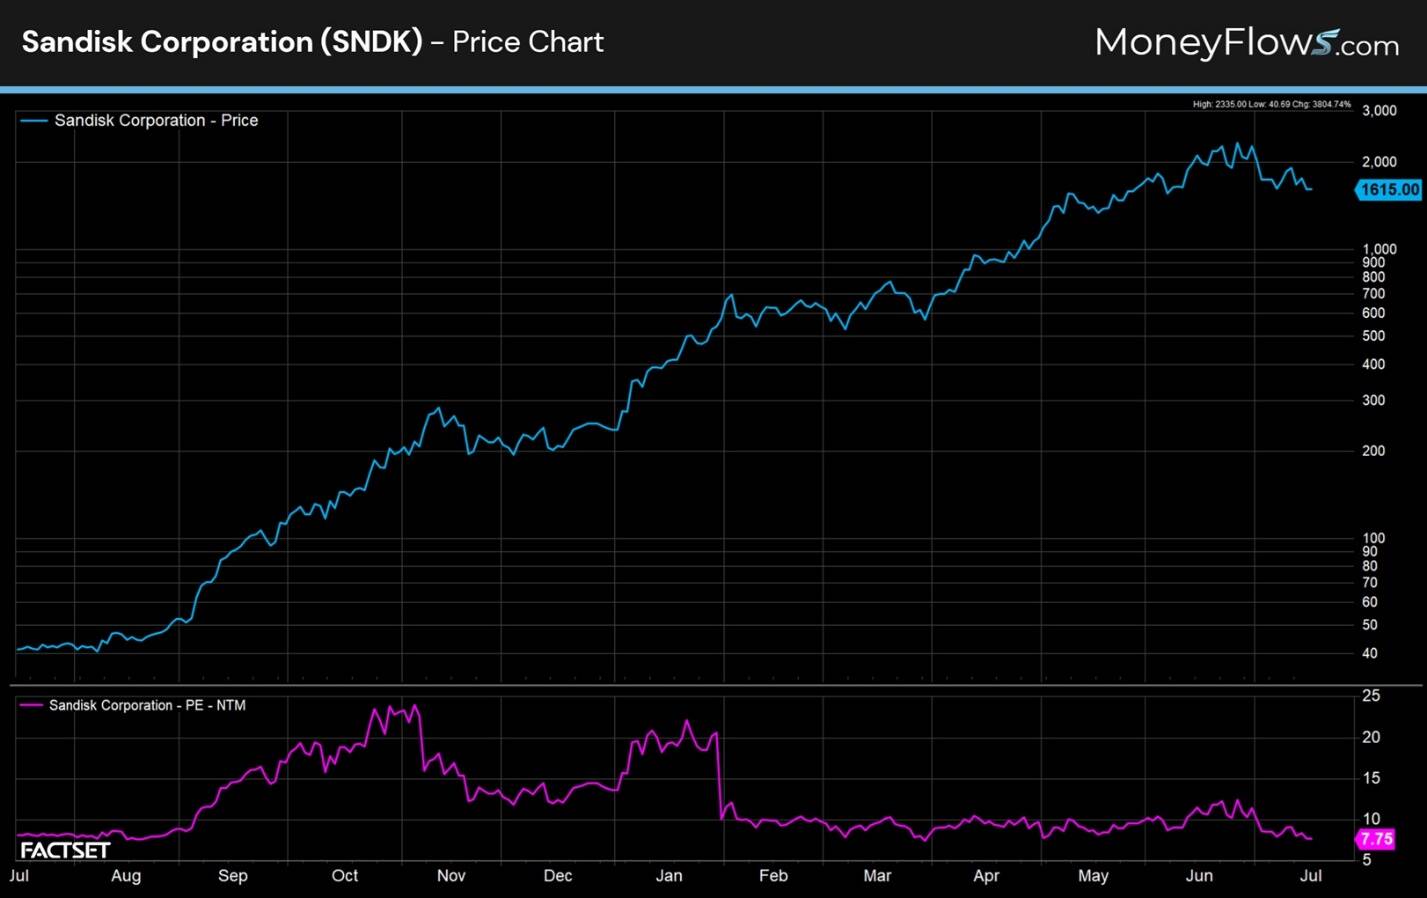
Line chart showing Sandisk Corporation (SNDK) stock price and price-to-earnings (P/E) ratio over one year from July to July. Stock price (blue line) rises steadily from around 200 to a peak near 2,000 before slightly declining, while P/E ratio (purple line) fluctuates between 5 and 20, dropping sharply to near 5 in March and remaining low.
SNDK’s P/E has dropped to 7.7 times forward earnings and sports a one-year EPS growth outlook of 211.9%. Source: MoneyFlows.com

Some think this could be a hard fall from the peak. Others view it as a dip worth buying.

I’m in the latter camp, considering EPS is expected to hit nearly $207 in 2027 and over $241 in 2028, after being $66.72 in 2026. When earnings climb, prices tend to follow.

Institutions have not soured on the company. In fact, the recent consolidation looks like prior cooldowns:
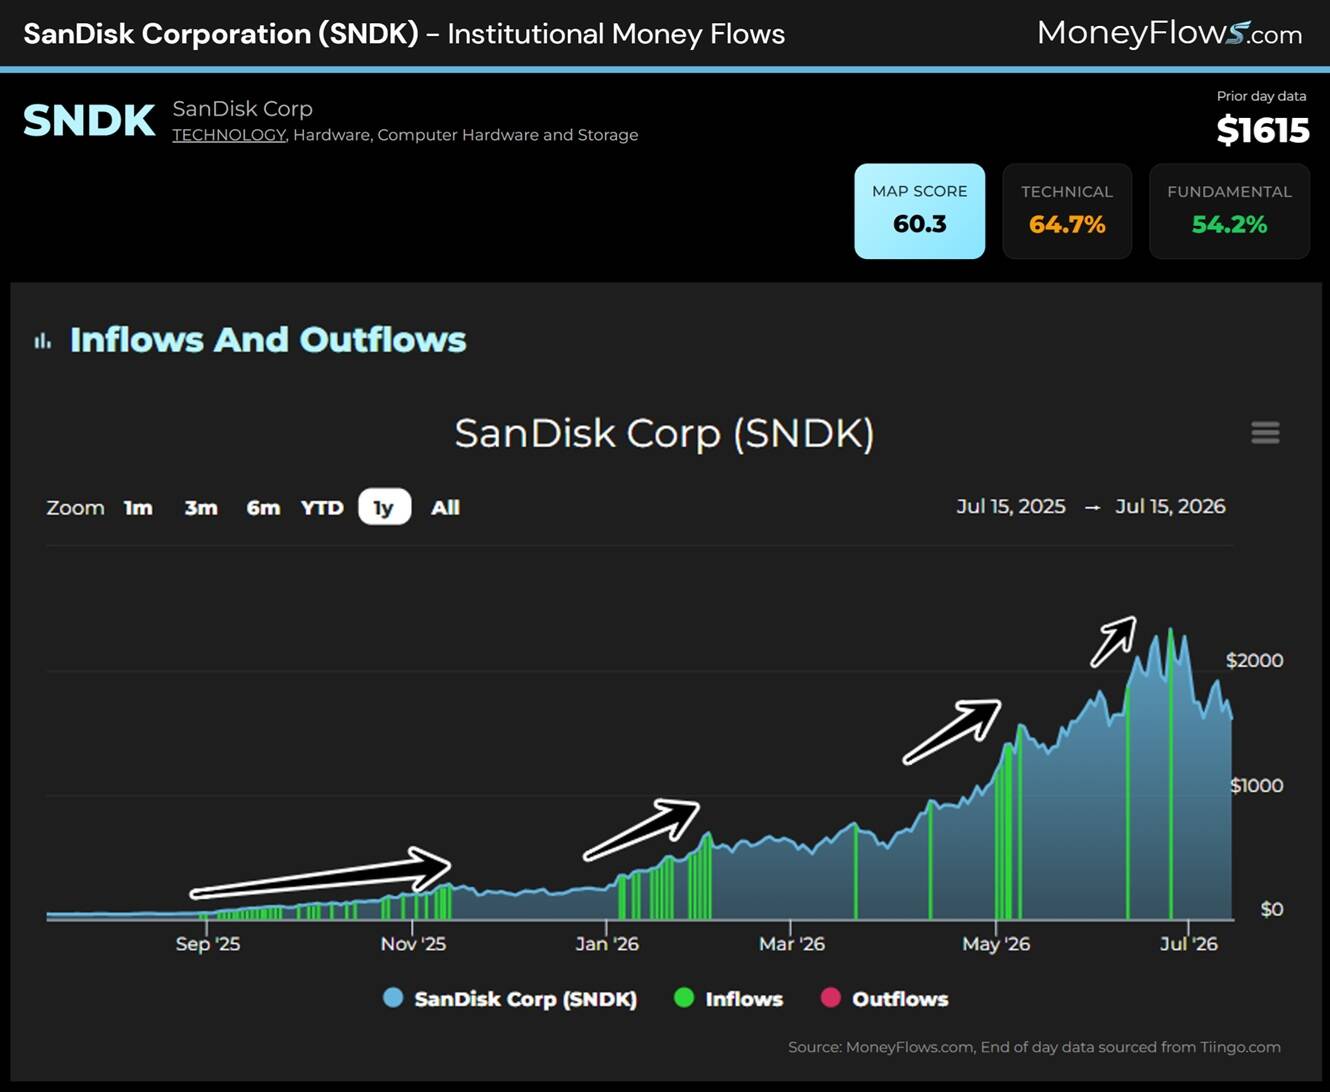
Line and bar chart showing institutional money flows for SanDisk Corp (SNDK) from July 2025 to July 2026, with blue line representing stock price and green/red bars indicating inflows and outflows. Chart highlights a steady price increase from around $0 to over $1600, with notable spikes in inflows around November 2025, January 2026, and May 2026.
SNDK is up over 3,000% since its first signal within the last year. Source: MoneyFlows.com

Don’t get me wrong, these selloffs aren’t fun. But if you step back and take a longer view, they’re simply part of the climb higher for outlier stocks.

Believe it or not, pullbacks are common.

But if you expect them as part of market supply and demand, there are opportunities to be had.

If you are a Registered Investment Advisor (RIA) or a serious investor, take your investing to the next level and follow our free weekly MoneyFlows insights.

Disclosure: at the time of publication, the author holds no positions in SKHY, WDC, SNDK, or MU.

Loading

About the Author

Lucas Downeycontributor

Lucas is a well-versed equity investor and educator. He currently is co-founder of research and analytics firm, MAPsignals.com, which focuses on finding outlier stocks by following the Big Money.

Latest news and analysis

    Loading
Advertisement
Loading
Advertisement
Advertisement
Advertisement
Advertisement