
Advertisement
Advertisement
US Dollar Index (DX) Futures Technical Analysis – August 10, 2015 Forecast
By:
September U.S. Dollar Index futures posted a potentially bearish closing price reversal top on Friday, indicating that the selling is greater than the
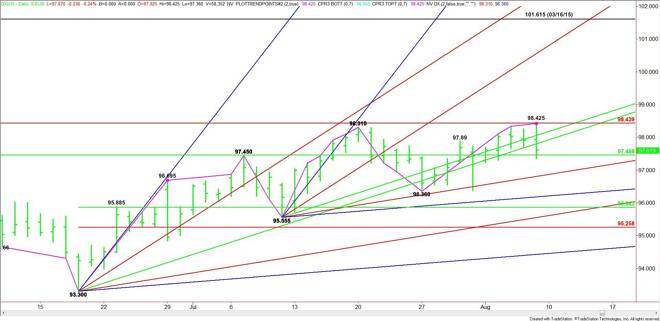
September U.S. Dollar Index futures posted a potentially bearish closing price reversal top on Friday, indicating that the selling is greater than the buying at current price levels. A trade through 97.36 will confirm the chart pattern. This could trigger the start of a two to three day correction.
Friday’s weak close also put the index on the weak side of a pair of uptrending angles at 97.93 and 98.18. These angles are potential resistance points today along with the closing price reversal top at 98.425 and the major Fibonacci level that stopped the rally at 98.44.
The first downside target is a major 50% level at 97.46. This price is also a trigger point for an acceleration to the downside with potential targets coming in at 96.86, 96.36 and 96.21. A trade through the main bottom at 96.36 will turn the main trend to down on the daily chart.
The new main range is 93.30 to 98.425. Its retracement zone at 95.86 to 95.26 is the primary downside target. An uptrending angle also passes through this zone at 95.61, making it a valid downside target also.
Watch the order flow and read the price action at 97.46 today. This should determine the direction of the market today. Overtaking the Fibonacci level at 98.44 will negate the closing price reversal chart pattern and trigger a possible acceleration to the upside with the next potential target 100.00. Taking out 97.46 could trigger an eventual break to at least 95.86.
About the Author
James Hyerczykauthor
James Hyerczyk is a U.S. based seasoned technical analyst and educator with over 40 years of experience in market analysis and trading, specializing in chart patterns and price movement. He is the author of two books on technical analysis and has a background in both futures and stock markets.


Advertisement