



US Dollar News: Strong Data Reinforces Fed’s Cautious Stance
The U.S. Dollar’s technical profile is underpinned by better than expected data which highlighted steady retail sales and a strong jobs market. June retail sales saw 0.2% month on month growth while the control group rose 0.4%, both indicating underlying resilience in consumer demand. Initial jobless claims came in at 221,000 which highlighted a strong labour market. The data has tempered expectations that the Fed will start cutting rates this year as retail sales and unemployment remain relatively strong even though overall growth has slowed.
Meanwhile, The Euro’s outlook is weighed down by slowing growth prospects in the eurozone with the ECB keeping rates stable at its 2.25% deposit rate, according to futures.
Sterling has also found support following the central bank’s hawkish policy stance after UK inflation remains too high. The consensus is that policymakers will be holding the Bank Rate at 3.75%. This view is consistent with persistent price pressures as well as some easing in the labor market, both before the next rate decision.
US Dollar Technical Analysis: DXY Rejected Below Trendline as Bears Defend 100.77
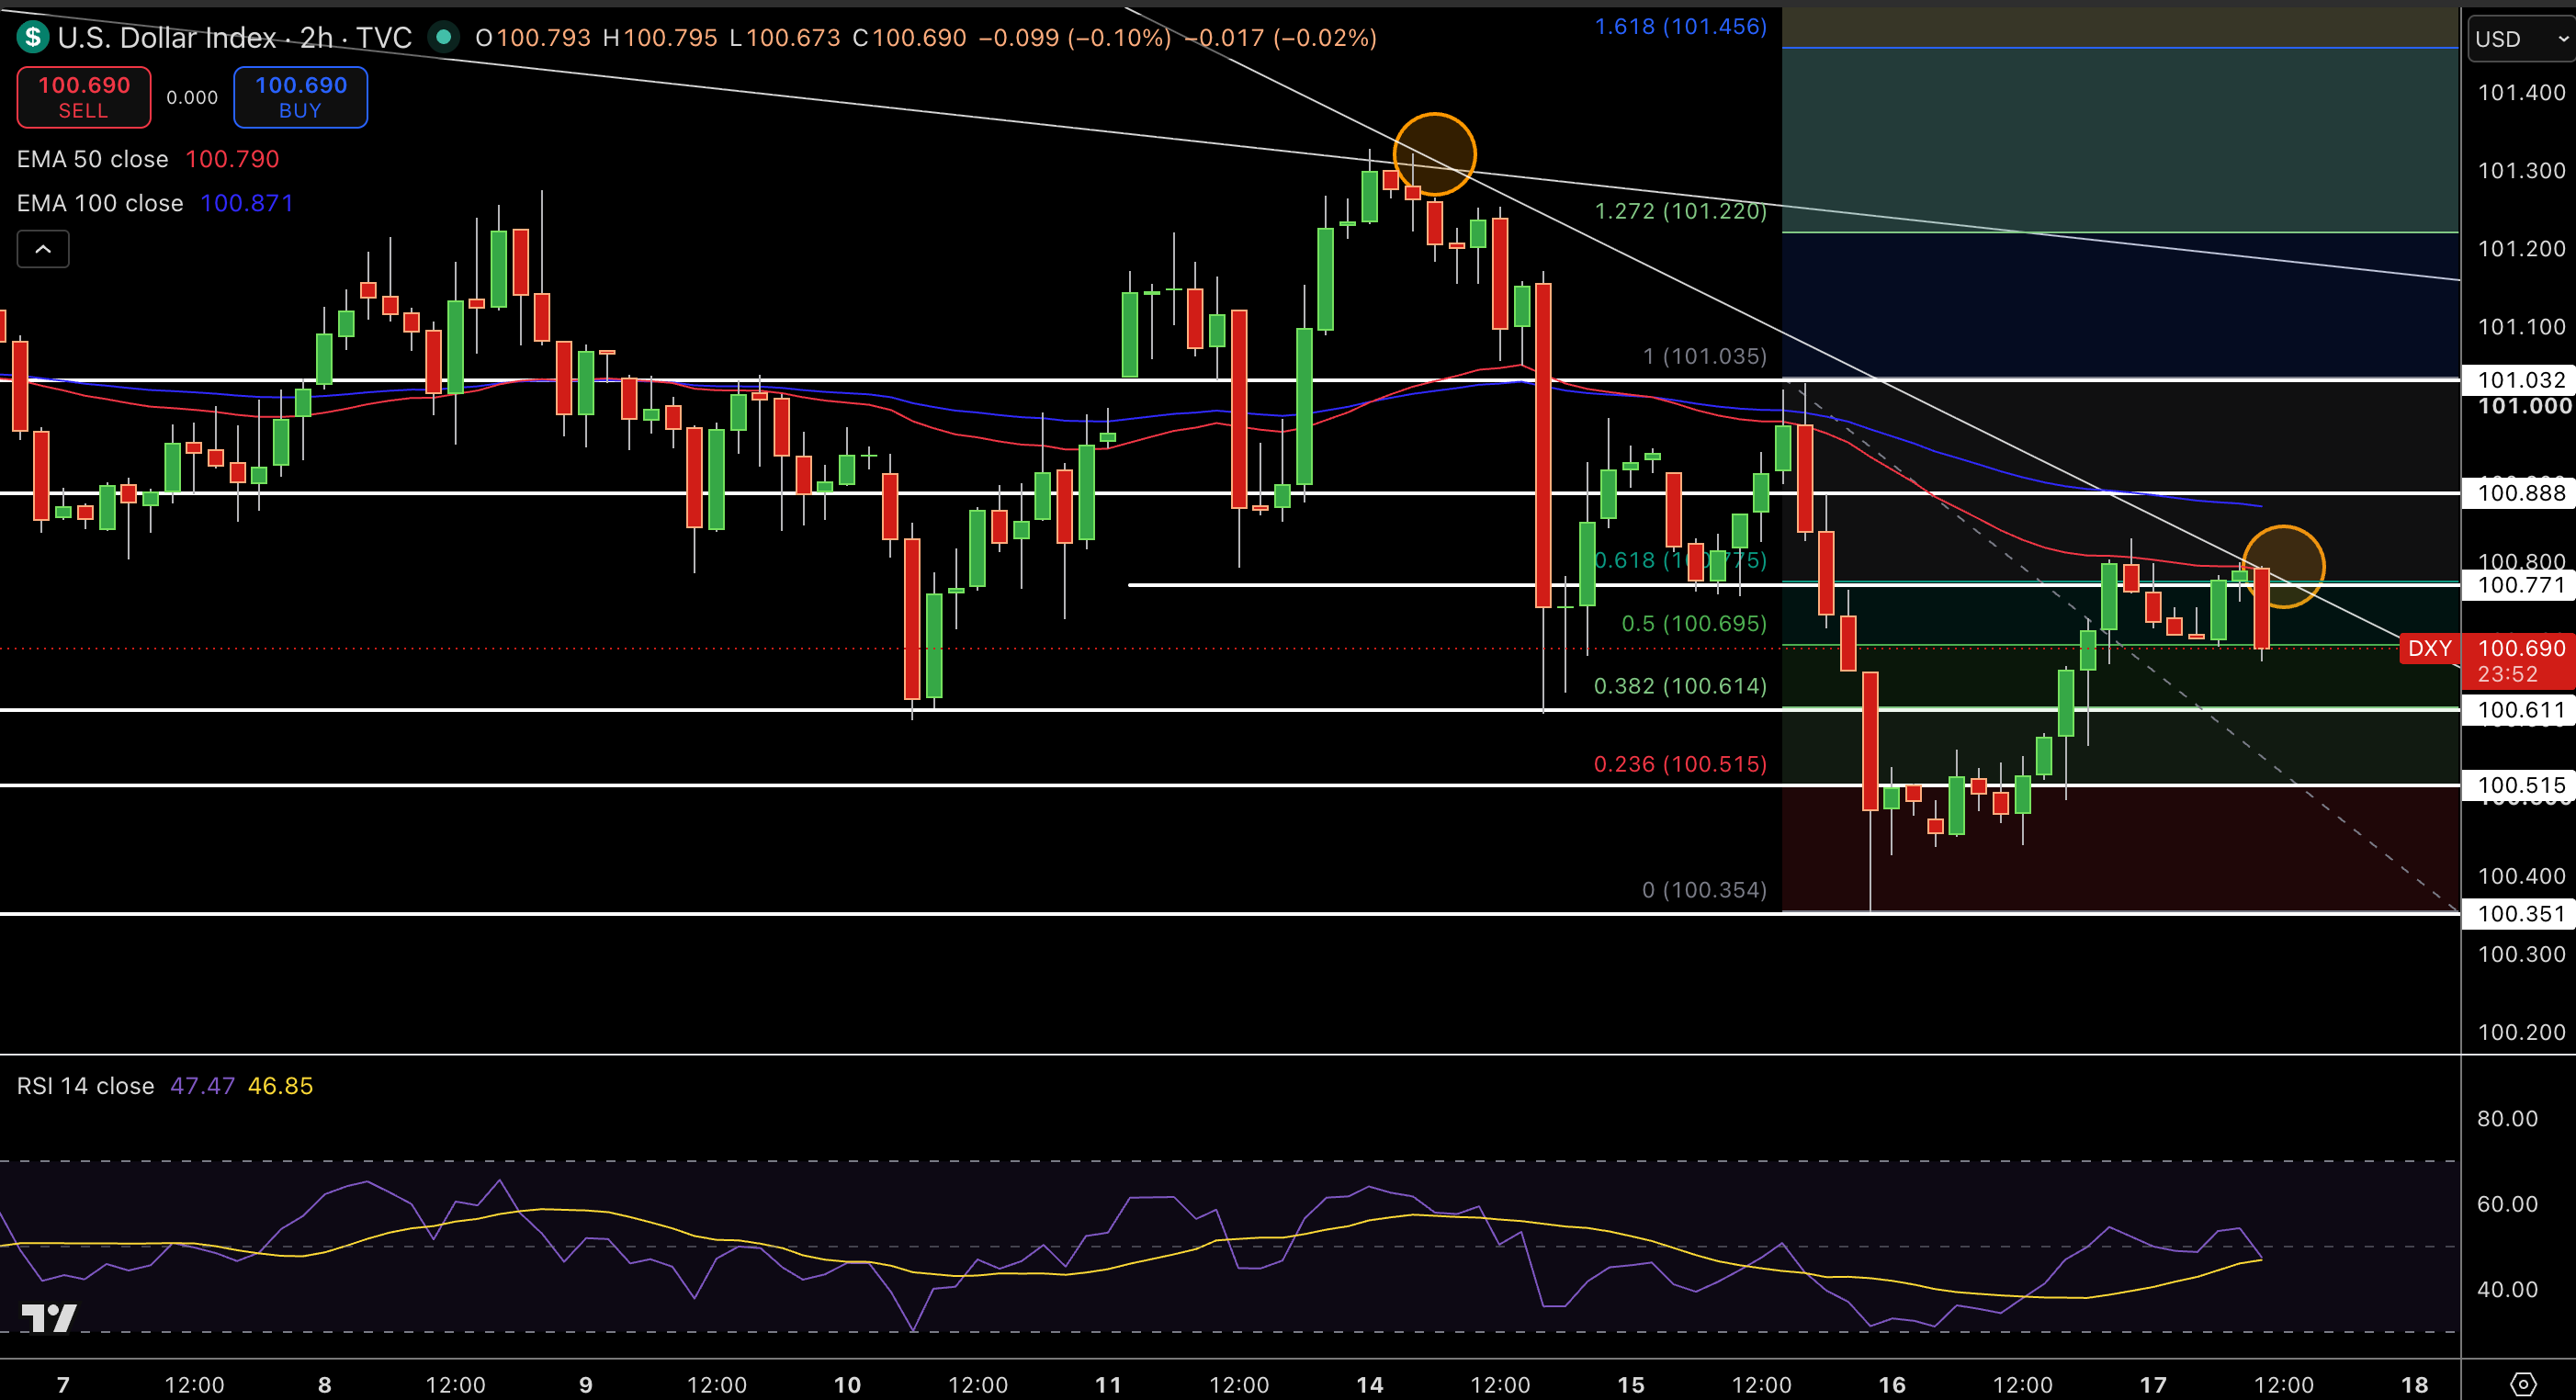
The US Dollar Index (DXY) is at 100.69, after another test off the descending trendline at 100.77 resistance. DXY remains below 100.79 (50 EMA) and 100.87 (100 EMA) and the trendline which has been a source of repeated tests, confirming the short term bearish bias.
The 100.61 support level is followed by 100.52 and 100.35 while 100.77 resistance is followed by 101.03.RSI has dropped to ~47, indicating a potential slowdown in buyer momentum and a neutral-bearish tone overall. I’ll wait for the market to trade through 100.77 on my way to 101.03, with 100.61 being an important key level to flip if traded through.
GBP/USD Technical Analysis: Pullback Holds Above Trendline as Uptrend Remains Intact
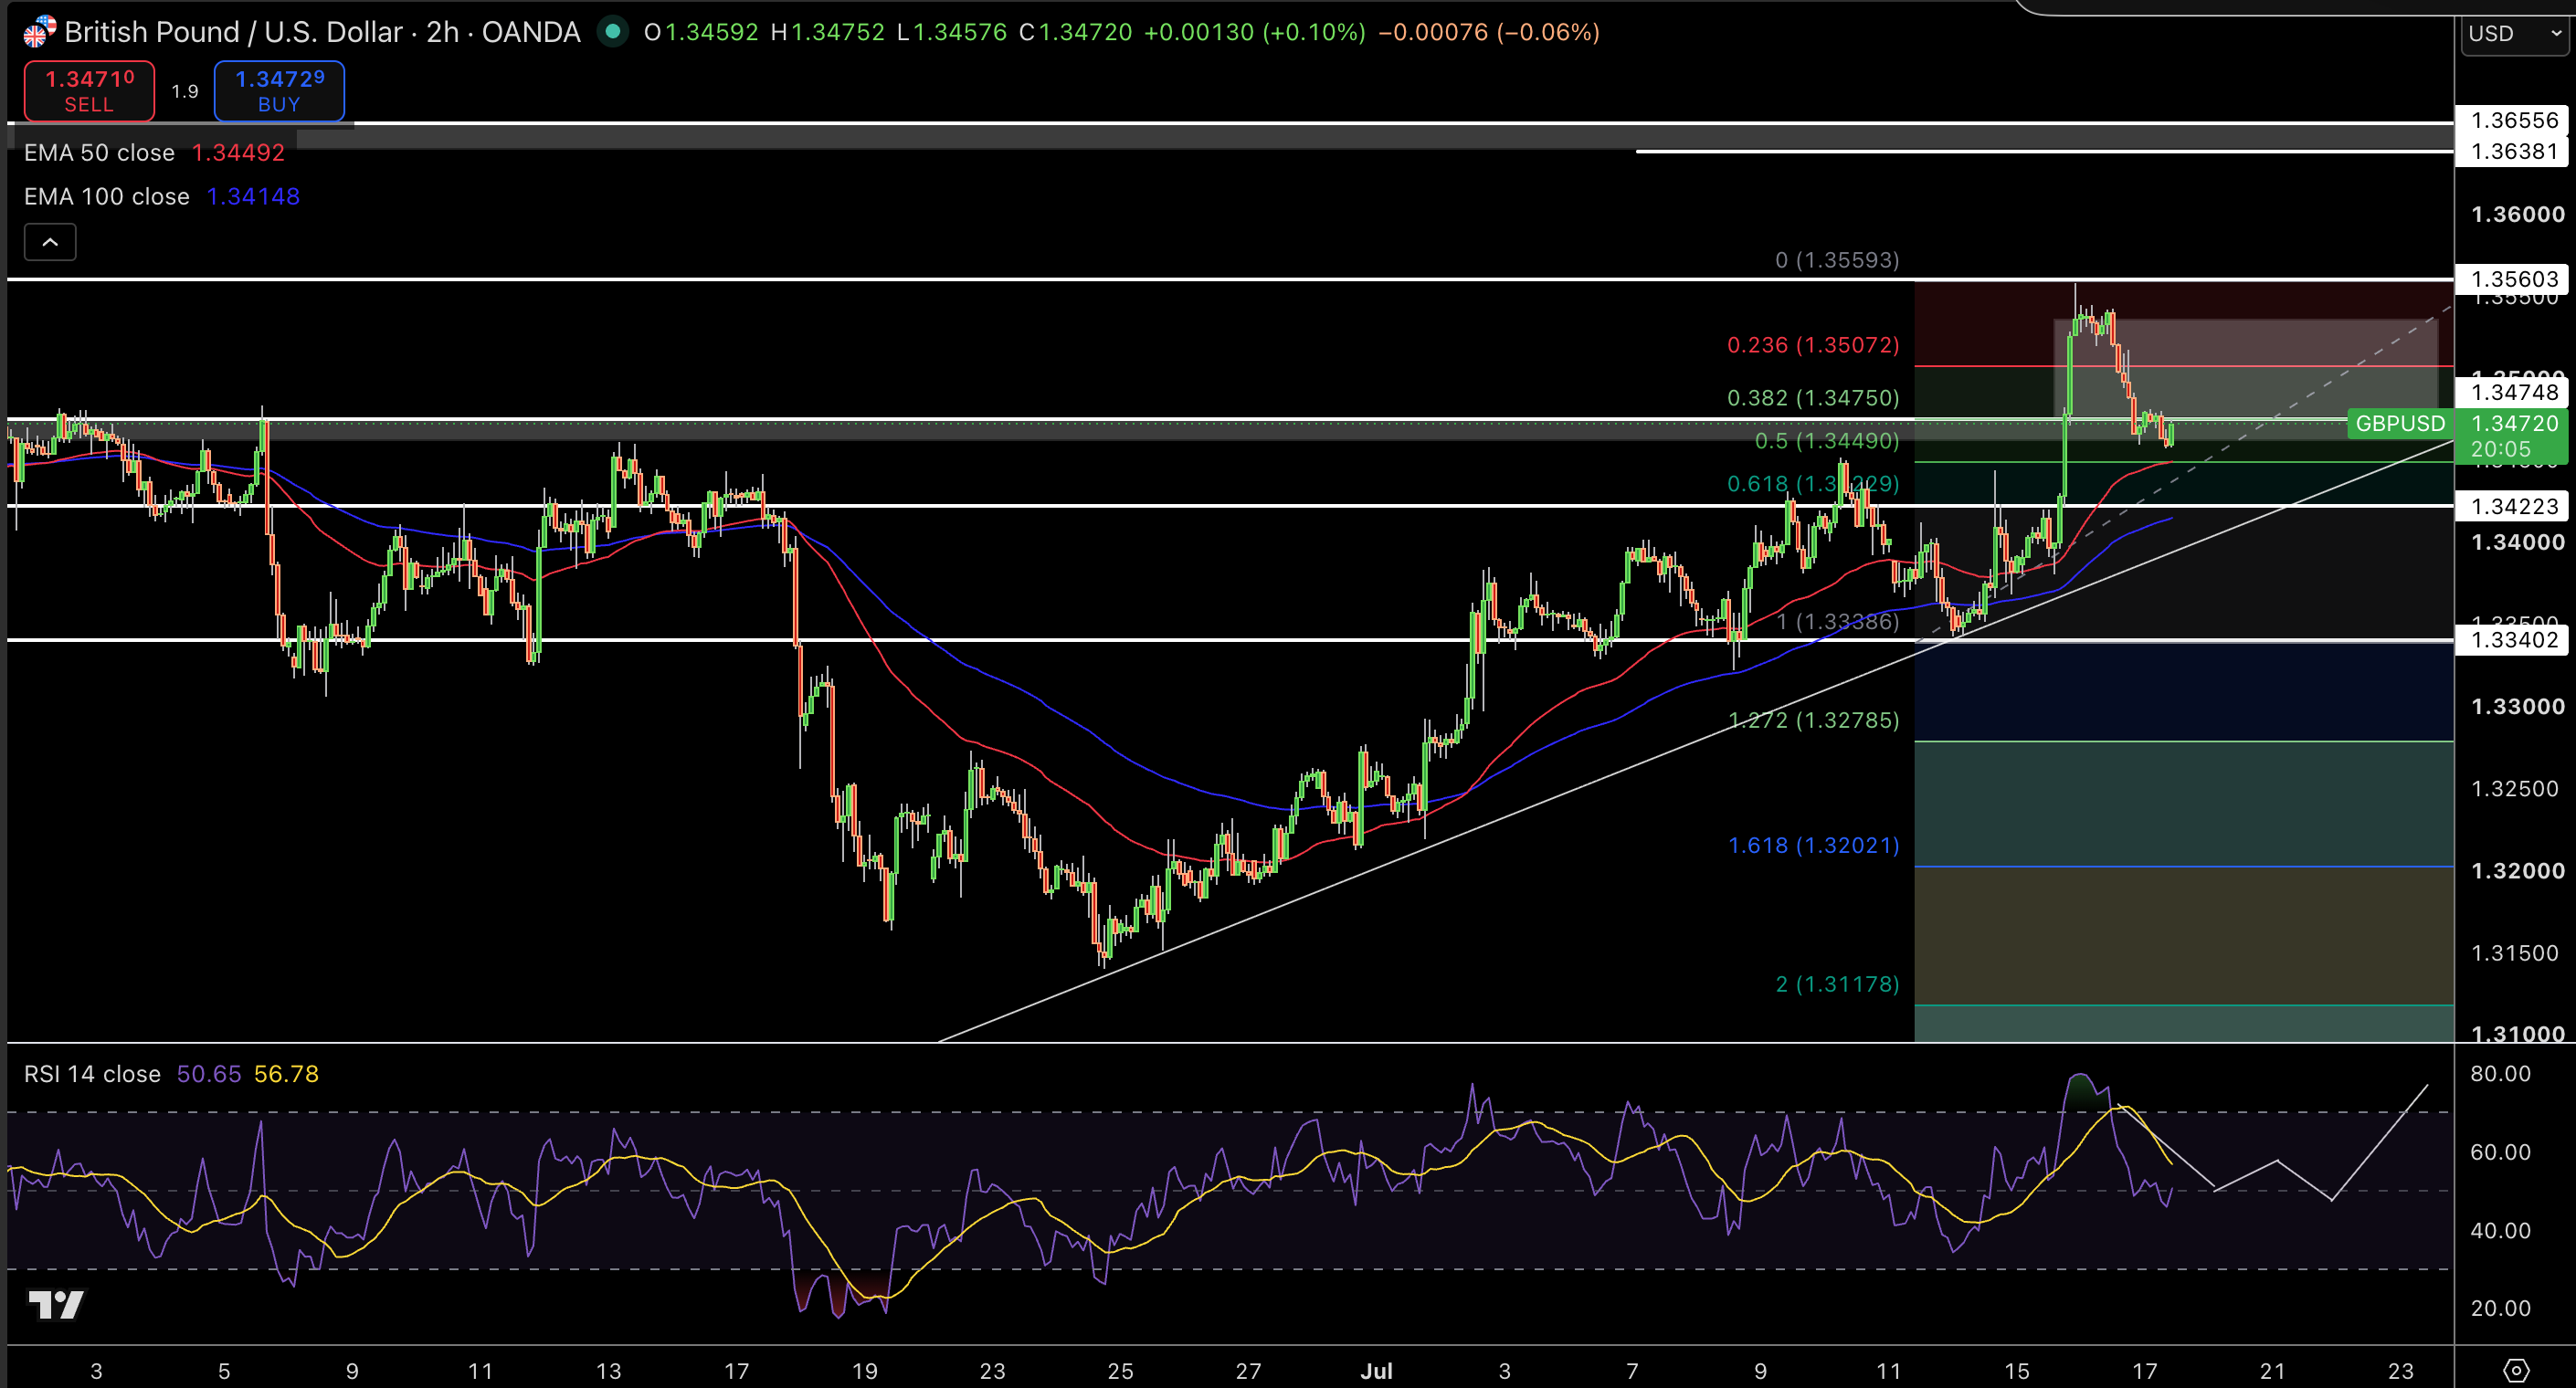
GBP/USD is near 1.3472 after a retreat from last week’s highs around 1.3559. Buyers are defending the trendline, as GBP/USD remains above the 50 EMA at 1.3449 and the 100 EMA at 1.3415. The price remains bullish despite a short term decline since higher highs and higher lows are intact on a larger picture.
GBP/USD faces 1.3507 resistance, with 1.3560 resistance ahead of that. Price is supported by 1.3449, which is followed by 1.3340 support. The RSI cooled to ~51, indicating that the correction has likely been a short term dip rather than a trend reversal. I’ll look to trade a breakout through 1.3507 on my way to 1.3560, with a drop below 1.3449 likely targeting 1.3340.
GBP/USD Price Forecast
Every new GBP/USD analysis as it publishes, today's technical signal and key levels, live price — on one page.
See all GBP/USD forecastsEUR/USD Technical Analysis: Bulls Hold Above 50 EMA While Testing Key Resistance
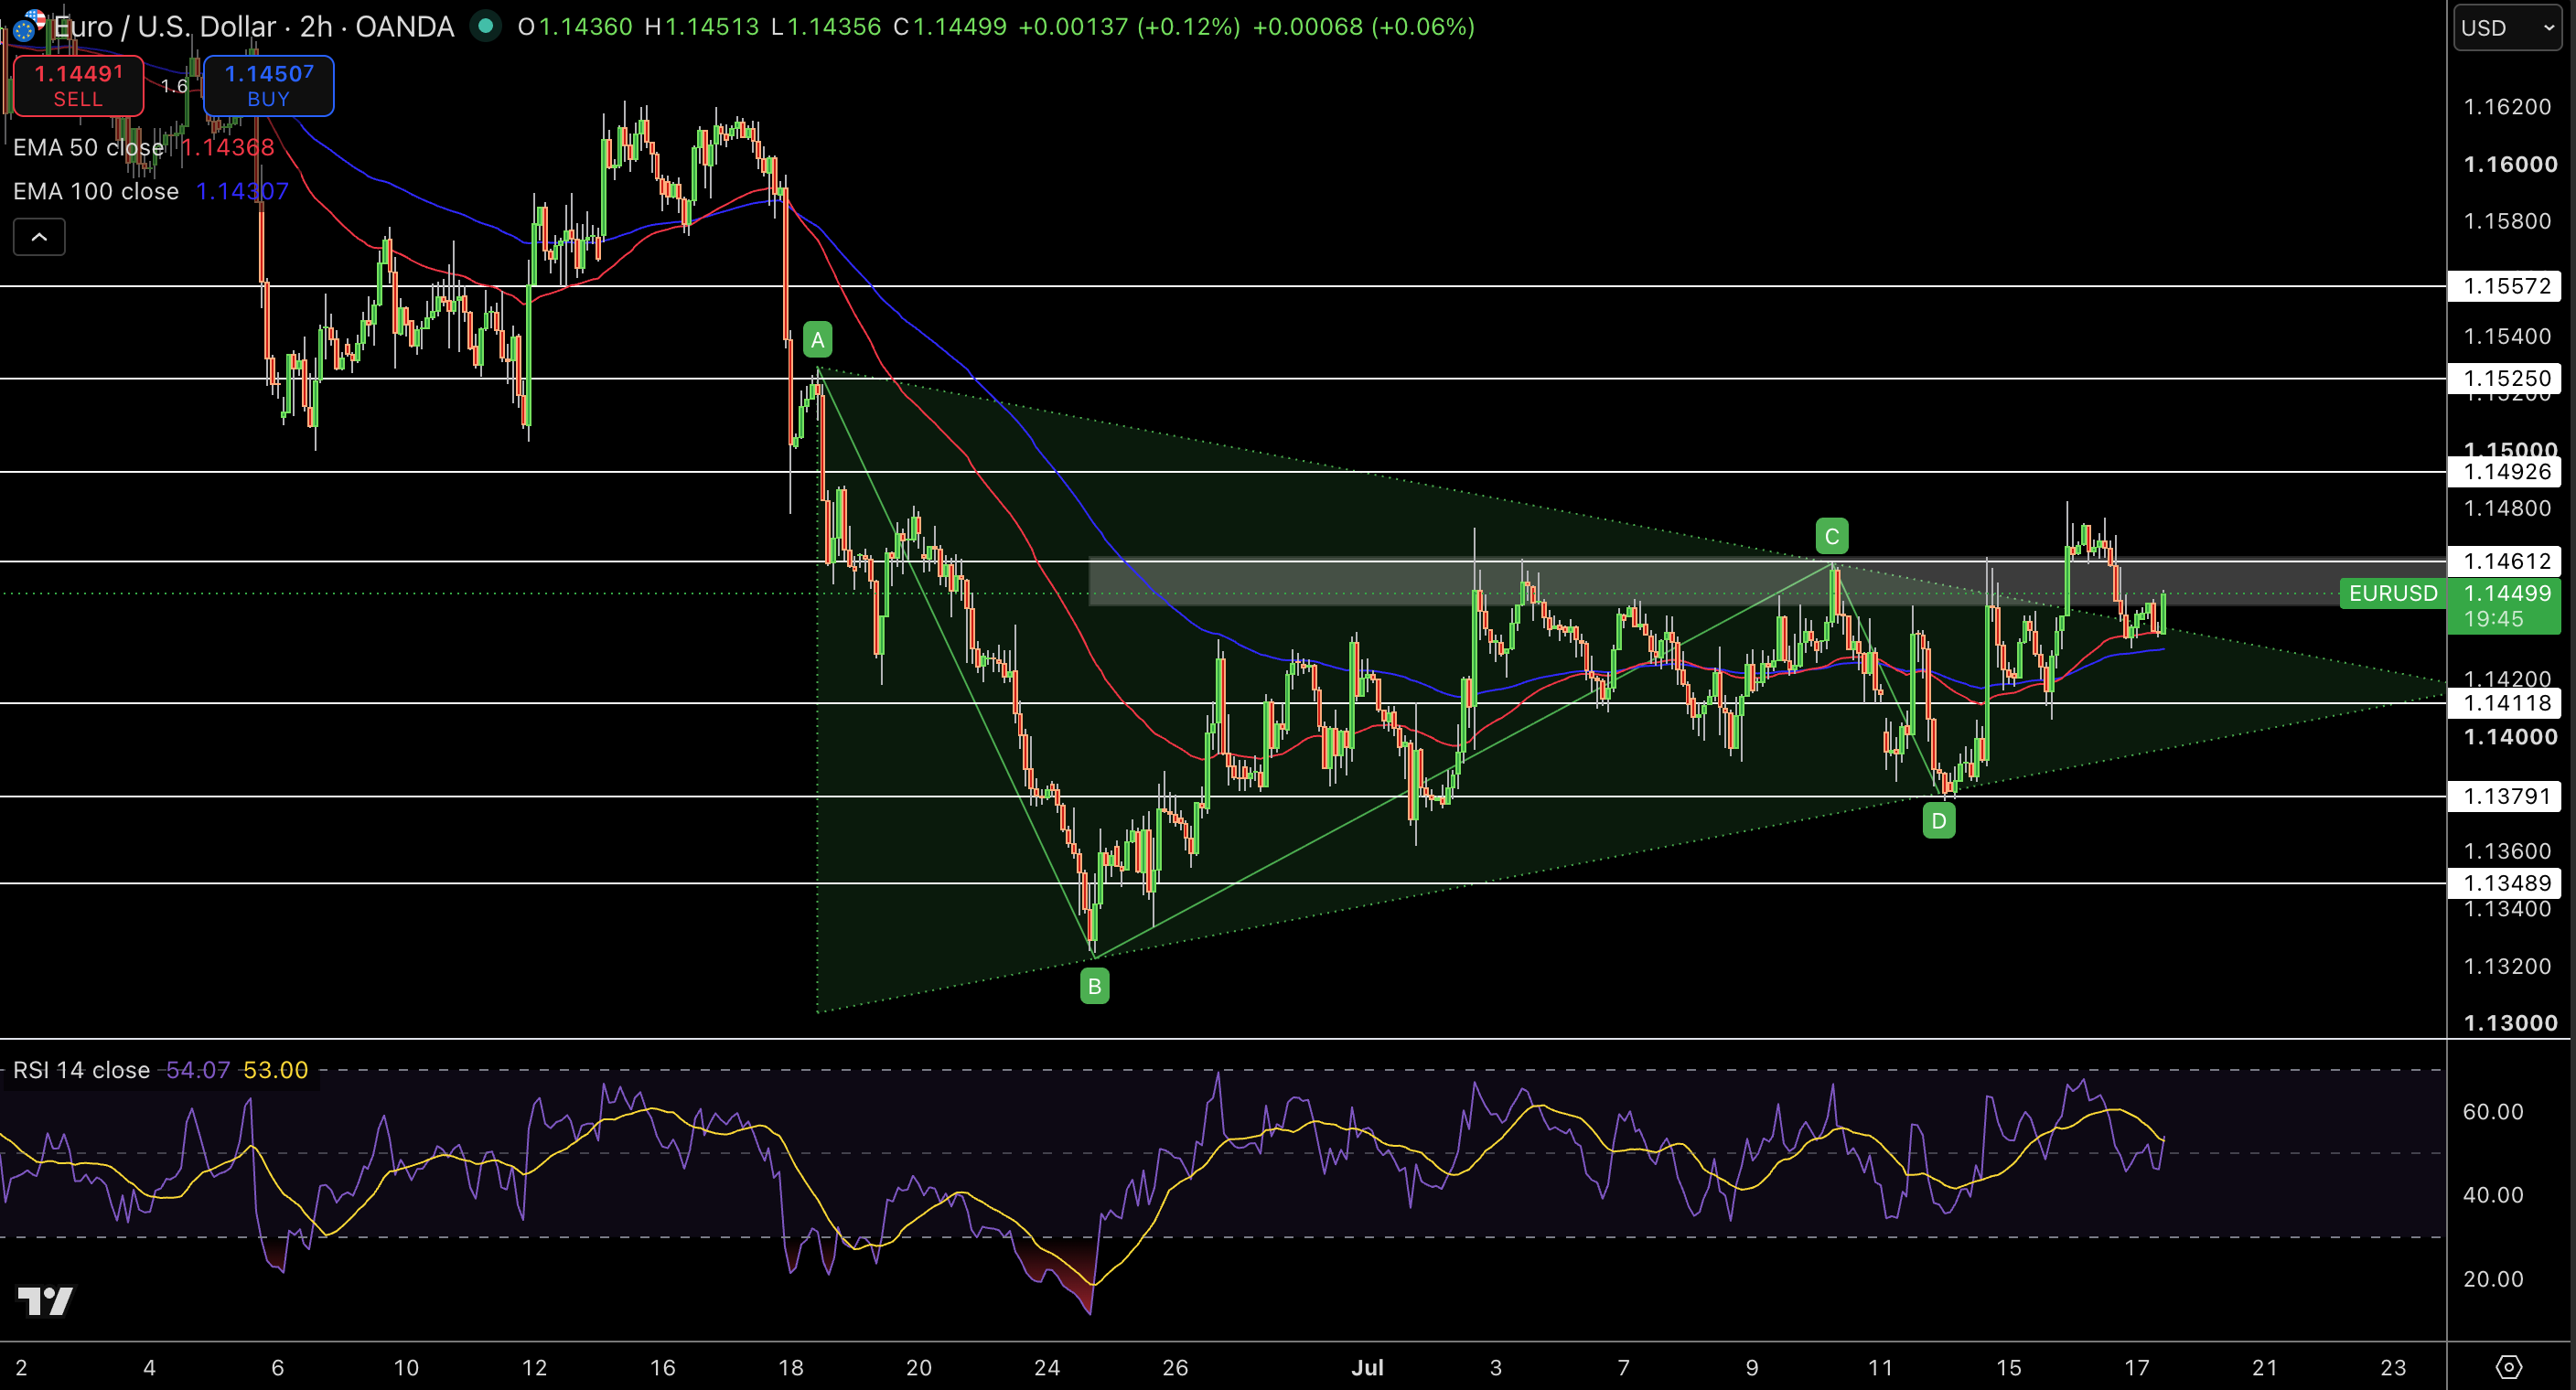
The Euro is at 1.1450, consolidating below the 1.1461 resistance level after extending its rally in the previous sessions. The 1.1437 (50 EMA) and 1.1431 (100 EMA) levels are still supporting price action and the market remains bullish despite being turned down by overhead resistance.
The trend structure resembles a tightening symmetrical triangle with 1.1412 support at 1.1379. The 1.1461 resistance is followed by 1.1493.
The RSI is hovering around ~54, indicating a low degree of bullish momentum with room before entering overbought territory. I’ll wait for confirmation of a 1.1461 breach on my way to 1.1493, with a breakdown at 1.1412 likely sending price back toward 1.1379.