USD/MXN Forecast: Can the Rate Gap Keep the Peso Bid?
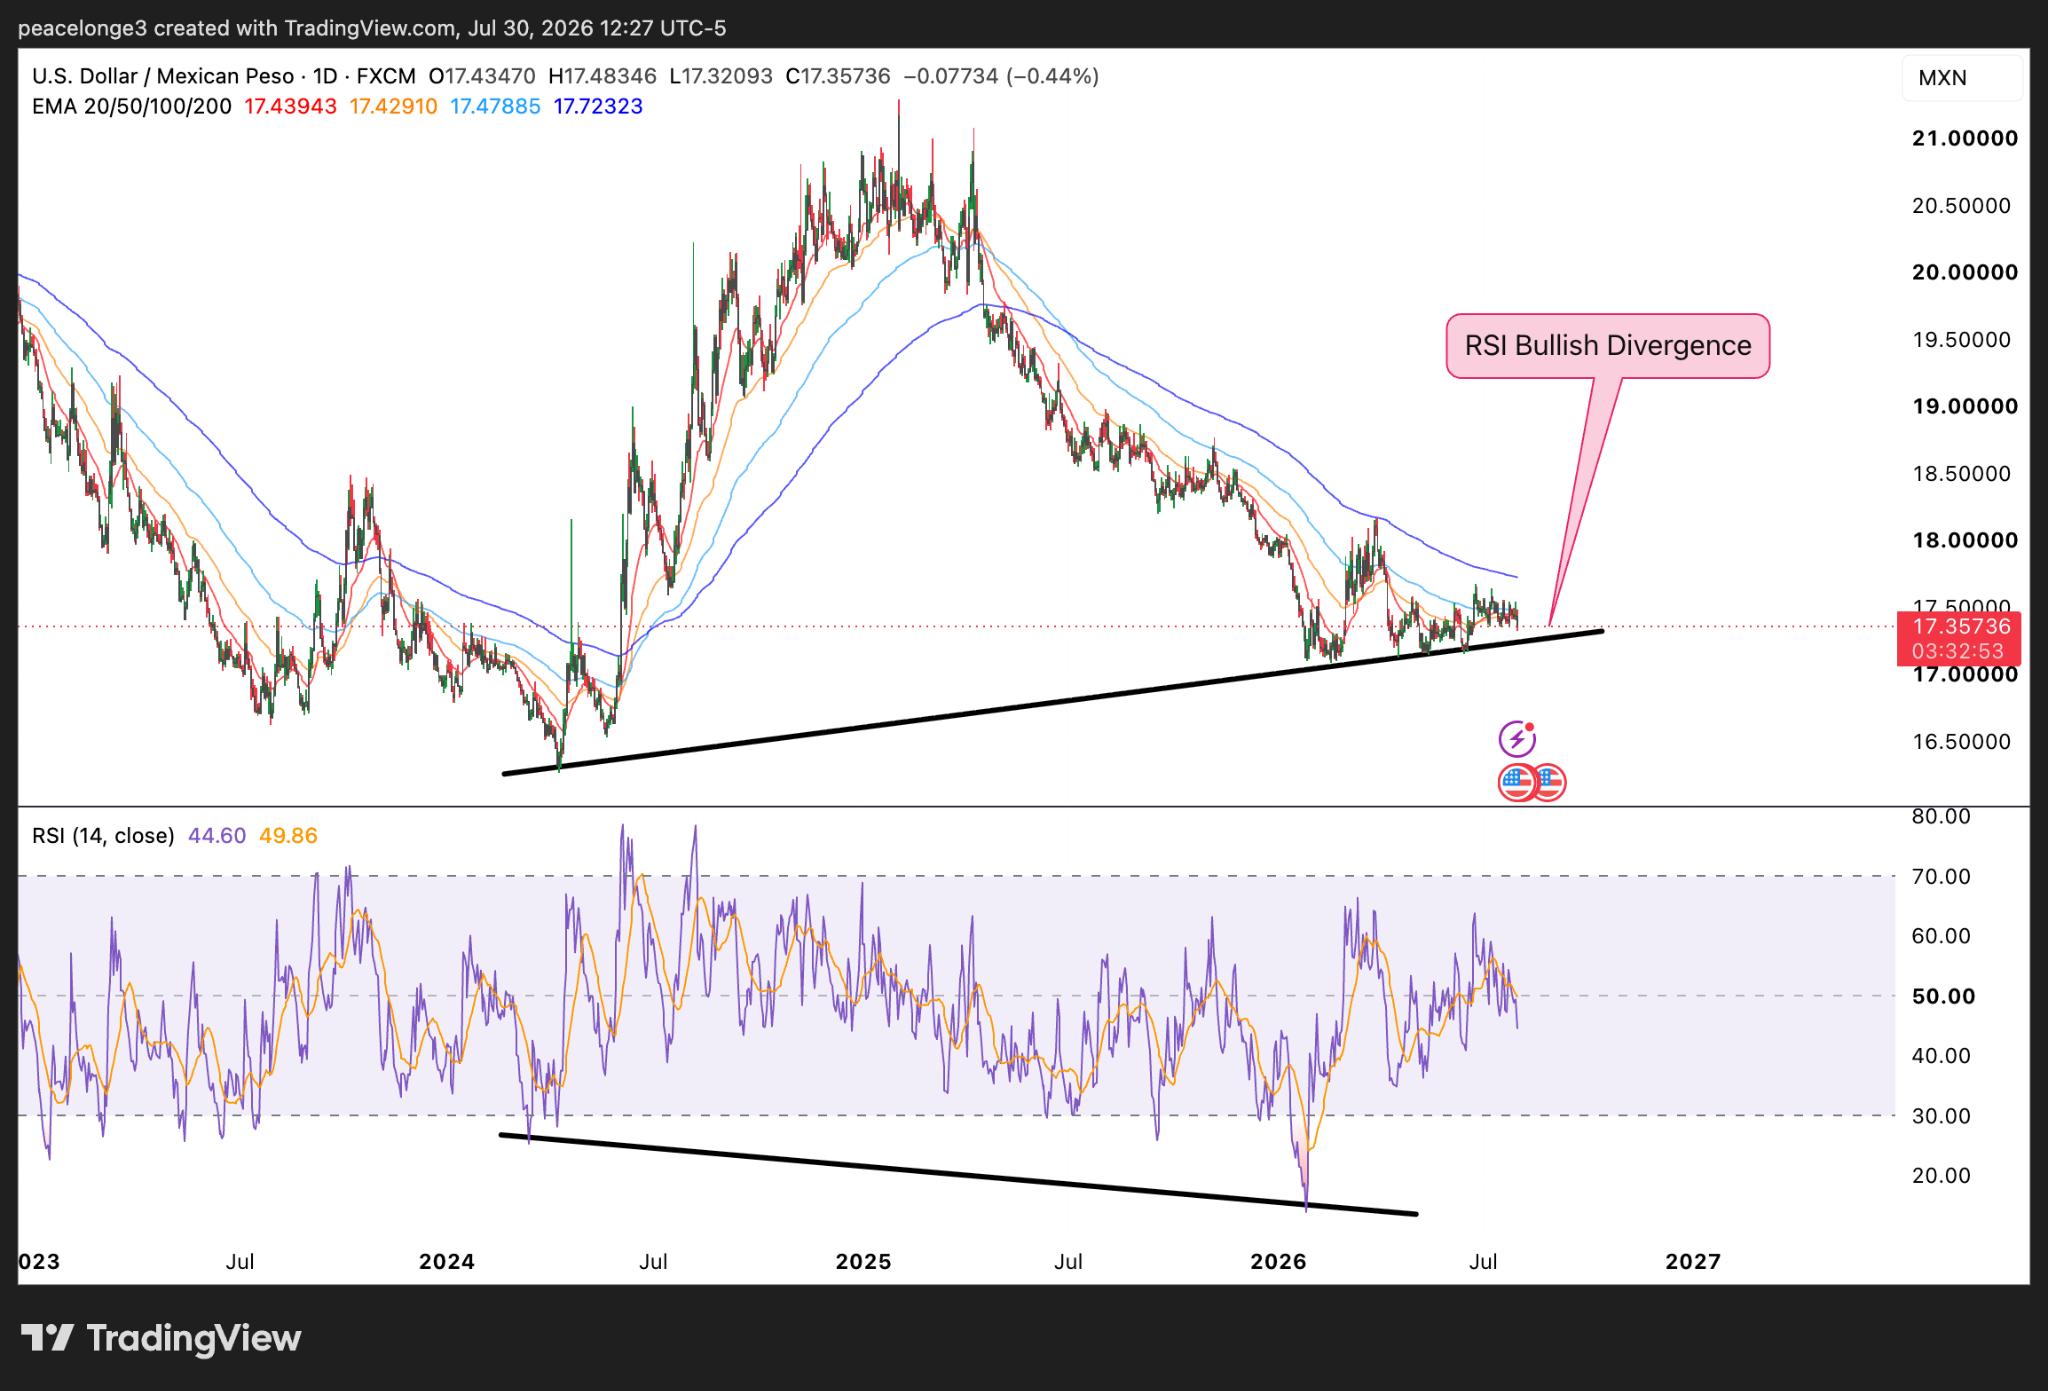
USD/MXN is trading near $17.35 at the time of writing, close to its 52-week low of 17.08. Zooming out on the pair’s daily timeframe chart reveals a trendline that has served as a key support level since 2024, and the current 17.35 price level is just above that trendline. It is also worth noting that the four EMA lines, especially the 20, 50, and 100, are very compressed and lie close to one another; a sign that a volatility breakout may be near.
USD/MXN has been on a downward trend since January 2025, and a major reason for this is the carry trade that market players have been exploiting. Banco de México’s interest rate is 6.50%, while the Federal Reserve’s sits between 3.50% and 3.75%, creating an interest rate gap of 2.75% – 3.00% between the peso and the U.S. dollar. This attractive carry has led to many traders shorting USD/MXN to buy peso, holding it in short-term Mexican government bonds, like Cetes, to reap the higher interest rate yields.
However, the USD/MXN chart is flashing a warning signal to peso bulls, as a hidden bullish divergence pattern can be seen on the daily timeframe, alongside a slightly below-average RSI of 44.60, which indicates that bearish momentum is slowing down on the pair.
The Fed reported at 2:00 p.m. ET on July 29, and although July’s interest rate was already priced in before the meeting, traders were keeping an eye out for forward guidance into September. Unfortunately, there was no guidance and the Fed maintained a steady hold on interest rates, although there were three dissenters in the meeting who called for an immediate hike in interest rates. This call, made by three out of twelve FOMC voting members, gave some hope for a more hawkish Fed going into September 2026.
A higher Federal Reserve interest rate could strengthen the U.S. dollar, closing some of the interest rate gap between the peso and the USD, which could help turn price action in favor of the USD/MXN bulls, stirring a reversal and sending price upwards.
For a bullish reversal to be confirmed, we would have to see a daily close above the 200 EMA line at around 17.80, which leaves room for price to continue up toward the next key resistance at 18.09. Failure to achieve this daily close will invalidate the near-term bullish thesis and strengthen the downward argument.
Although it is unlikely, if the Fed surprises the market and lowers interest rates before the September 15 – 16 meeting, the carry gap remains enticing for peso bulls, which will trigger more shorting of the USD/MXN pair. This scenario can see price testing the 2024 support trendline around 17.21, and a break + daily candle close below that level opens the floor for more downside.
That being said, the major practical risk for USD/MXN bulls heading into August 6 is that Banxico decides to hike interest rates.

USD/MXN Technical Outlook: Does the Triangle Break Up or Down?
Zooming much closer on the daily timeframe reveals a symmetrical triangle pattern that has mostly been filled and has little room left for price to run before a breakout. The triangle’s upper trendline touches on a March 2026 high around 18.13 and a lower price around 17.63. The lower trendline runs upward from a February low of about 17.09.
The RSI reads 44.60, which is a sign of equilibrium and low momentum, and matches the 26-day consolidation of USD/MXN.
The tightening EMA bands, along with the near-neutral RSI and almost-filled symmetrical triangle, are clear signs that a breakout is close. The question now is what direction will price go?
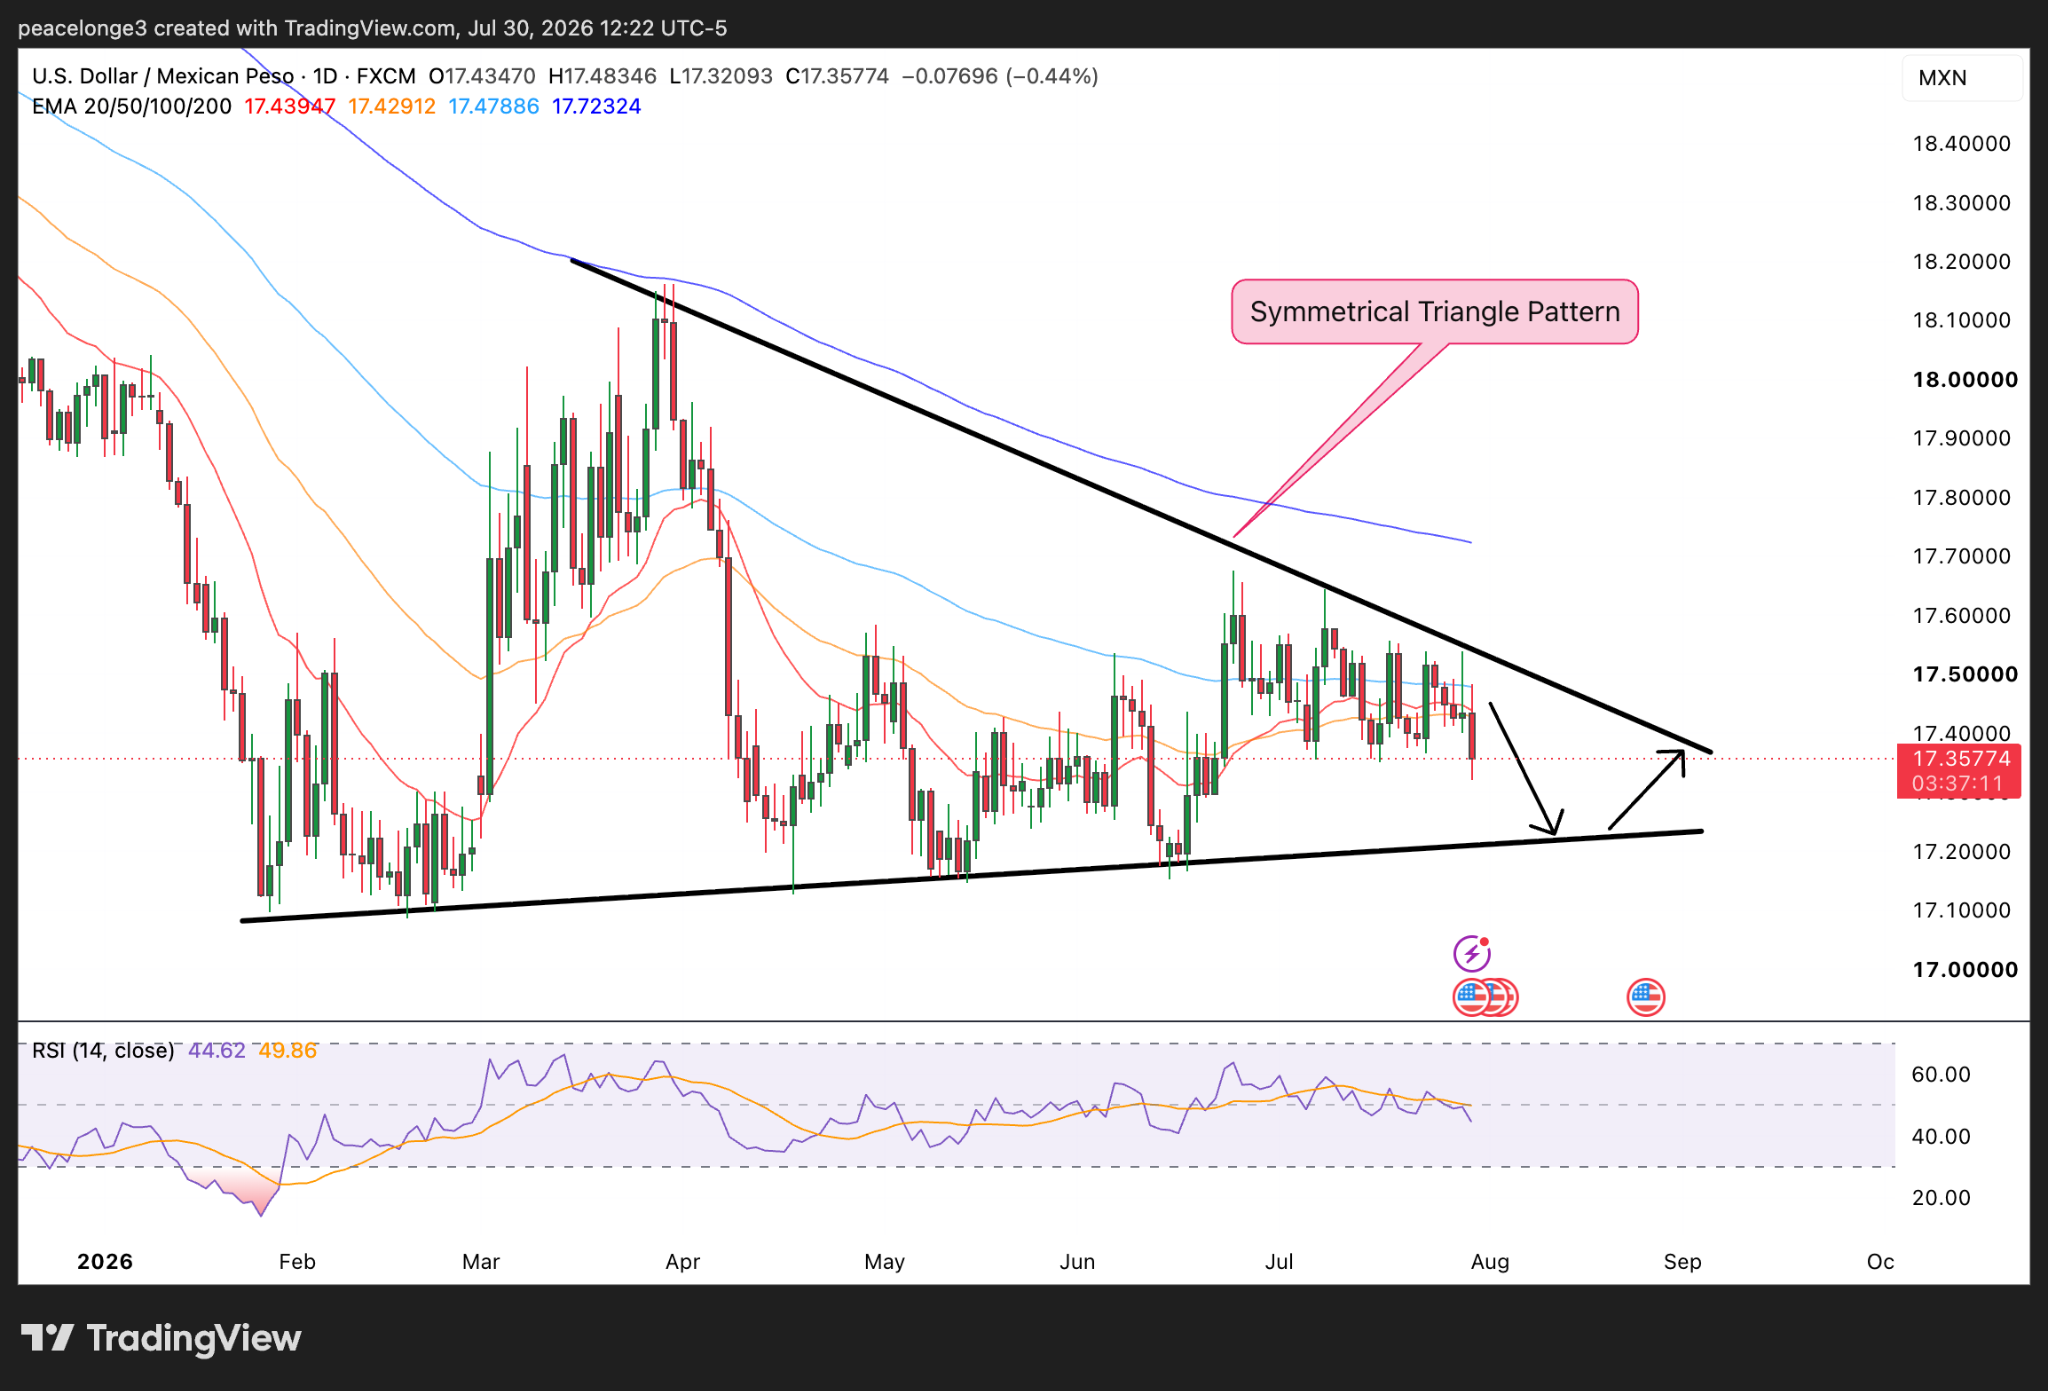
A key event to watch out for is Banxico’s interest rate decision that will be announced on August 6, 2026. If Banxico maintains a hawkish stance, which it seems to be committed to, the carry trade remains protected, and investors keep leaving the dollar for the peso. This outcome, combined with a softer Fed rate posture, can send USD/MXN towards the lower support trendline of the symmetrical triangle at 17.21.
A dovish Banxico report, though unlikely, can flip the trade in favor of U.S. dollar bulls and send USD/MXN toward higher price levels. A break and close above the triangle’s upper trendline is the confirmation of the bullish thesis.
In summary, the main risk for peso’s carry traders is a hawkish Fed surprise before September and a dovish Banxico report on August 6. If both outcomes are confirmed, USD/MXN price can flip bullish.