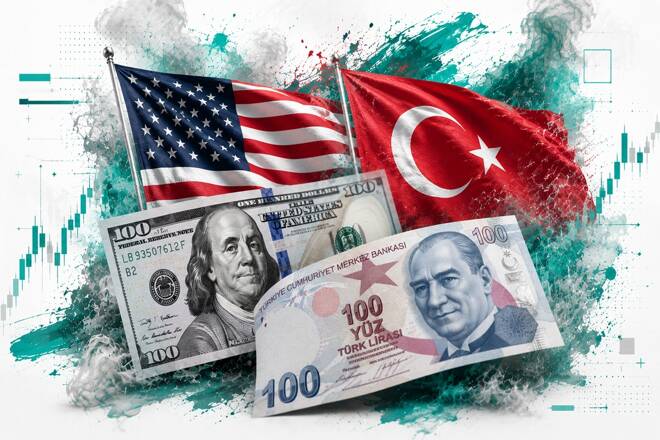
The steady climb has largely been as a result of Türkiye Cumhuriyet Merkez Bankası’s (TCMB) firm repo rate policy. The bank has kept its one-week interest rate, which is how much commercial banks are charged for borrowing money for a week, at 37% for the last four policy meetings in March, April, June, and July 2026.
TCMB has signalled that it has no intention of lowering the repo rate until inflation softens.
In addition to this, rising energy costs are also fuelling the decline of the lira. US-Iran hostilities have pushed the price of Brent crude to approximately $84.5 at the time of writing, making inflation within Turkey higher, as the country relies heavily on foreign crude imports.
According to a report by Turkish Minute, annual inflation was 32.11% in June, which is significantly higher than the central bank’s projected levels.
The combined effect of crude-fed inflation and TCMB’s dogged stance on the repo rate is dampening hopes of a reversal in the near-term.

USD/TRY Technical Outlook: Is the $48 Level Within Reach?
Taking a technical look at the USD/TRY daily chart reveals EMA lines (20, 50, 100, 200) that are significantly far apart, which is an indication of a decisive market move in a specific direction; upwards in the case of USD/TRY.
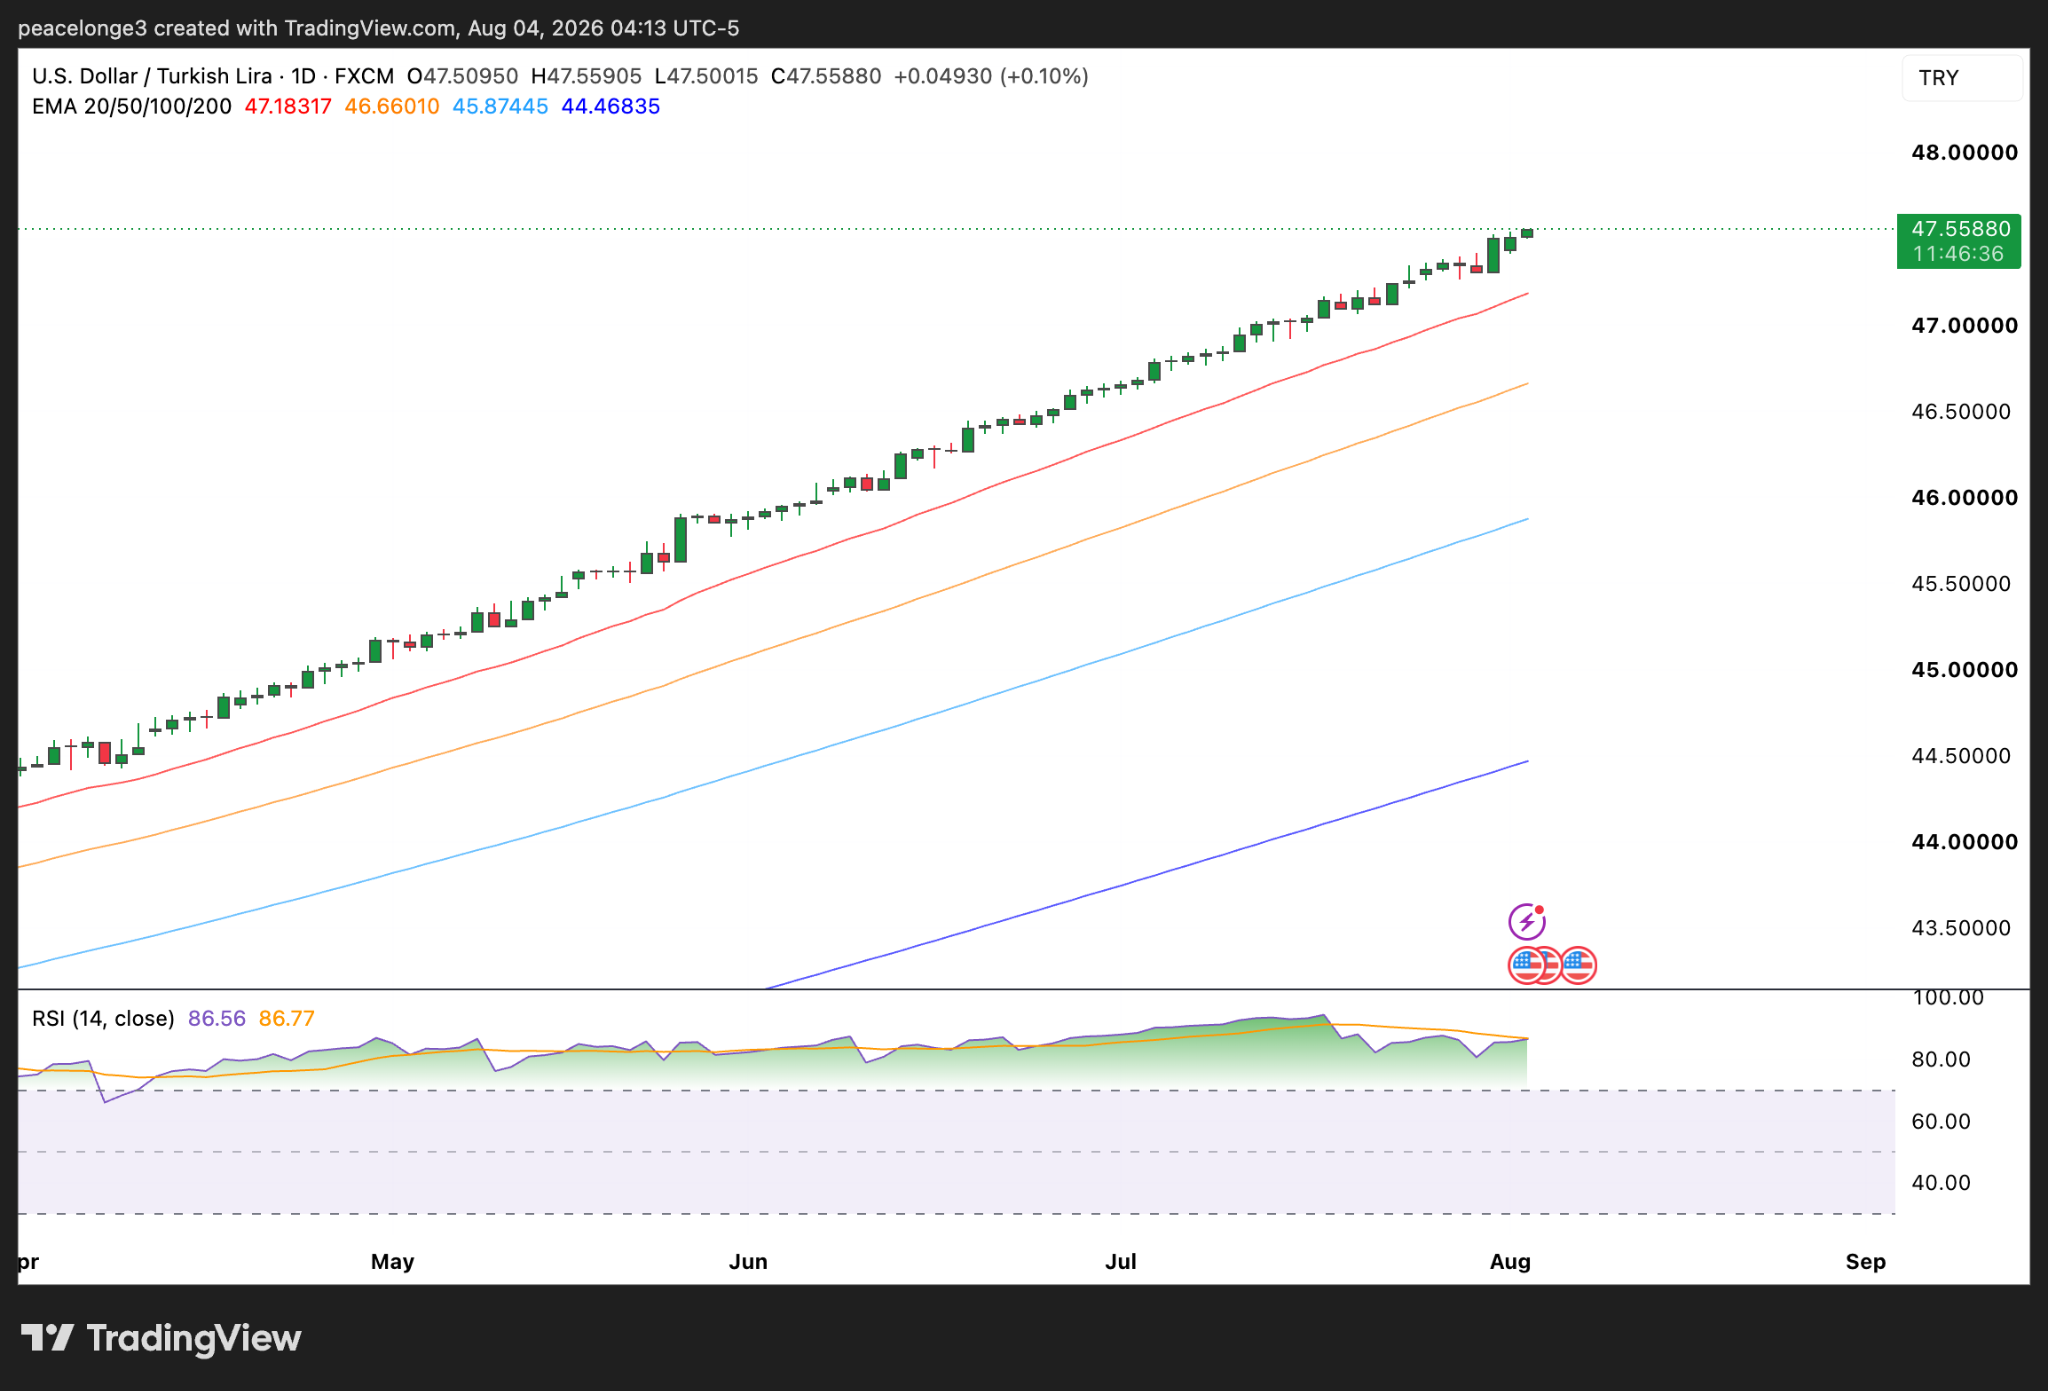
Türkiye Cumhuriyet Merkez Bankası’s next policy meeting is scheduled to hold on September 10, 2026, and the outcome of the meeting is a major catalyst to watch. However, before that date, the $48 psychological level is a noteworthy price magnet that can be reached if the current bullish USD/TRY catalysts are sustained.
In the reverse case, a bearish move will send price towards the immediate 20 EMA line, which serves as support around 47.20. If price closes on the daily below that level, the next EMA line at 46.66 could be tested. Easing U.S-Iran tensions and cheaper crude can also contribute to a near-term pullback for USD/TRY.
The daily RSI reads 86.56, which is well into the overbought territory. A drop back down below 70 could be a confirmation that momentum is reversing in the bearish direction.
The most immediate risk to USD/TRY’s bullish trend is a sustained U.S-Iran ceasefire, with news reports about ongoing talks between both countries, and President Trump calling it Iran’s last chance to secure a deal. If a deal is eventually reached and tensions ease, the crude premium that has kept Turkey’s inflation high will soften, and the lira could strengthen against the dollar.
USD/TRY Long-Term Outlook: Does the Bigger Picture Still Favor the Dollar?
Zooming out on the USD/TRY monthly chart to see the bigger picture reveals a relentless upward climb that has been going on for years. The monthly EMA bands are also widely spread apart, with price sitting well above all four lines.
The August monthly candle has also flipped bullish and broken past the upper wick of last month’s candle, cementing the near-term bullish thesis. And as long as TCMB’s interest rates remain high and inflation doesn’t come down, the pair could keep climbing into the high-40s over the coming months, favoring the dollar over the lira.
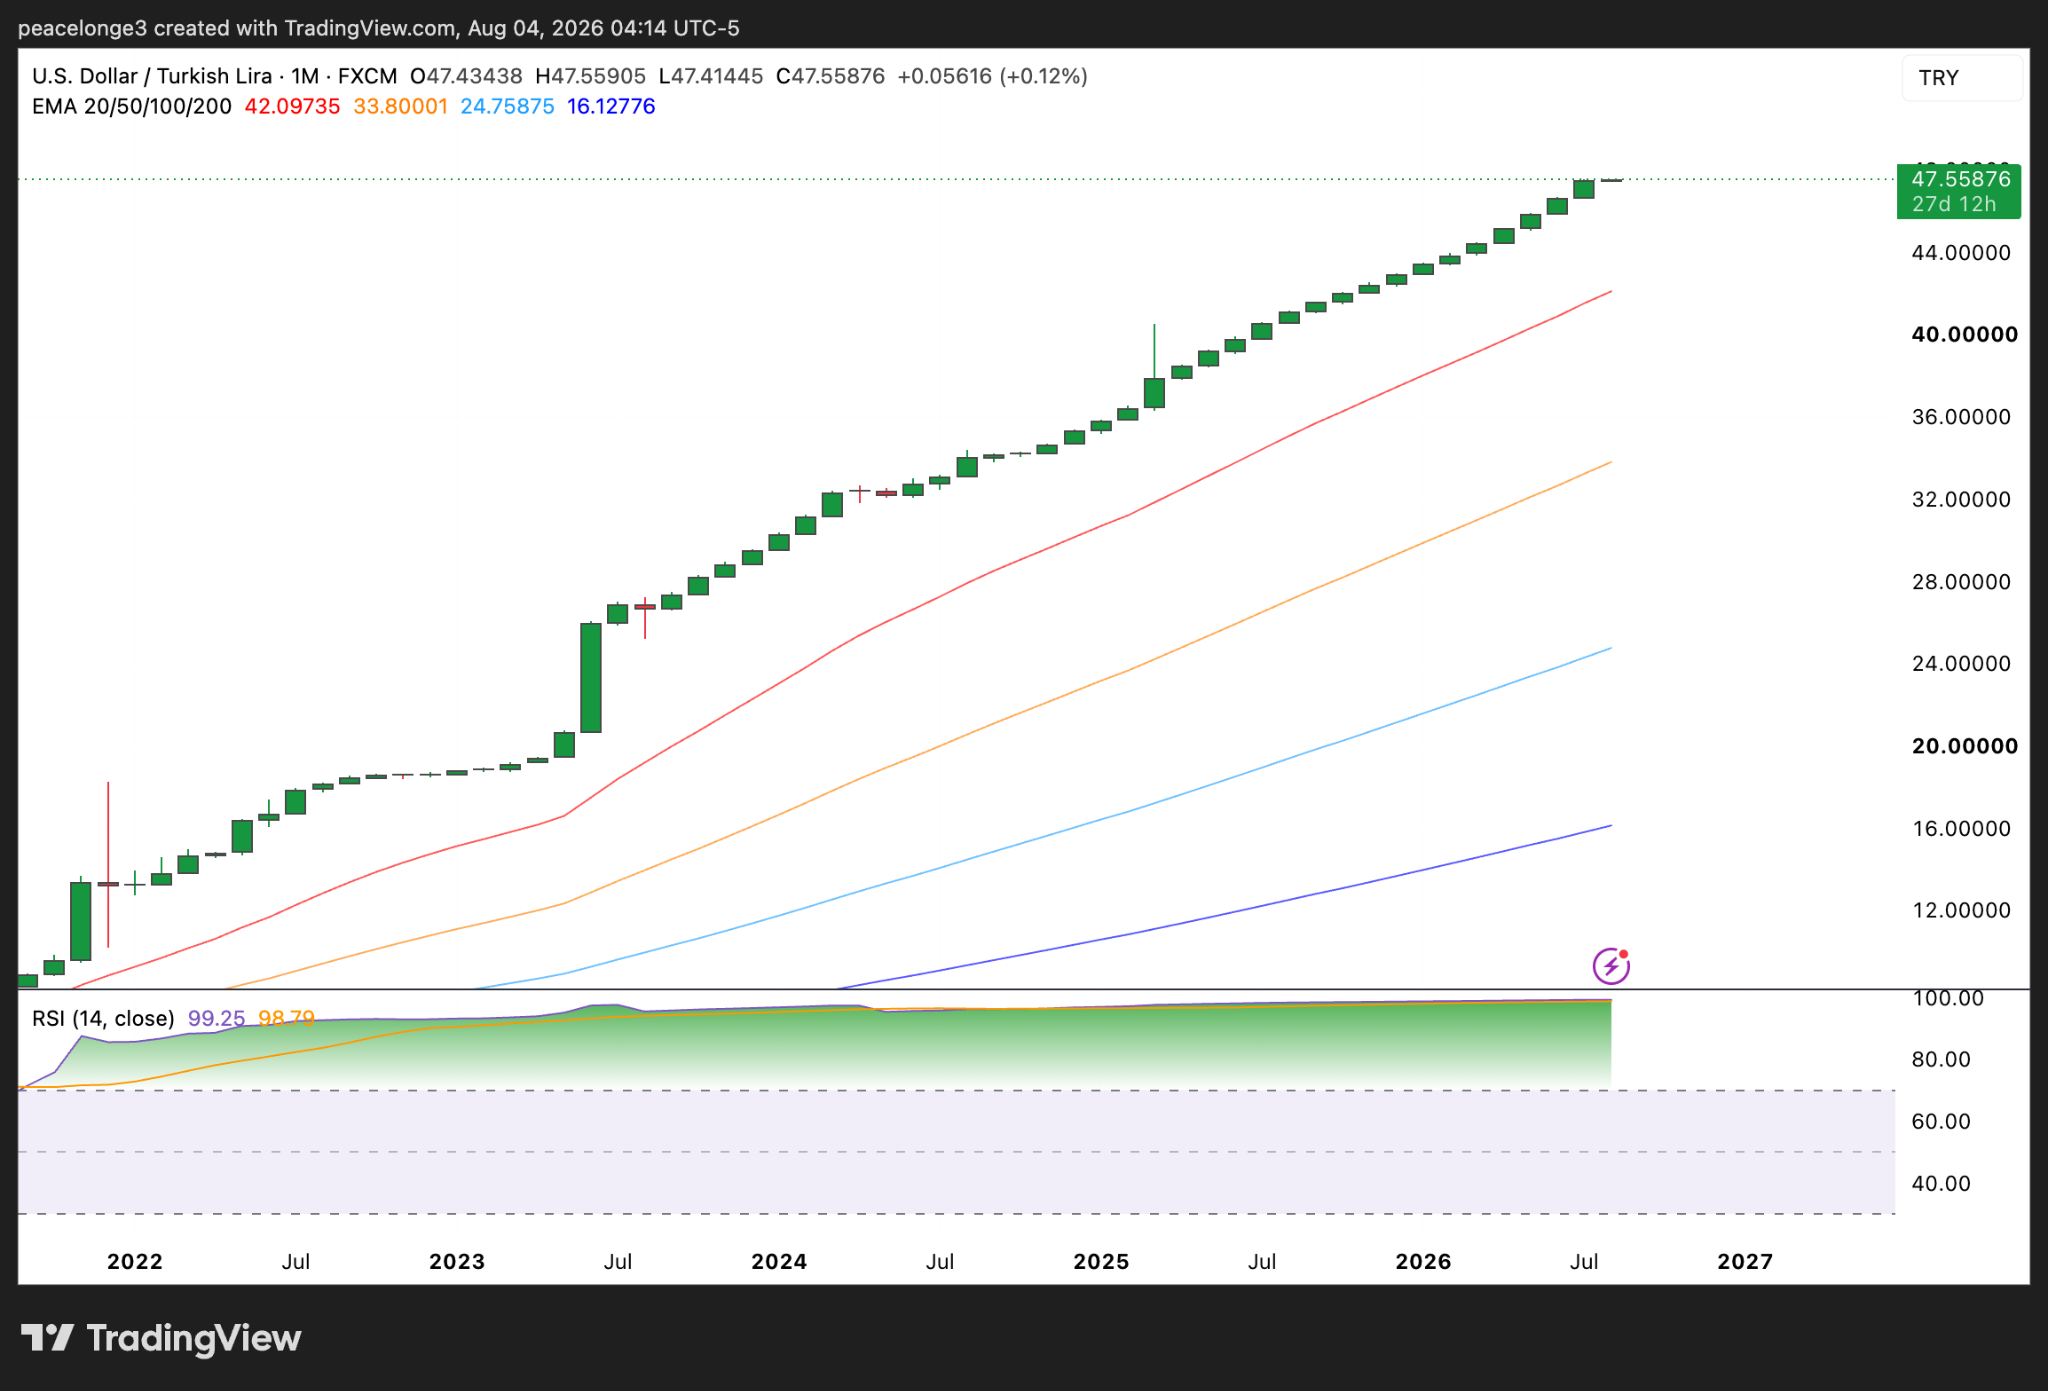
The monthly RSI is at extreme levels near 99.25 at the time of writing, but it is also worth noting that it has been at these levels for years without meaningfully reversing to the downside, indicating a structural, hyper-inflationary devaluation of the currency as opposed to a temporary “overbought” setup.
It indicates that the underlying drivers of the lira’s devaluation, such as high inflation and interest rates, are continuous and structural, not cyclical.
Hence, unless inflation and oil prices fall into the September TCMB decision, USD/TRY will most likely continue climbing upwards to $48 and beyond.