The USD/CAD pair initially tried to rally during the week, but turned around just below the 1.28 handle. As we had formed a shooting star the previous
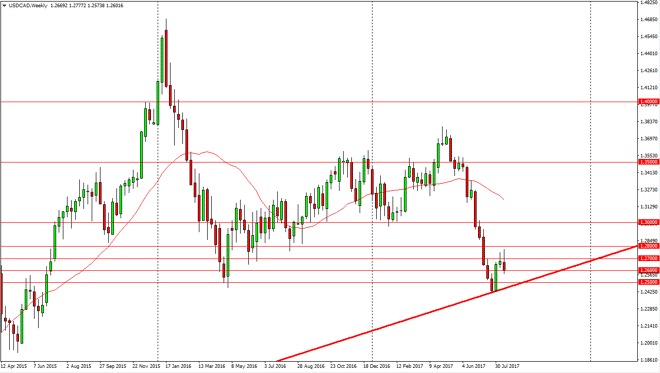
The USD/CAD pair initially tried to rally during the week, but turned around just below the 1.28 handle. As we had formed a shooting star the previous week, and now look to be forming a shooting star for this past week, it looks very likely that were going to try to roll over. The uptrend line below should offer support, but I think that the markets can go looking for the 1.25 handle in the end term. If we were to break down below the uptrend line, somewhere near the 1.2450 level, I think that could be very negative for the overall uptrend that we have seen. Ultimately, this is a market that could be driven by oil as well, so of oil explodes to the upside suddenly, that will only add yet another reason for this market to start falling.
Alternately, if we were to break above the 1.28 handle, that would be a very bullish sign and probably have this market looking for the 1.30 level. Friday was very bearish, so we’ll have to see however thing shakes out, but I think we are starting to see the sellers jump back into this market and flexor muscles as the bounce, although strong from the trend line, is being threatened.
Chris is a proprietary trader with more than 20 years of experience across various markets, including currencies, indices and commodities. As a senior analyst at FXEmpire since the website’s early days, he offers readers advanced market perspectives to navigate today’s financial landscape with confidence.