After a huge rally in March, the price of WAVES has fallen significantly from its highs along with the wider markets. More recent price action has pushed WAVES up more than 45% from the lows.
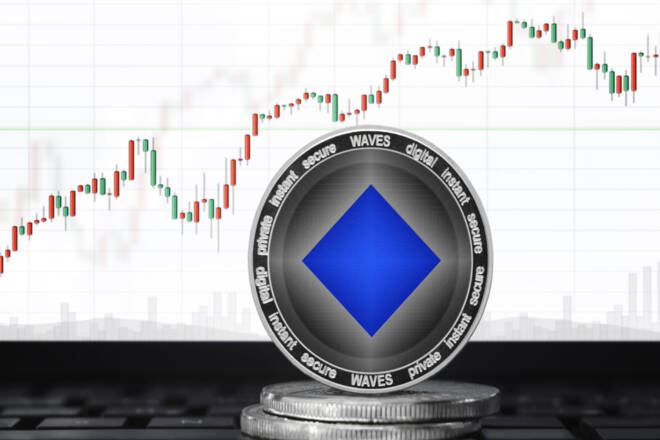
Despite a market-wide downturn, WAVES has rallied 14% today and ranks 66th in the list of cryptocurrencies worldwide by market capitalisation at $671 million.
The token climbed from a low of $4.4601 on July 13 to $6.4992 today – a 45% spike over the week.
The WAVES cryptocurrency plays a key role in maintaining the Waves network and is used to create custom tokens, as well as to pay for transaction fees. The Waves blockchain itself is designed to enable users to create and launch custom crypto tokens without the need for extensive smart contract programming.
WAVES started trading in June 2016 at around the $1 price point. The token then went onto hit a new all-time high in December 2017 before falling in line with the wider crypto markets. The price declined from $15.21 at the high to around $3 in April 2018.
2019 was lacklustre for the WAVES cryptocurrency as it stagnated within the $1-$2 range throughout the year. The token started gaining traction in the latter half of 2020 and then marked a new all-time high in May 2021 when it reached a price of $34.01.
After an extended dip in the following months, the coin rallied back to the $32 mark in October 2021, before plummeting to $9.0144 by February 1, 2022.
The first half of this year saw strong price action pushing WAVES to new all-time highs again, this time going past the $60 level after the world’s largest cryptocurrency exchange, Binance announced that it will accept WAVES as collateral on its loans platform.
This spike, however, was followed by a strong correction and WAVES dropped to $5.3913 on May 27 – a 90% drop in 57 days.
On July 19, the token’s price formed a symmetrical triangle pattern and was trading below the vital 50 and 100-day exponential moving averages (EMA). WAVES has since recovered and is trading at $6.24, but the token is still down 90% from its all-time high price.
Technical analysis shows that short-term sentiment on WAVES is neutral, with 14 indicators displaying bullish signals compared to 14 bearish signals at the time of writing.
The daily simple and exponential moving averages are giving mostly buy signals, while the relative strength index (RSI) stands at 58.9.
An RSI reading of 30 or below indicates an oversold or undervalued condition, while a reading above 70 would suggest the asset is becoming overvalued or overbought.
This means that WAVES has some way to go before it approaches the overbought territory.
Mohadesa Najumi is a British writer who has worked within crypto, forex, financial technology, and the stock market industry. Mohadesa received her MSc in Political Science and International Relations at the University of Amsterdam.