


Aave (AAVE) could fall another 45% toward $50 if its latest rebound fails to reclaim a resistance level that has capped the token for nearly a year. But that may follow a historical buying opportunity for traders with a long-term outlook.
AAVE Struggles Below Its 20-Week EMA
AAVE was trading near $89 on Aug. 13, remaining below its 20-week exponential moving average (20-week EMA, green) near $96.70.
The 20-week EMA has acted as resistance since October 2025, and repeated recovery attempts have failed to establish the level as support.
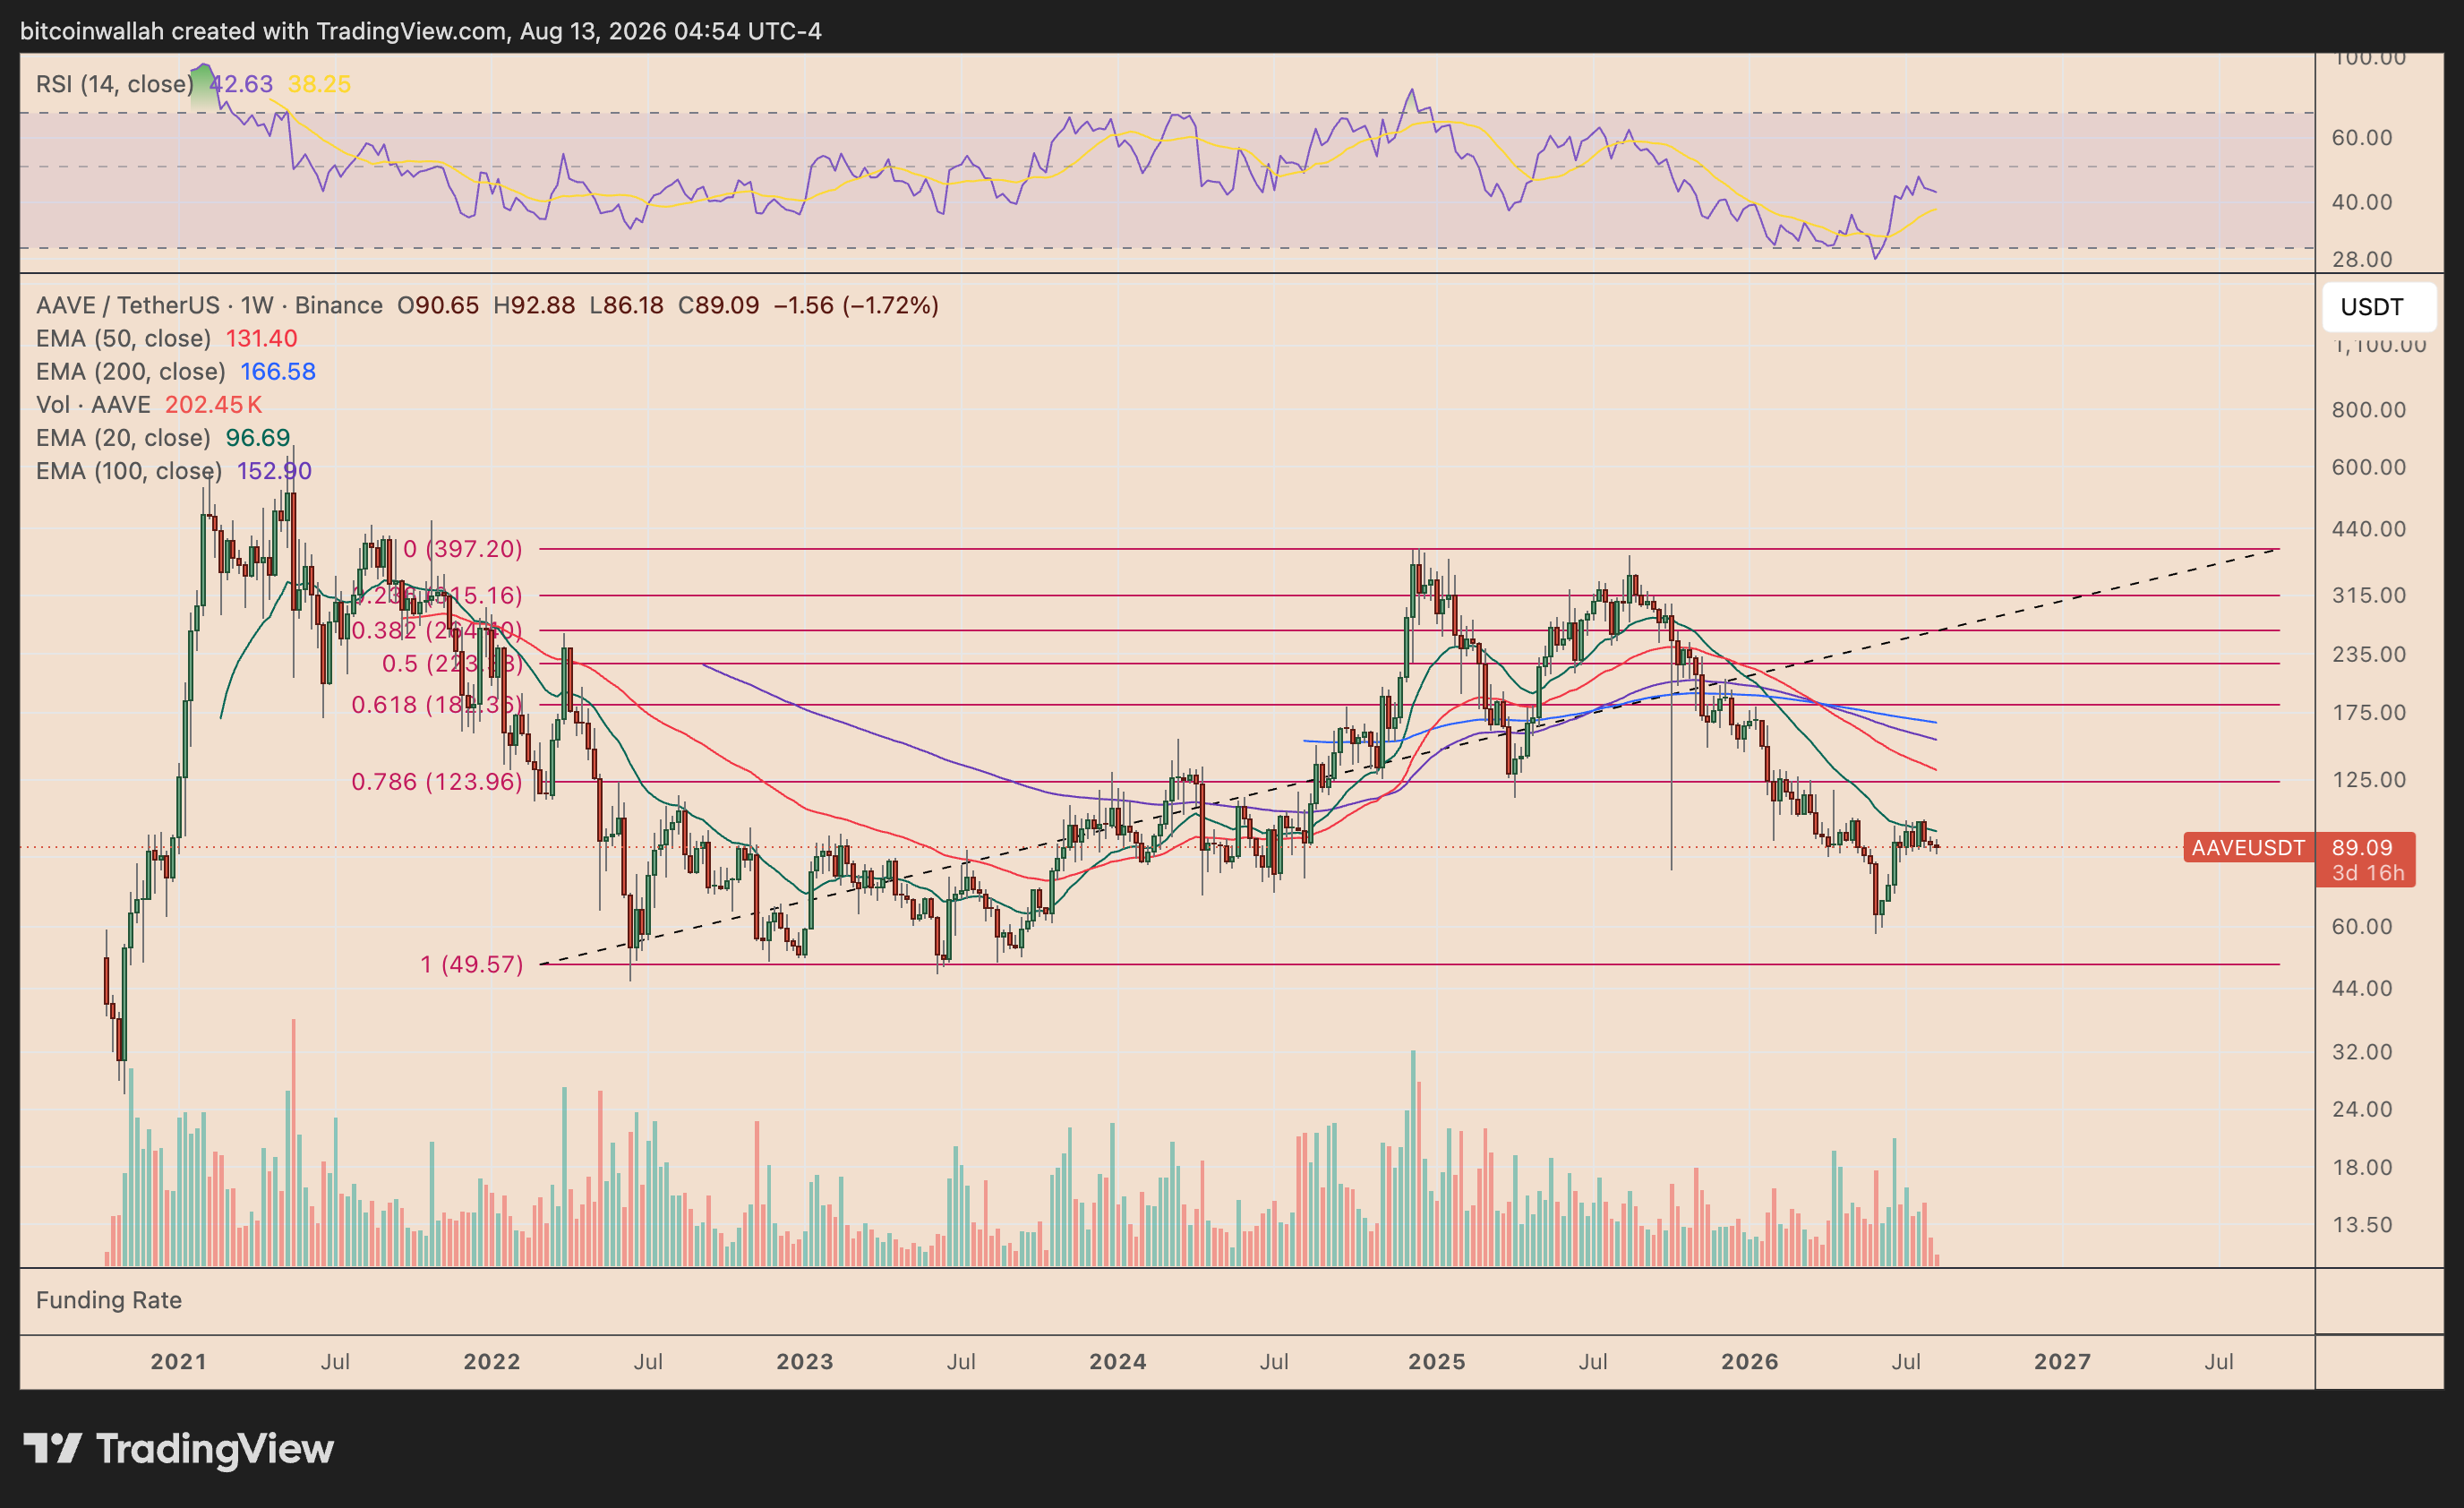
AAVE briefly approached the EMA again during its latest rebound from around $60, but the subsequent pullback suggests bulls are still struggling to regain control.
That keeps the broader downside structure intact.
A consistent rejection below the 20-week EMA could send AAVE toward its next major long-term support near $49.50–$50, corresponding with the 1.0 Fibonacci retracement level.
From the current price, that would amount to a decline of roughly 44%–45%.
The $50 region also represents AAVE’s multi-year bottom area. The token repeatedly found buyers around similar levels between 2022 and 2023 before eventually beginning its recovery toward $400.
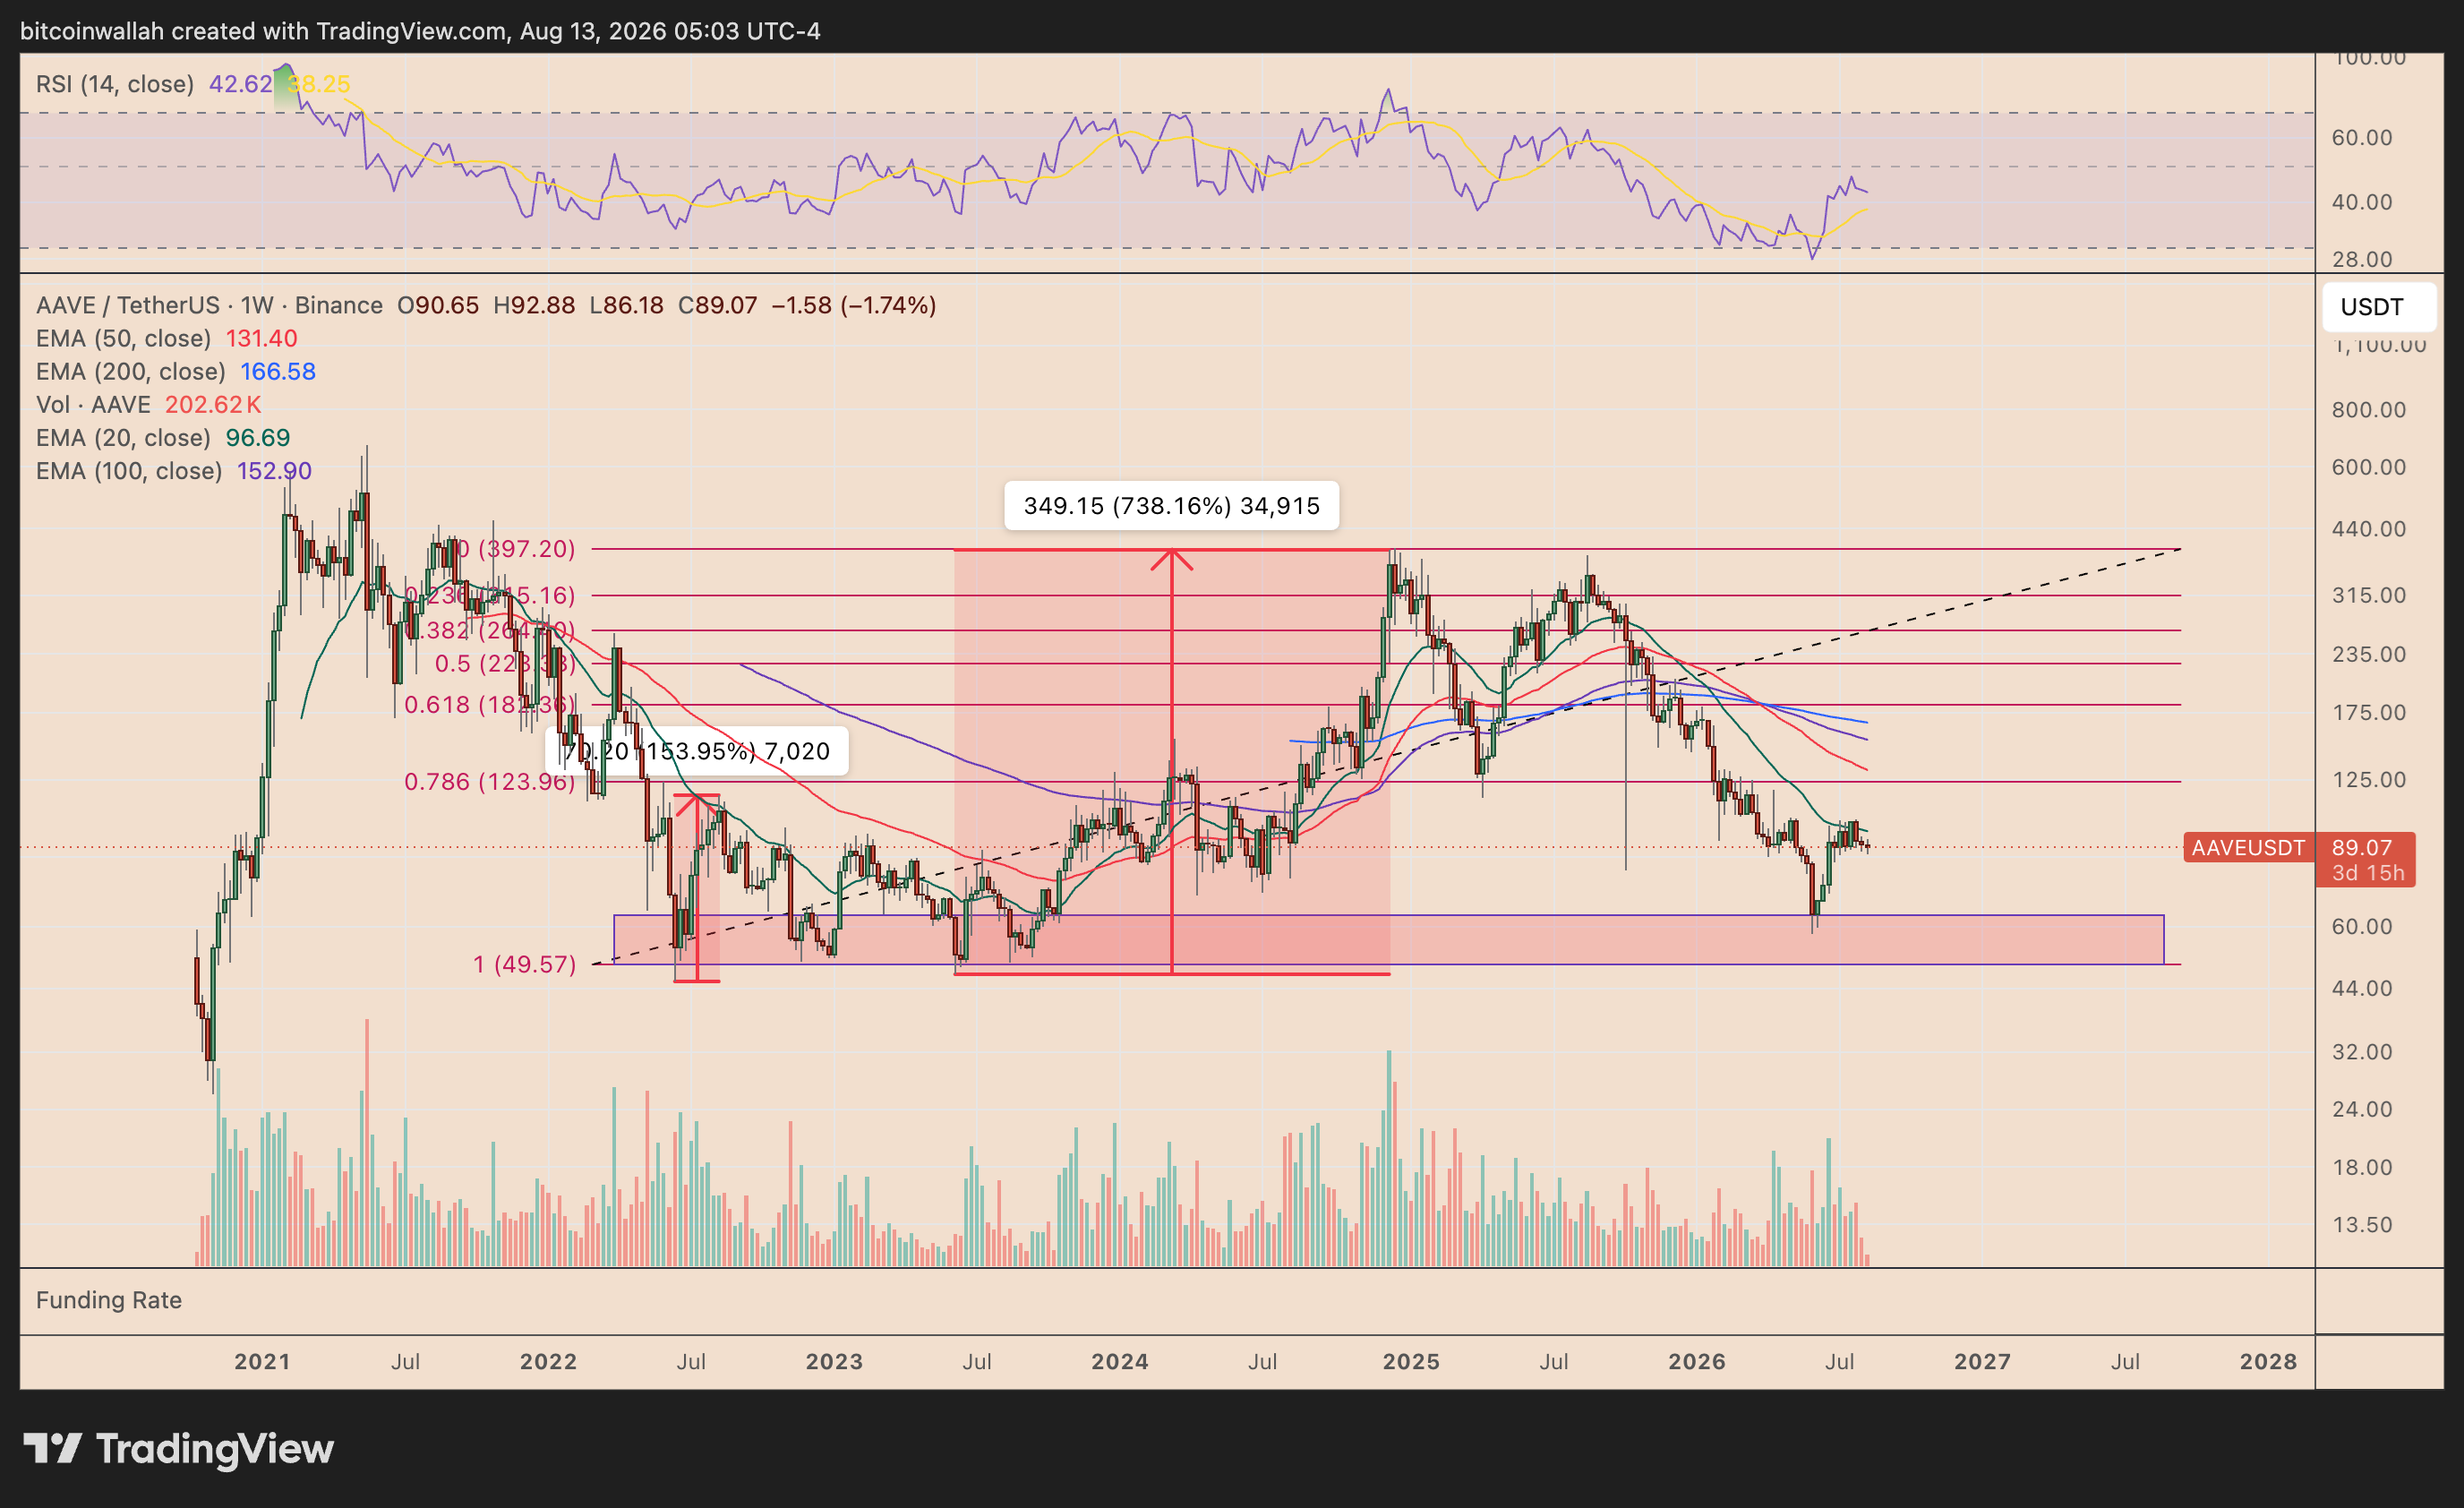
Therefore, another $50 test could develop into a long-term accumulation area if history repeats.
What If AAVE Breaks Above the 20-Week EMA?
The bearish outlook would begin losing strength if AAVE decisively reclaims its 20-week EMA and establishes it as support.
In that scenario, the token could initially rally toward the $105–$125 region, where its previous horizontal resistance sits.
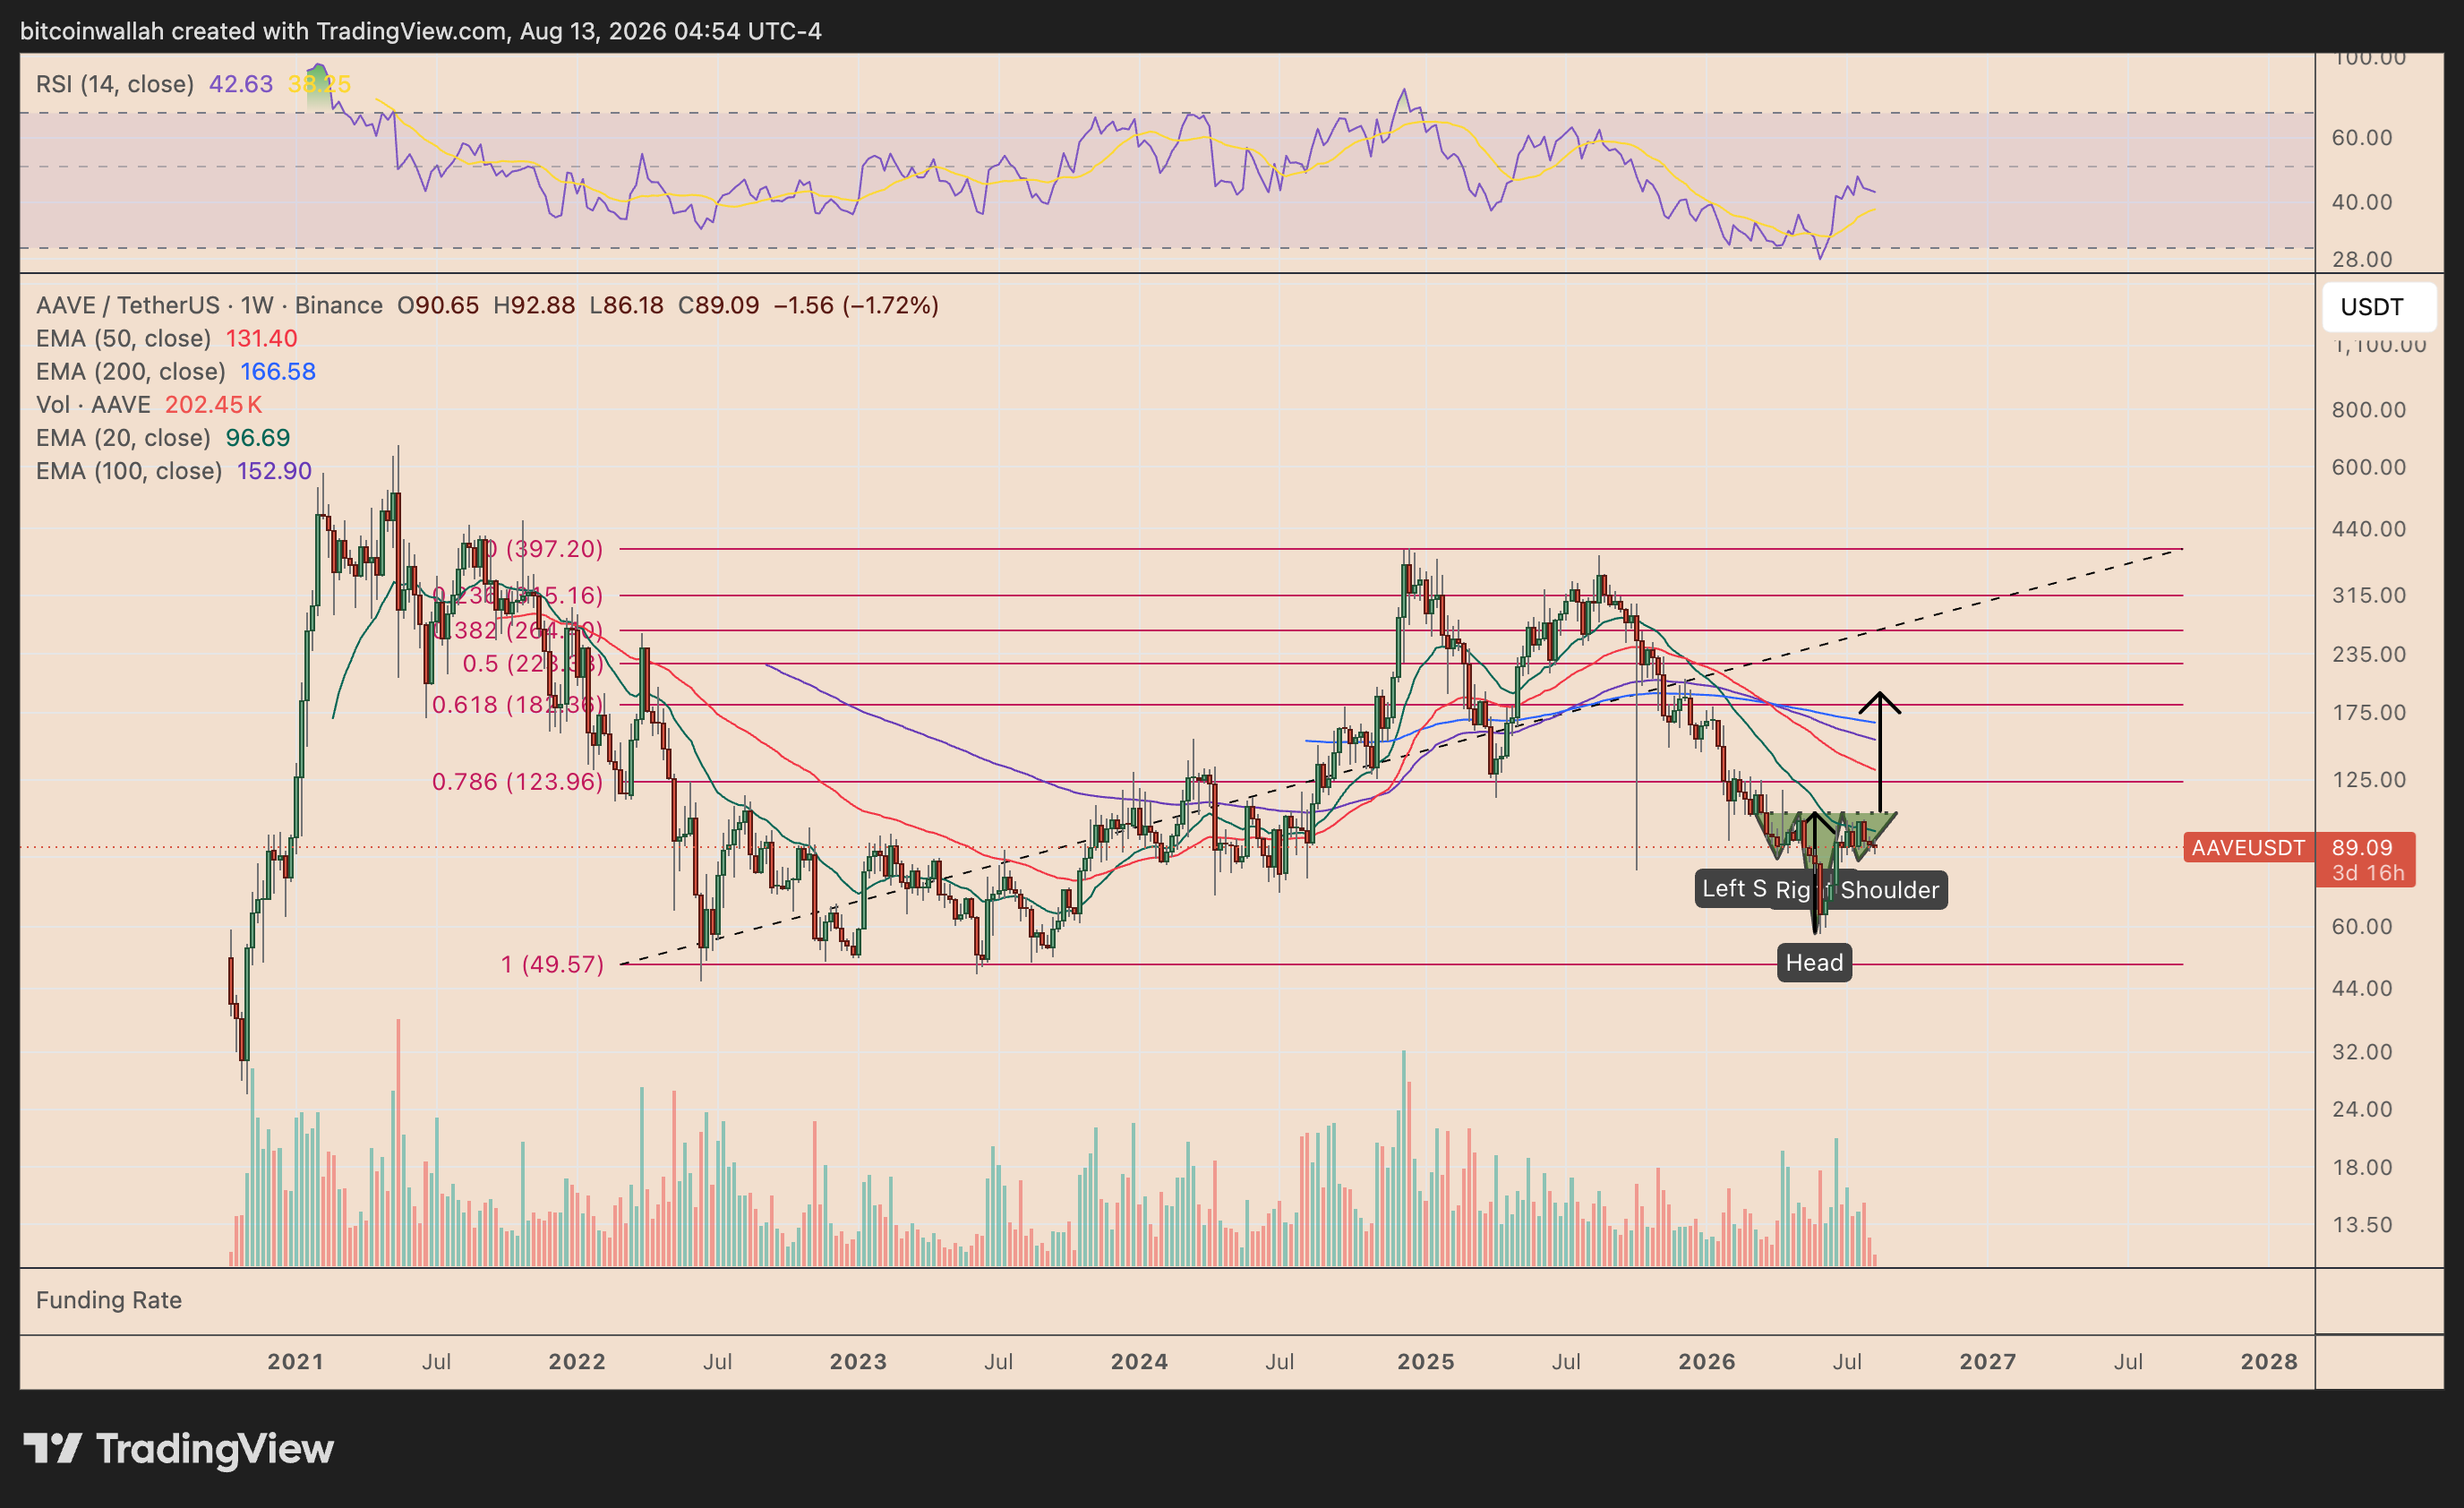
The setup consists of a left shoulder near the recent lows, a deeper head around $60, and a potential right shoulder forming around current levels.
A convincing breakout above the neckline could confirm the reversal pattern and put AAVE on course toward approximately $200.
Before reaching that target, however, bulls would have to overcome a dense cluster of long-term moving averages.
AAVE’s 50-week EMA (red) sits near $131, while the 100-week (purple) and 200-week (blue) EMAs are around $153 and $167, respectively.
Reclaiming those levels would provide stronger evidence that AAVE’s long-term downtrend is reversing.