
Gold News: Softer CPI Shifts Focus to PPI and Fed Policy
Gold and silver fundamentals strengthened after U.S. consumer inflation cooled in July, reducing expectations for another Federal Reserve rate increase in September. The Bureau of Labor Statistics reported that headline CPI grew by 0.1% in July from the previous month and down annualized to 3.4% from 3.5% the previous month. After the report was released, market implied odds of a September Fed hike fell to around one-third from being well over 50% just a week prior. Market participants are waiting for Thursday’s release of the U.S. Producer Price Index to ascertain whether general inflation pressures are easing.
Geopolitical risk is also supporting the metals. Negotiations between the U.S. and Iran have stalled, and it has been unsettling to the energy market considering the Strait of Hormuz. Another round of escalations will likely bring high energy inflation and support demand for safe haven assets. Precious metals may also compete against other forces for safe haven demand including monetary policy.
Demand from the official sector will remain because gold insect reserves are expected to increase during 2026. China’s gold reserves increased last month, and the World Gold Council predicted the increase would grow. The WGC has also predicted the official sector demand for gold will remain high. Despite the growth, they noted that outflows will still remain in the first half of 2026.
Silver has its own supply-demand story. The Silver Institute projects another global supply deficit in 2026. Lowermost industrial demand is expected to fall about 2% to 650 million ounces. Manufacturers of solar equipment are expected to continue to reduce silver loadings as they substitute with other materials. Longer term, demand for silver is expected to rise from expanding artificial intelligence, data center, auto, and power grid infrastructure.
The next few days, or until August 13, the main fundamental catalyst is PPI. A continuing subdued inflation reading is expected to show that the Fed can maintain its current stance. An upward surprise would mean a return to expectations of tighter Fed policy.

Gold Technical Analysis: XAU/USD Tests $4,448 Resistance After Strong Recovery
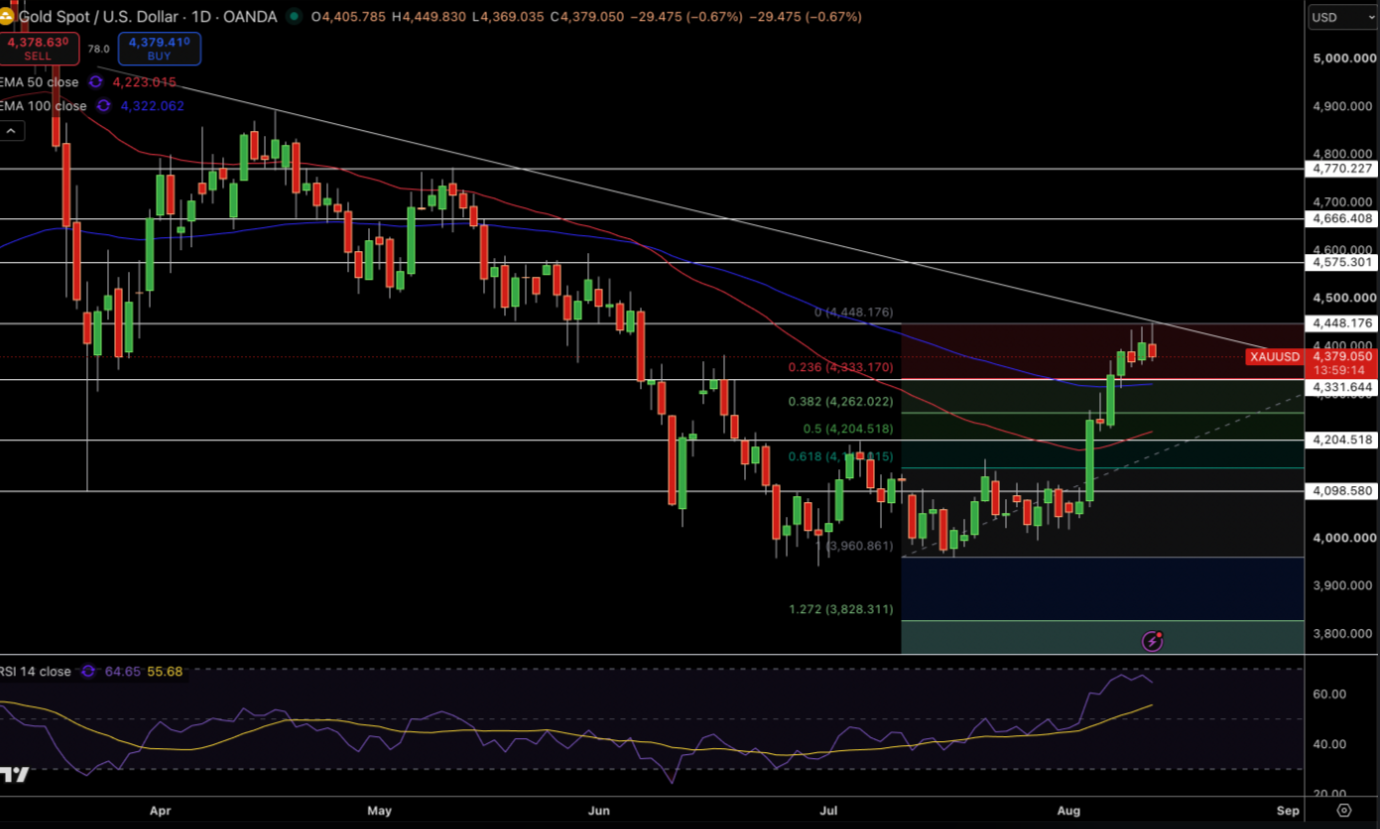
Gold is currently at $4,379 for the day chart. With a strong recovery from the July lows, price is breaking above both the 50-day EMA at $4,223 and the 100-day EMA at $4,322. An improvement of both of these EMAs shows an improvement in medium-term momentum. The current rally is also reaching the resistance at $4,448, which is also the upper boundary of the current retracement structure.
Recent candlesticks have been forming with some hesitation below this level. This is more of a profit taking consolidation range as opposed to a bearish reversal.
RSI is in the strong bull zone at 65. Immediate resistance is at $4,448 with $4,575 and $4,666 as the next areas of resistance. First meaningful support comes in at $4,332 with $4,262 and $4,205 as the next areas. In addition, price holding above $4,332 maintains the recovery structure while a break above $4,448 gives a bullish continuation towards $4,575.
Gold Price Forecast
Every new Gold analysis as it publishes, today's technical signal and key levels, live price — on one page.
See all Gold forecastsSilver Technical Analysis: XAG/USD Pullback Tests $64.47 Support Inside Rising Channel
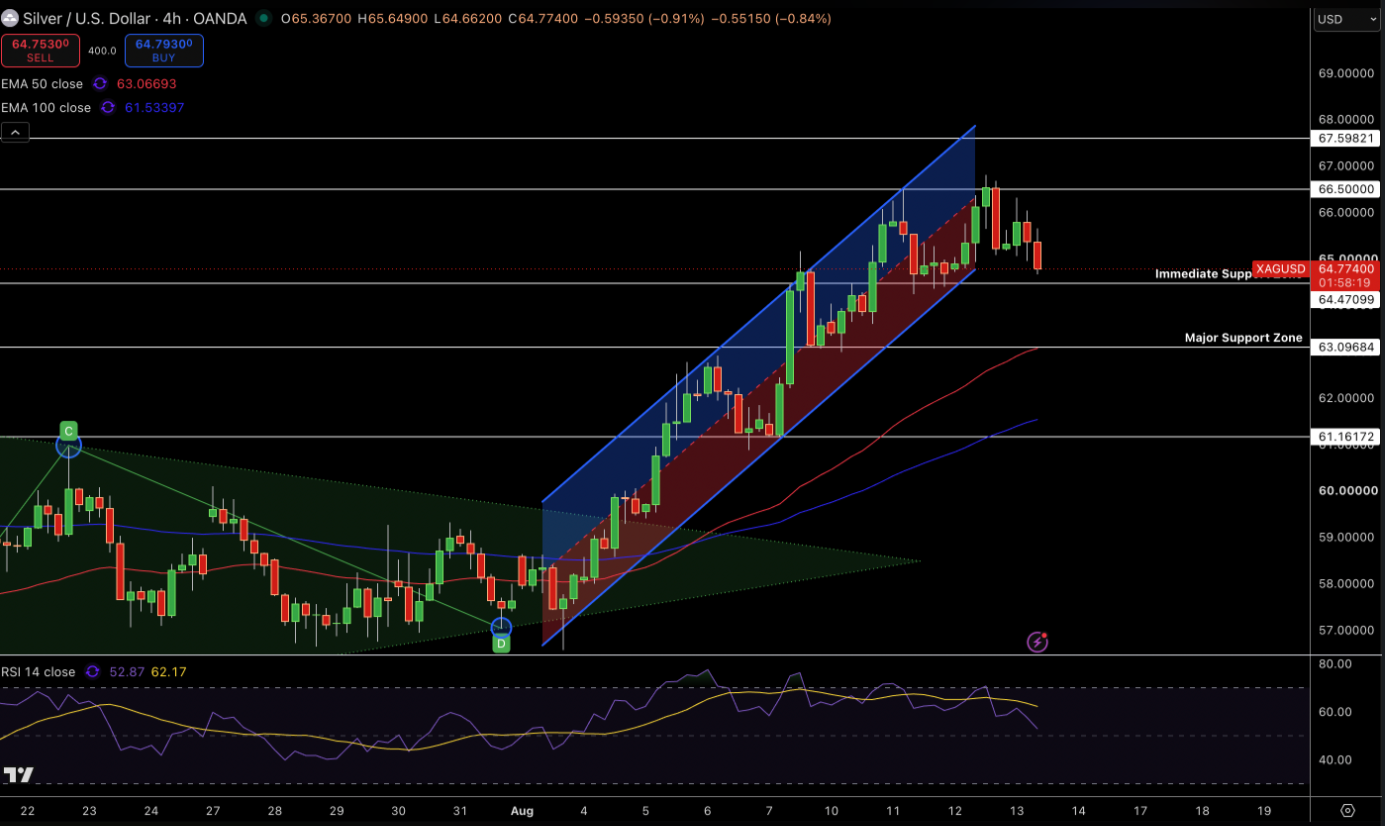
Silver is currently at $64.77 for the 4 hour chart, having pulled back from the $66.50 area. In the bigger picture, the channel is still rising and price comfortably rests above the both the 50-EMA at $63.07 and 100-EMA at $61.53, leaving the trend as constructive. The last few bearish candles have been approaching support around $64.47. This makes the level important to the channel structure.
RSI hovers around 53, appearing far from the last overbought levels and implying the beginning of the pullback that has calmed some of the overdone momentum. Soon after, $65.20 serves as resistance while $67.60 and $66.50 are found higher. Looking for support, $61.16 is found underneath $63.10, the longer support zone, and $64.47 is found closer to the resistance. I think a break of the support at $64.47 would be considered bearish, whereas a looking upwards break of the resistance at $66.50 would be considered bullish.