



US Dollar News: PPI and UK GDP Reshape FX Outlook
Today’s main driver of the US dollar is the reassessment of FED policy after the soft US consumer inflation numbers for July. The headline CPI increased by only 0.1% (month on month) and annual inflation slowed down to 3.4%, further dampening expectations for an FED rate hike in September. The focus now is on the release of the PPI (Production Price Index) scheduled for Thursday. Another soft reading will support the FED’s decision to pause. The FED will be more relaxed with higher inflation concerns if the PPI numbers show persistence in pipeline inflation.
The euro is trading in an environment reflective of mixed fundamentals. The current holding patterns from the ECB after the policy unchanged announcement in July, together with some stabilization of the eurozone activity in manufacturing, are in place. The eonjomy’s lingering stress from the Middle East energy crisis and weak household demand, are still evident. Investors will be watching to see if the softer US inflation narrows the policy gap more between the FED and ECB, which is a major currency driver.
Sterling got a new domestic catalyst from the release of the second quarter UK GDP that showed an expansion of 0.4% over the previous quarter. This was following the 0.6% expansion in the first quarter. The data provides some evidence that the expansion of the UK economy was sustained throughout the period of elevated energy costs and geopolitical tensions.
For the Bank of England, stronger growth makes policy more difficult. Inflation is starting to fall, but Energy costs means it could easily get worse again. Luckily for them, strong activity gives policymakers the ability to focus on price stability, effects of which should be seen over time.
For August 13, the immediate FX focus is U.S. PPI. Weaker PPI could strengthen the possibility of a longer pause from the Fed, while higher PPI could make a more hawkish September scenario likely.

U.S. Dollar Index Technical Analysis: DXY Attempts Recovery Above $99.42 Trendline Support
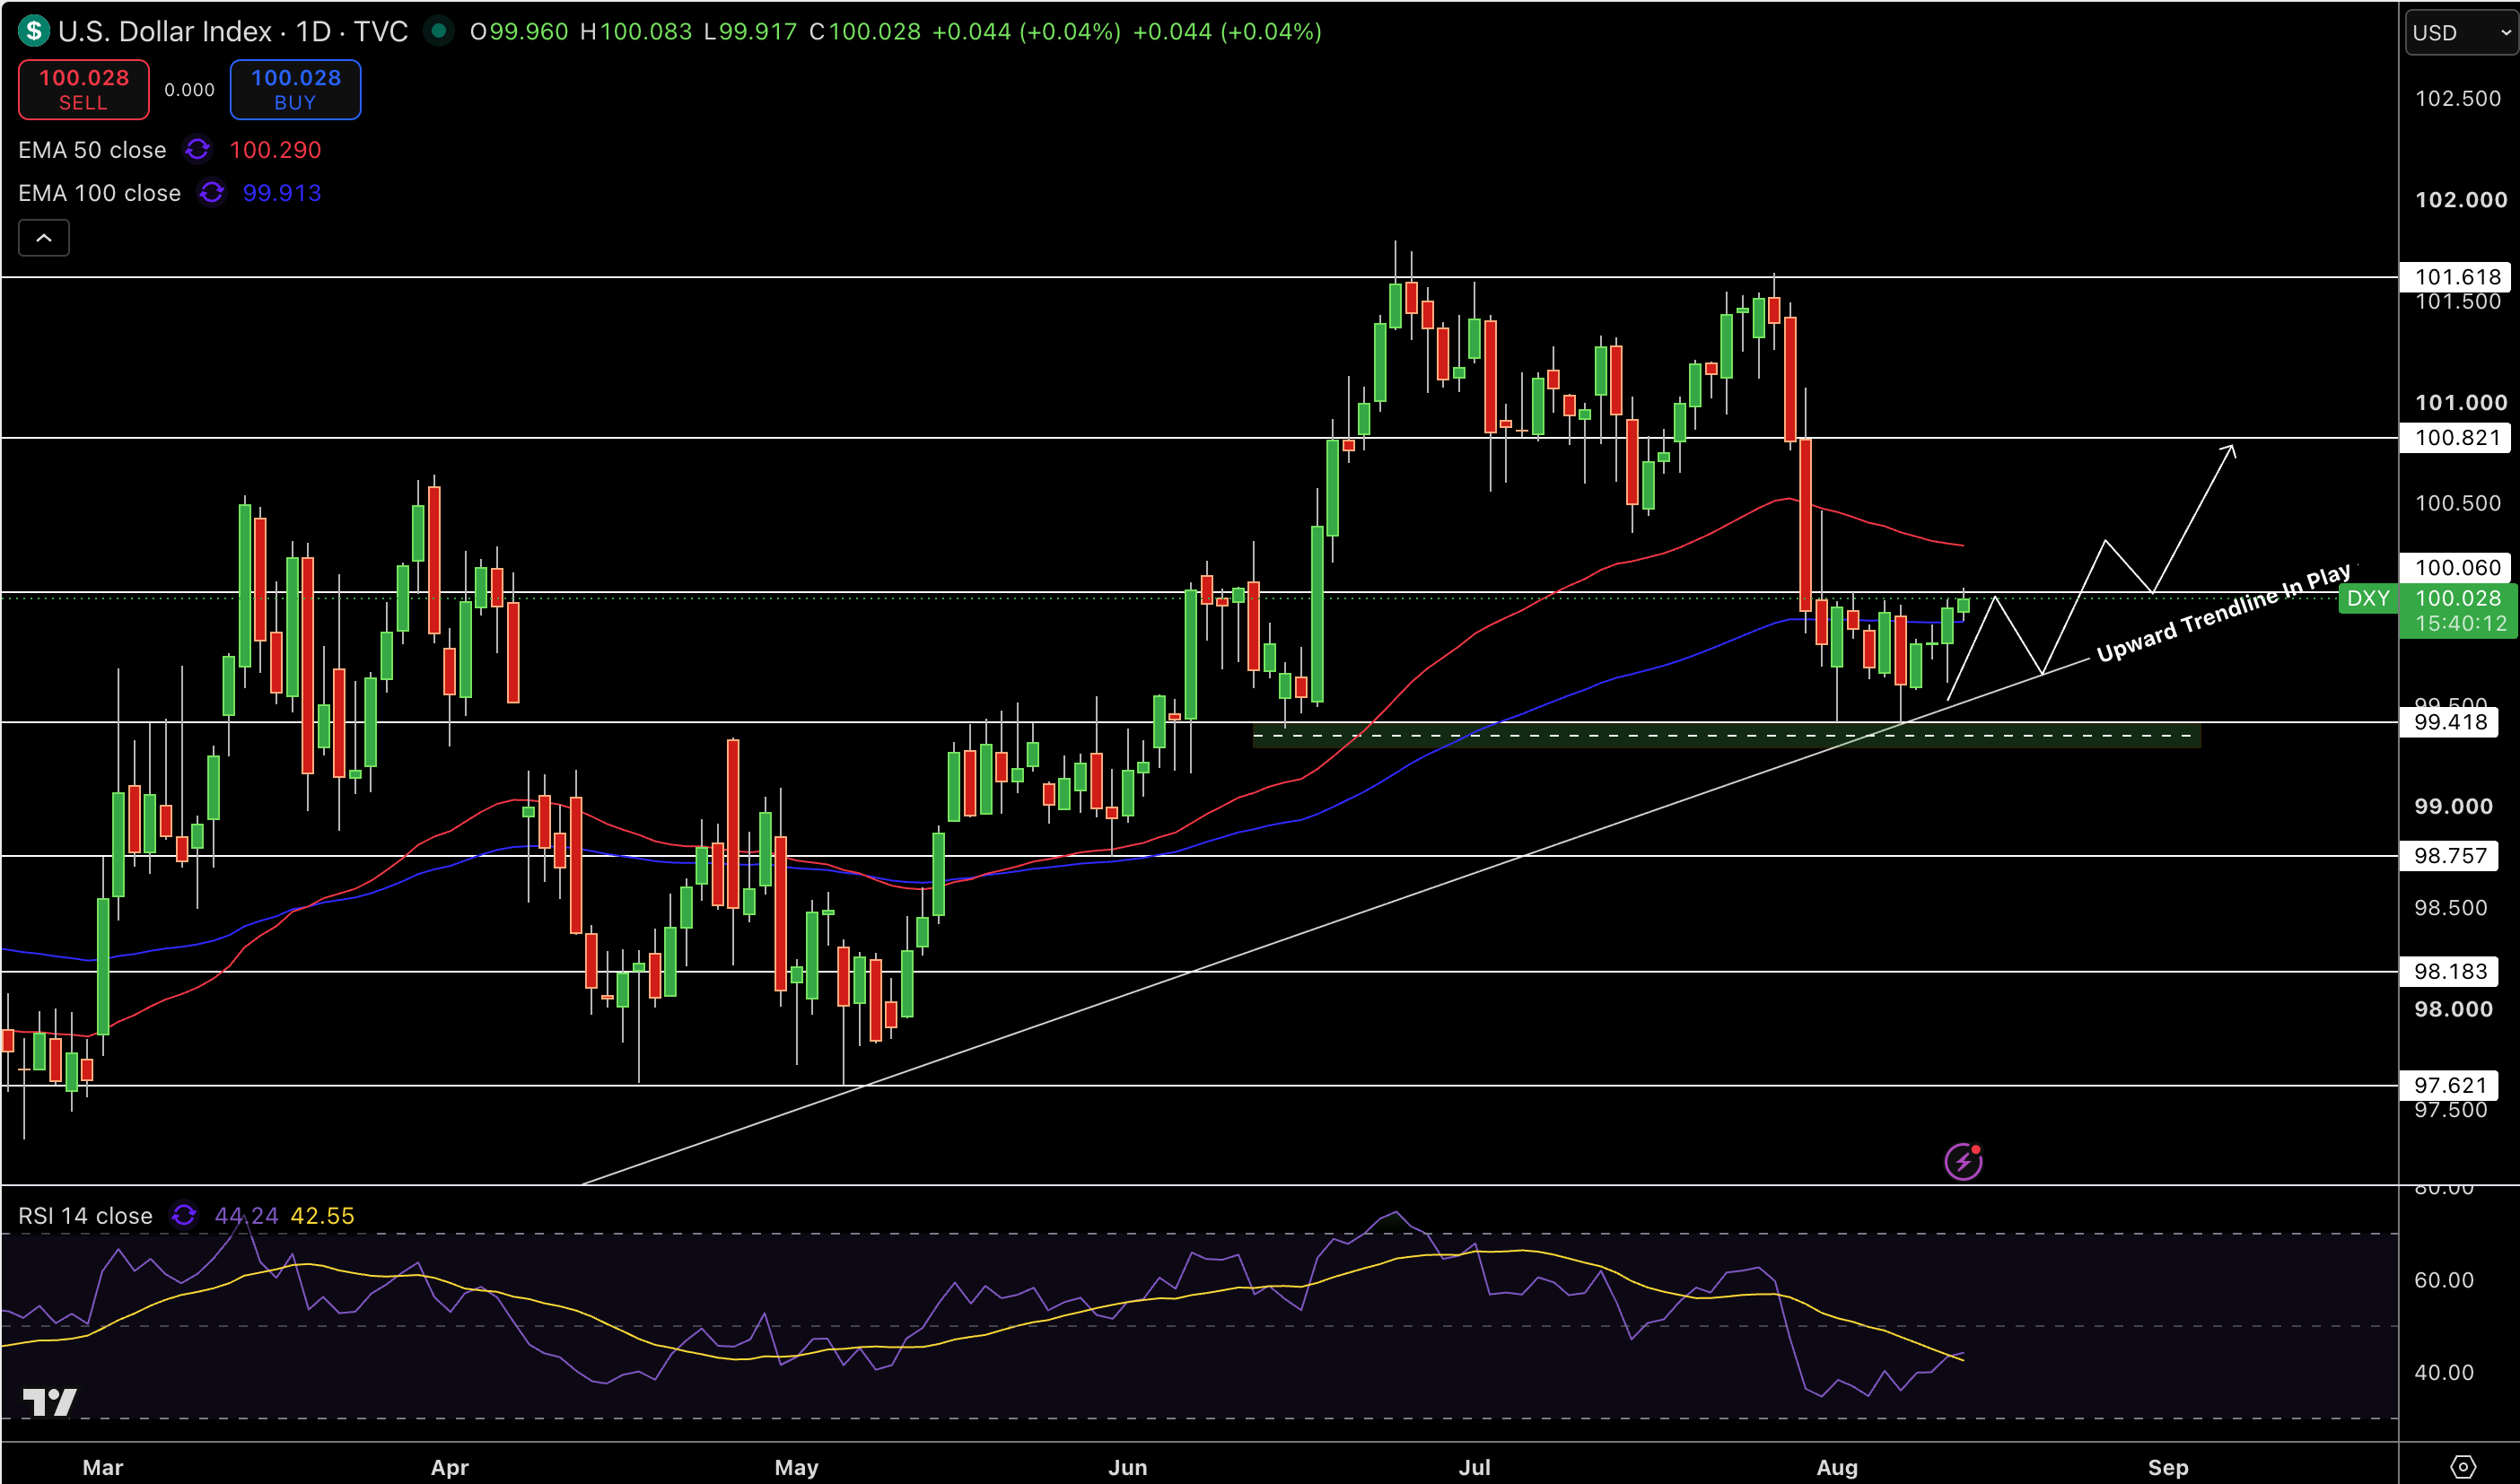
The U.S. Dollar Index is currently at $100.03, attempting to climb above the rising trendline and horizontal support at $99.42 that had previously acted as repeated support. Price has climbed above the 100 day EMA at $99.91; however, the 50 day EMA at $100.29 still acts as resistance. Recent candles show some buying pressure, but the index has yet to break above the resistance cluster to confirm the start of a stronger recovery.
RSI is around 44, on the path to recovery after being in weaker territory, but continues to be below 50. Resistance zones are at $100.06, $100.29, and $100.82. For support zones, we have $99.42, $98.76, and $98.18. From my perspective, the recovery continues to be valid as long as support is found above the trend line. If support is found above $100.29, I would lean more toward an extension to $100.82.
EUR/USD Price Forecast
Every new EUR/USD analysis as it publishes, today's technical signal and key levels, live price — on one page.
See all EUR/USD forecastsGBP/USD Technical Analysis: Pound Breaks Below $1.3515 Pivot as Momentum Weakens
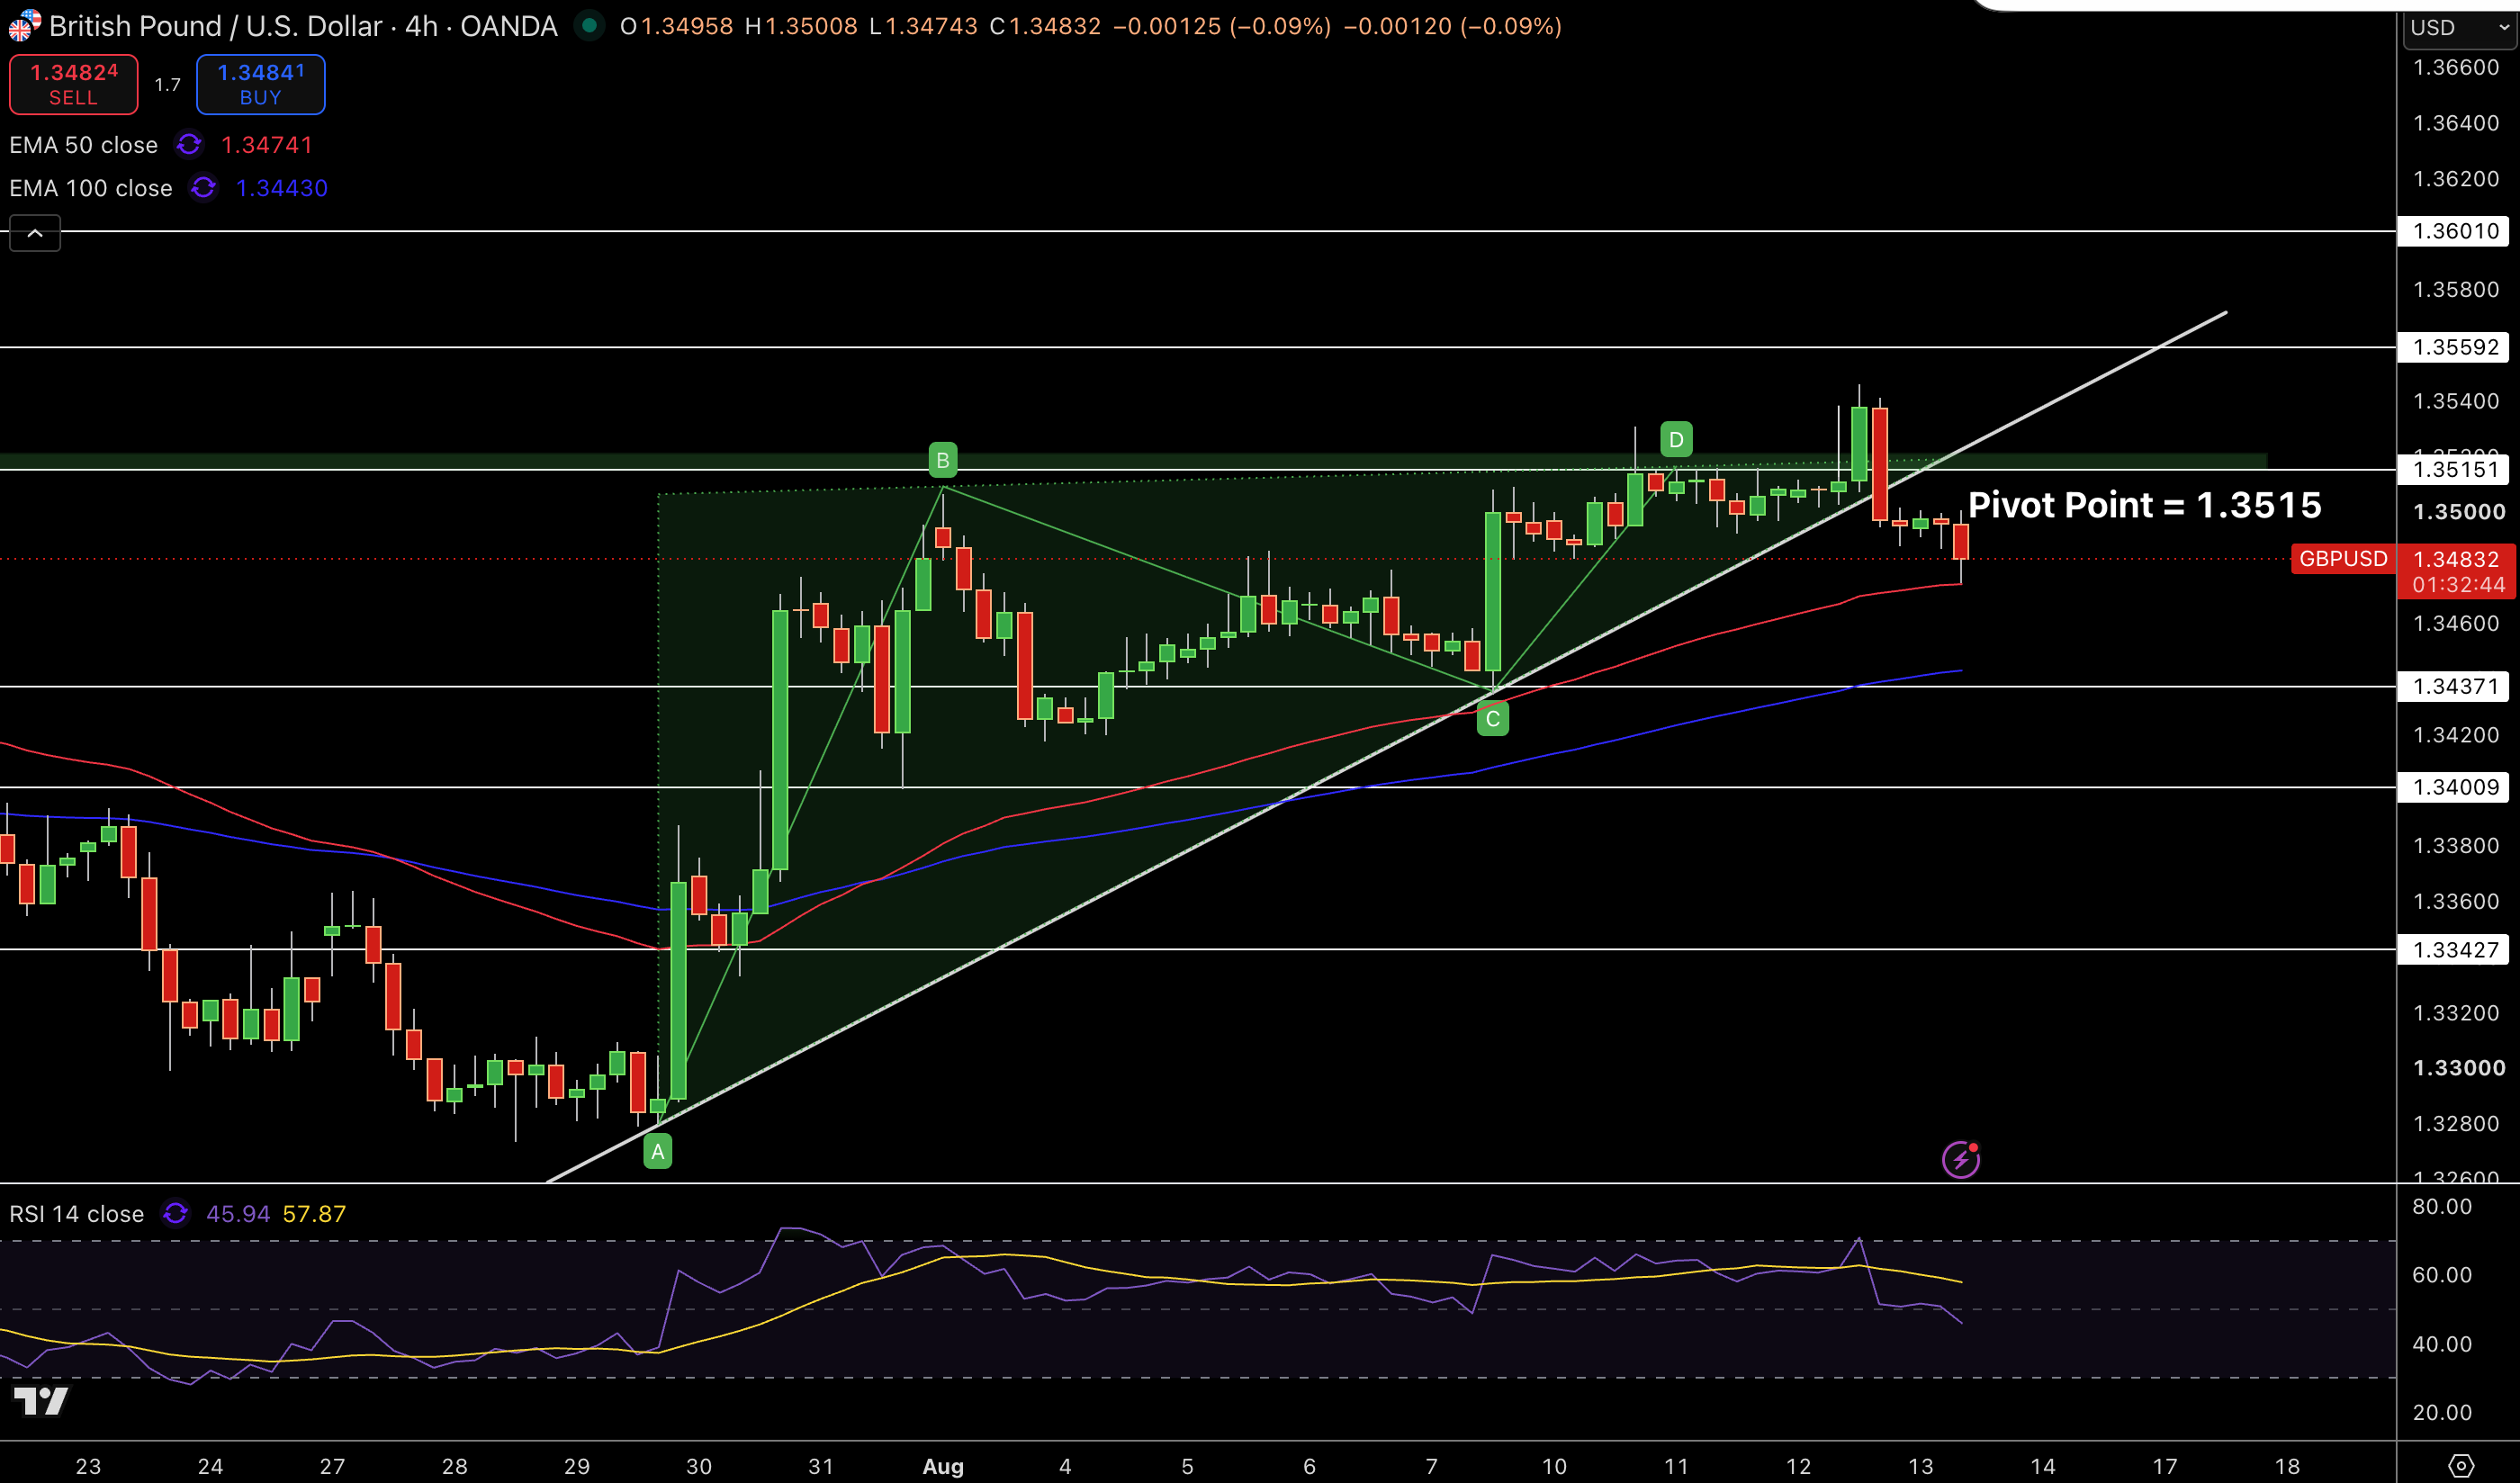
GBP/USD is trading at $1.3483 and has broken below the $1.3515 pivot area and the trendline that provided support to the recent movement. While price is above the 50 EMA at $1.3474, and the 100 EMA at $1.3443, the breakdown of the recovery structure has not occurred. The momentum has definitely shifted to the downside.
The Relative Strength Index (RSI) has moved down to around 46 and recently has lost bullish pressure as price was rejected from the $1.3515-$1.3540 area. Price movement resistance can be expected at $1.3515, $1.3559, $1.3601, while support can be expected at $1.3474 with stronger support expected at $1.3437, $1.3401, and $1.3343. Price action in GBP/USD has to break $1.3515 in order to retain the bullish scenario. Without that, emphasis will remain focused on the $1.3437-$1.3474zone.
EUR/USD Technical Analysis: Euro Rejected at Descending Trendline Near $1.1570
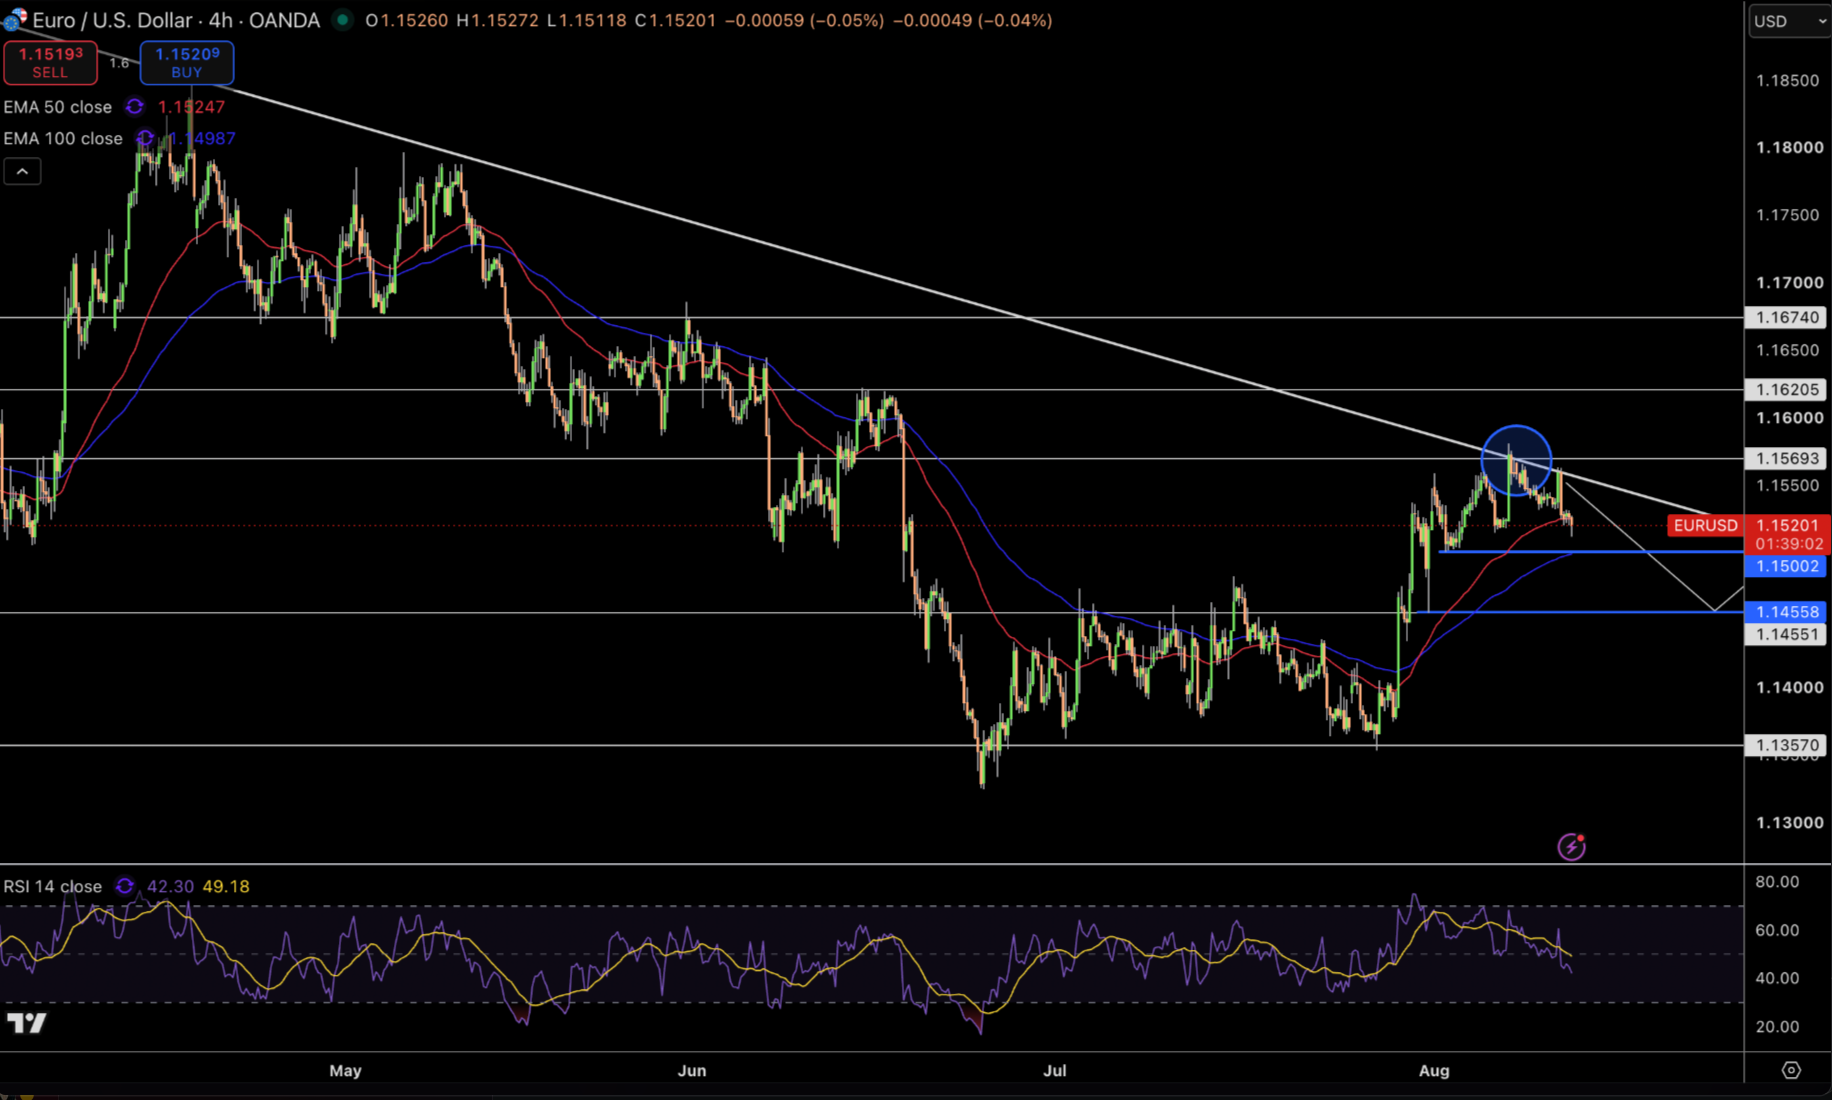
Currently at $1.1520 on the 4 hour chart, EUR/USD rejected the descending trendline again at $1.1569. The market is now heading down towards the 50 EMA at $1.1525, where the 100 EMA at $1.1499 is the next major dynamic support. The latest candles show the loss of upside momentum, with RSI heading down to 42, and the trendline, at the same time, showing loss of bullish momentum.
Immediate resistance lies at $1.1569, $1.1621, and $1.1674. On the other hand, $1.1500 and $1.1456 are the key support levels. In my opinion, the market remains bearish as long as it is trading below the descending trendline. A break above $1.1569 will put the bullish market back in play. However, if the market falls beneath $1.1500, the $1.1456 level may become active.



