Gold Got Everything It Wanted and Still Could Not Hold the High
Spot gold hit $4,449.83 Thursday morning and gave back nearly $86 in a matter of hours. CPI was soft Wednesday. PPI was even softer Thursday. Treasury yields dropped after both reports. September hike odds fell further. None of it was enough to keep the metal above $4,400 because the rally had already priced the good news before it arrived.
Buyers loaded up ahead of the data and when the numbers confirmed what they expected, there was nobody left to bid. The rebound off the session low at $4,364.17 after PPI says there is still demand underneath this market. The failure to hold the high says the easy money in this leg has already been made.
A second potential closing price reversal top is forming this week, and that pattern tells you traders are selling strength, not buying breakouts.
At 13:02 GMT, Spot Gold (XAUUSD) was trading at $4,394.41, down $14.11 or 0.32%. The session high was $4,449.83 and the low was $4,364.17.

Daily Spot Gold (XAUUSD) Technical Analysis
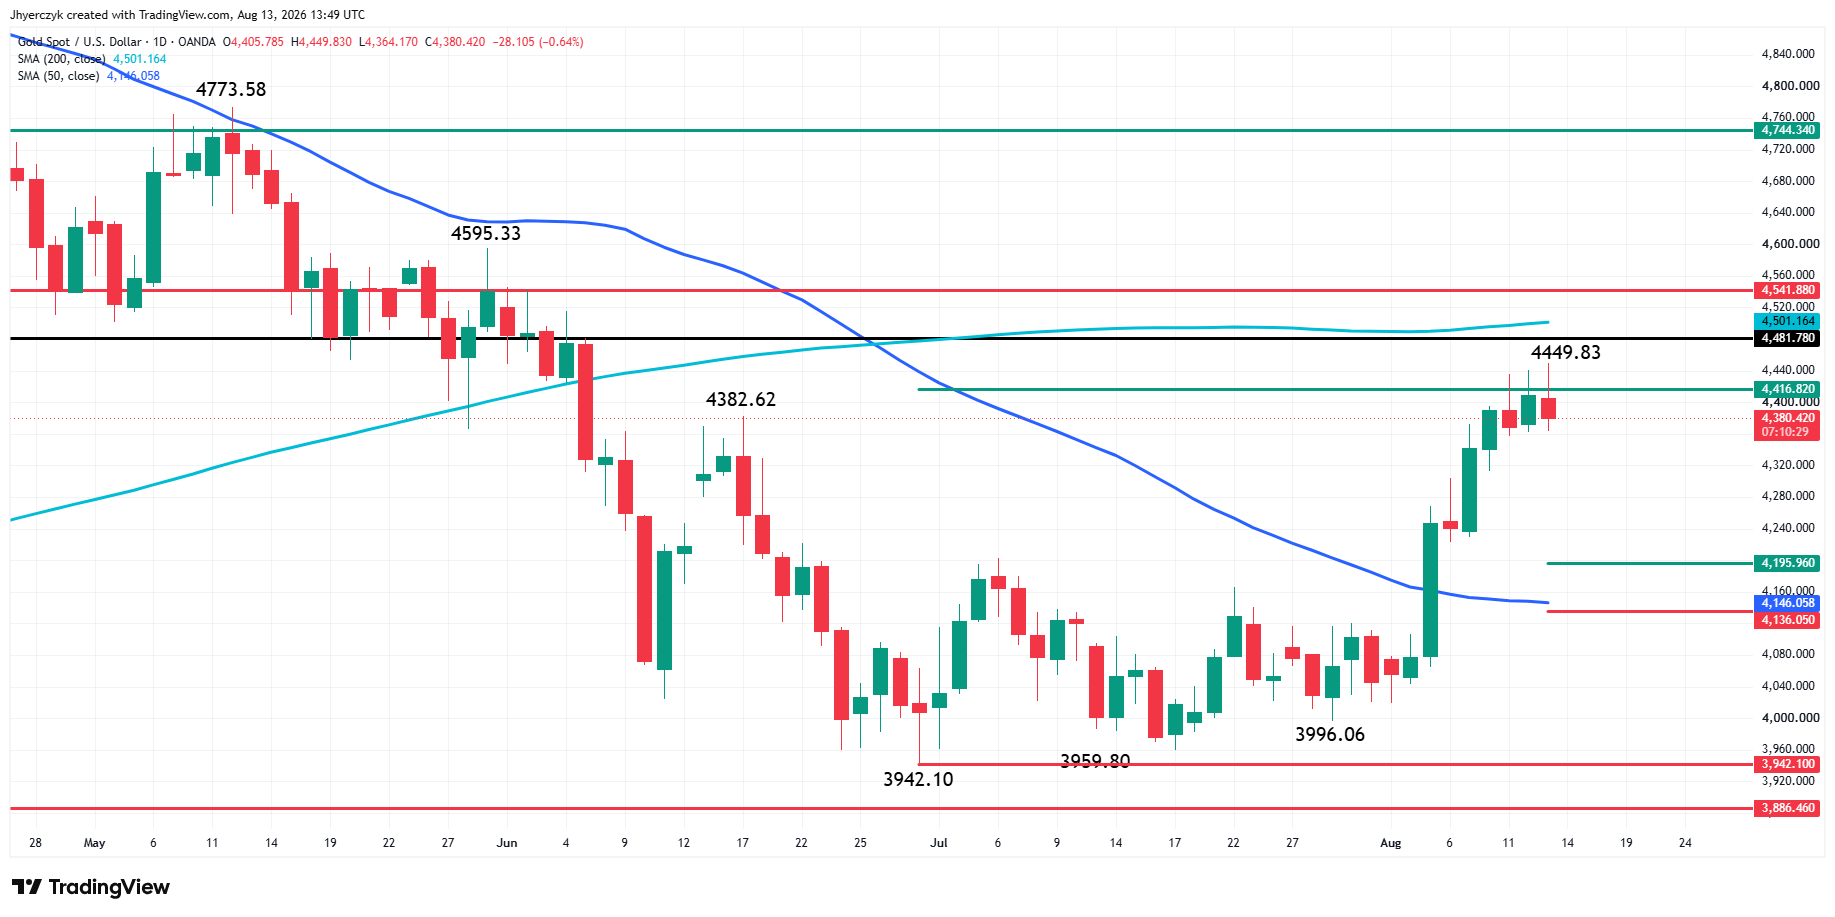
Spot gold is easing on Thursday after hitting its highest level since June 5 earlier in the session. Shortly after the opening, it overcame a 50% level to trade to $4,449.83. The rally stopped short of $4,481.78 and $4,501.24.
The first resistance at $4,481.78 represents 20% down from the all-time high. Classical analysts say this is where the bear market began. Overtaking it could mean the bear market is over, but it will not mean a new bull market is beginning. The 200-day moving average at $4,501.24 could be either resistance or a trigger point for an acceleration to the upside.
More important than the upside targets, in my opinion, is the potential support cluster at $4,195.96 to $4,136.05, which includes the 50-day moving average at $4,146.29.
The market is currently forming a potentially bearish closing price reversal top. We will not know until the close, but if it does, it will be the second this week. This could be a sign that traders are selling rallies.
Gold Price Forecast
Every new Gold analysis as it publishes, today's technical signal and key levels, live price — on one page.
See all Gold forecastsTwo Soft Inflation Reports and Gold Still Sold Off
July PPI came in flat for the month. The market was expecting a 0.2% increase. Core PPI rose 0.2% against a 0.3% forecast. Annual headline PPI slowed to 4.7%. Core annual fell to 4.2%. That followed Wednesday’s CPI at 0.1% monthly and 3.4% annually with core at 2.5%, all of it cooling from June.
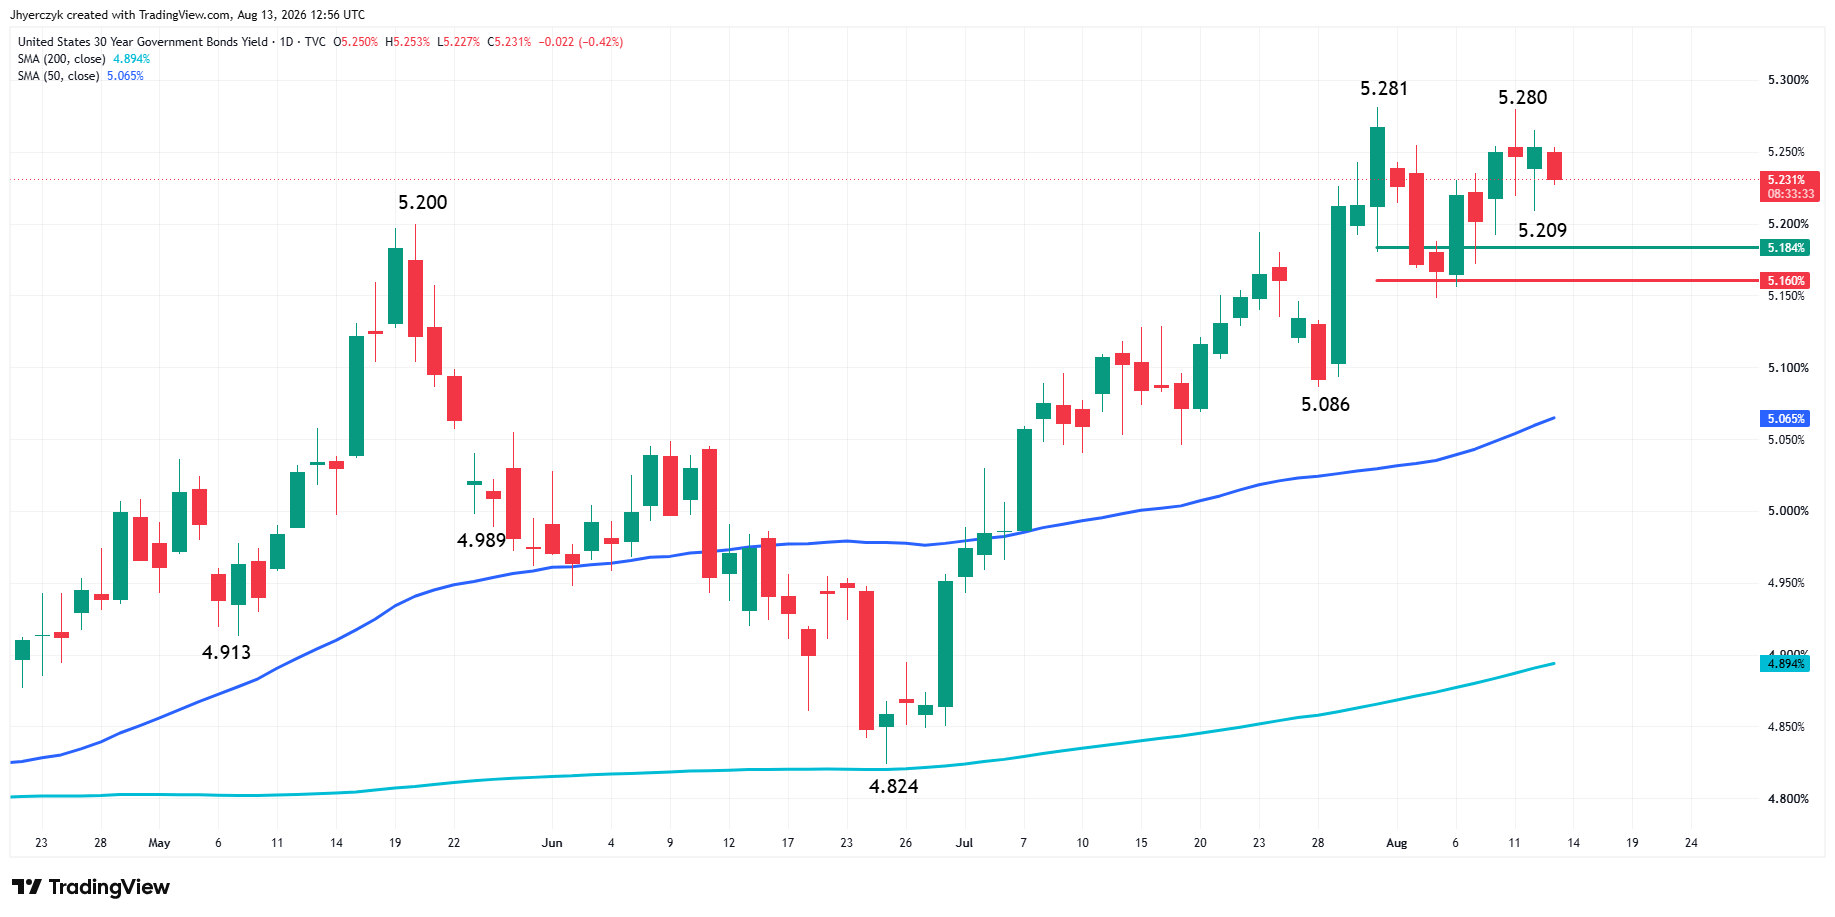
The 10-year Treasury yield dropped to around 4.666% after the PPI print and the two-year fell to 4.168%. September hike odds are now well below 40%, down from above 50% earlier in the week. Two straight reports telling the Fed that inflation is cooling and the bond market is pricing it. Gold should be pressing toward the 200-day moving average right now. Instead it is fighting to hold $4,394.
Speculative accounts had already built long positions ahead of both releases. When the data landed soft, there was no fresh buying power left to push the market higher. The rally from last week’s payrolls miss through Wednesday’s CPI move had already done the work. Thursday’s PPI confirmed what was already priced. The $86 drop from the session high to $4,364 showed how fast sellers can appear in a crowded trade.
The rebound after PPI matters. Gold did not collapse. It found a floor and bounced, which tells you the bid on dips is real. But the failure to reclaim the morning high tells you something too. The buyers who came in this week are taking profits, not adding.
The Dollar Did Not Get the Memo
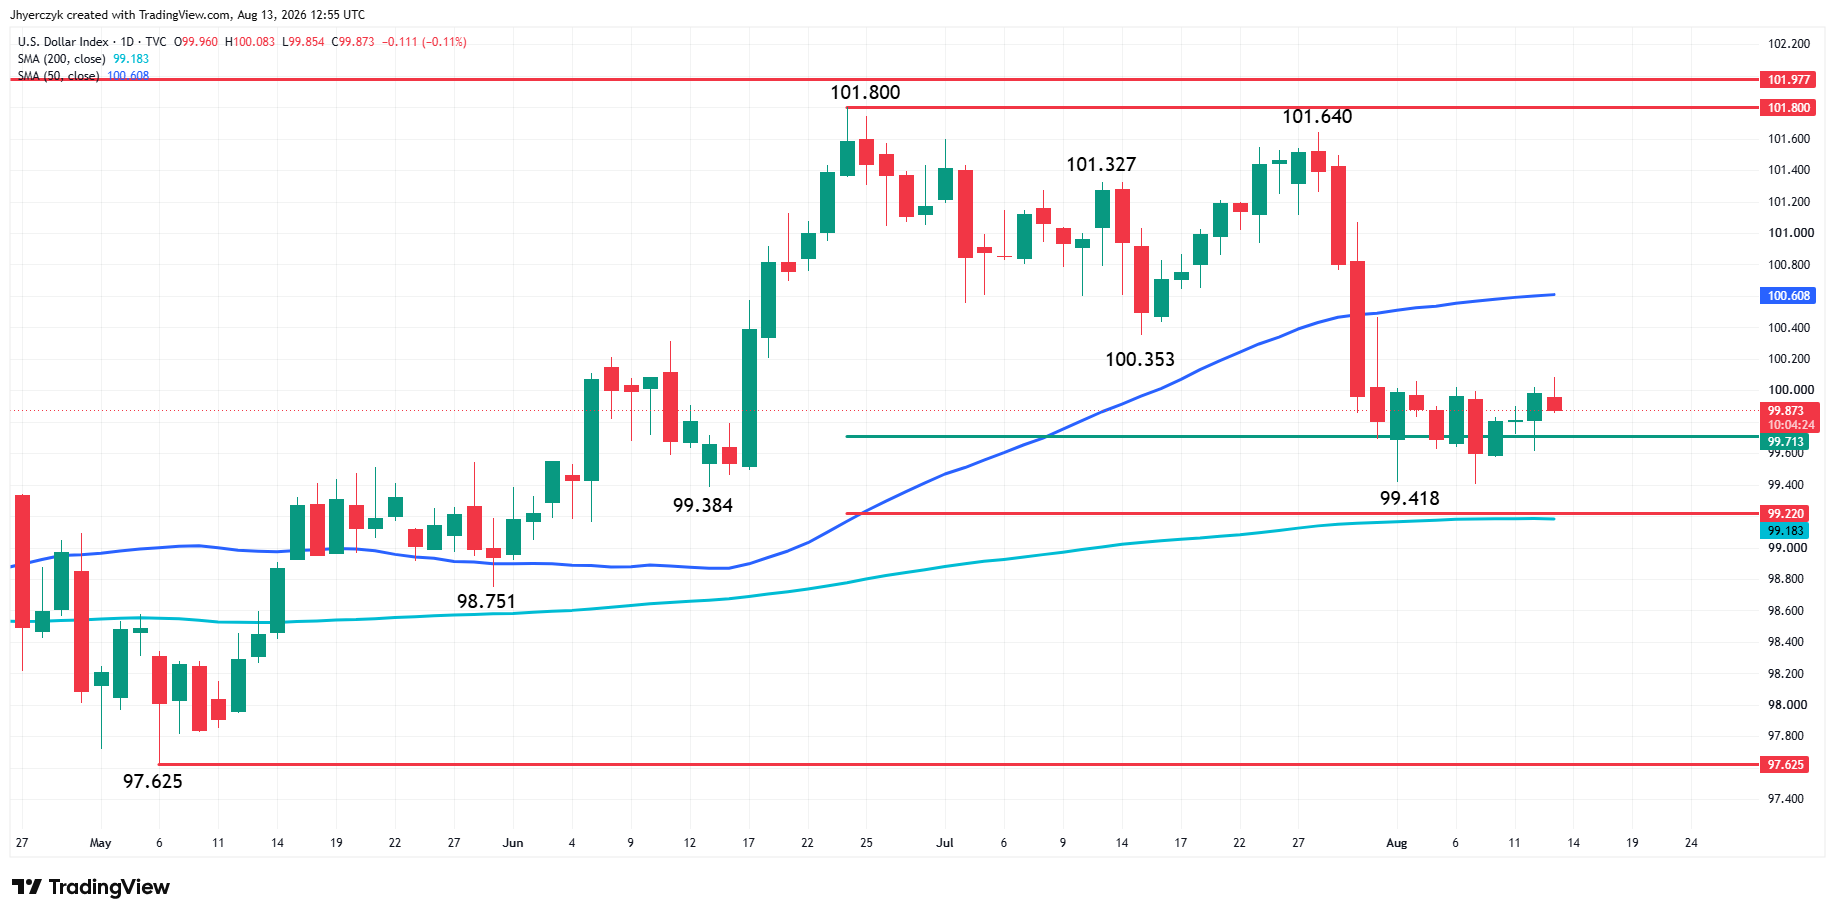
The bond market responded to CPI and PPI exactly the way gold bulls wanted. Yields moved lower across the curve. The dollar did not follow. The greenback is sitting near a two-week high around 100.00 and has not broken down despite back-to-back soft inflation reports.
That matters because a firm dollar raises the cost of gold for buyers outside the United States. Gold rallied to its highest level since early June this week while the dollar held firm through the entire move. The bond market is cooperating. The currency market is not. Until the dollar starts confirming what yields are saying, gold has a ceiling it cannot get past no matter how friendly the inflation data comes in.
Geopolitical uncertainty tied to the Middle East is part of the reason the dollar is holding. The Strait of Hormuz is still restricted. That keeps a bid under the greenback even as rate expectations shift lower. The dollar is trading the conflict. Gold is trading the rate outlook. They are looking at different sides of the same story and right now the dollar’s side is winning.
Oil Dropped but the Inflation Overhang Has Not Cleared
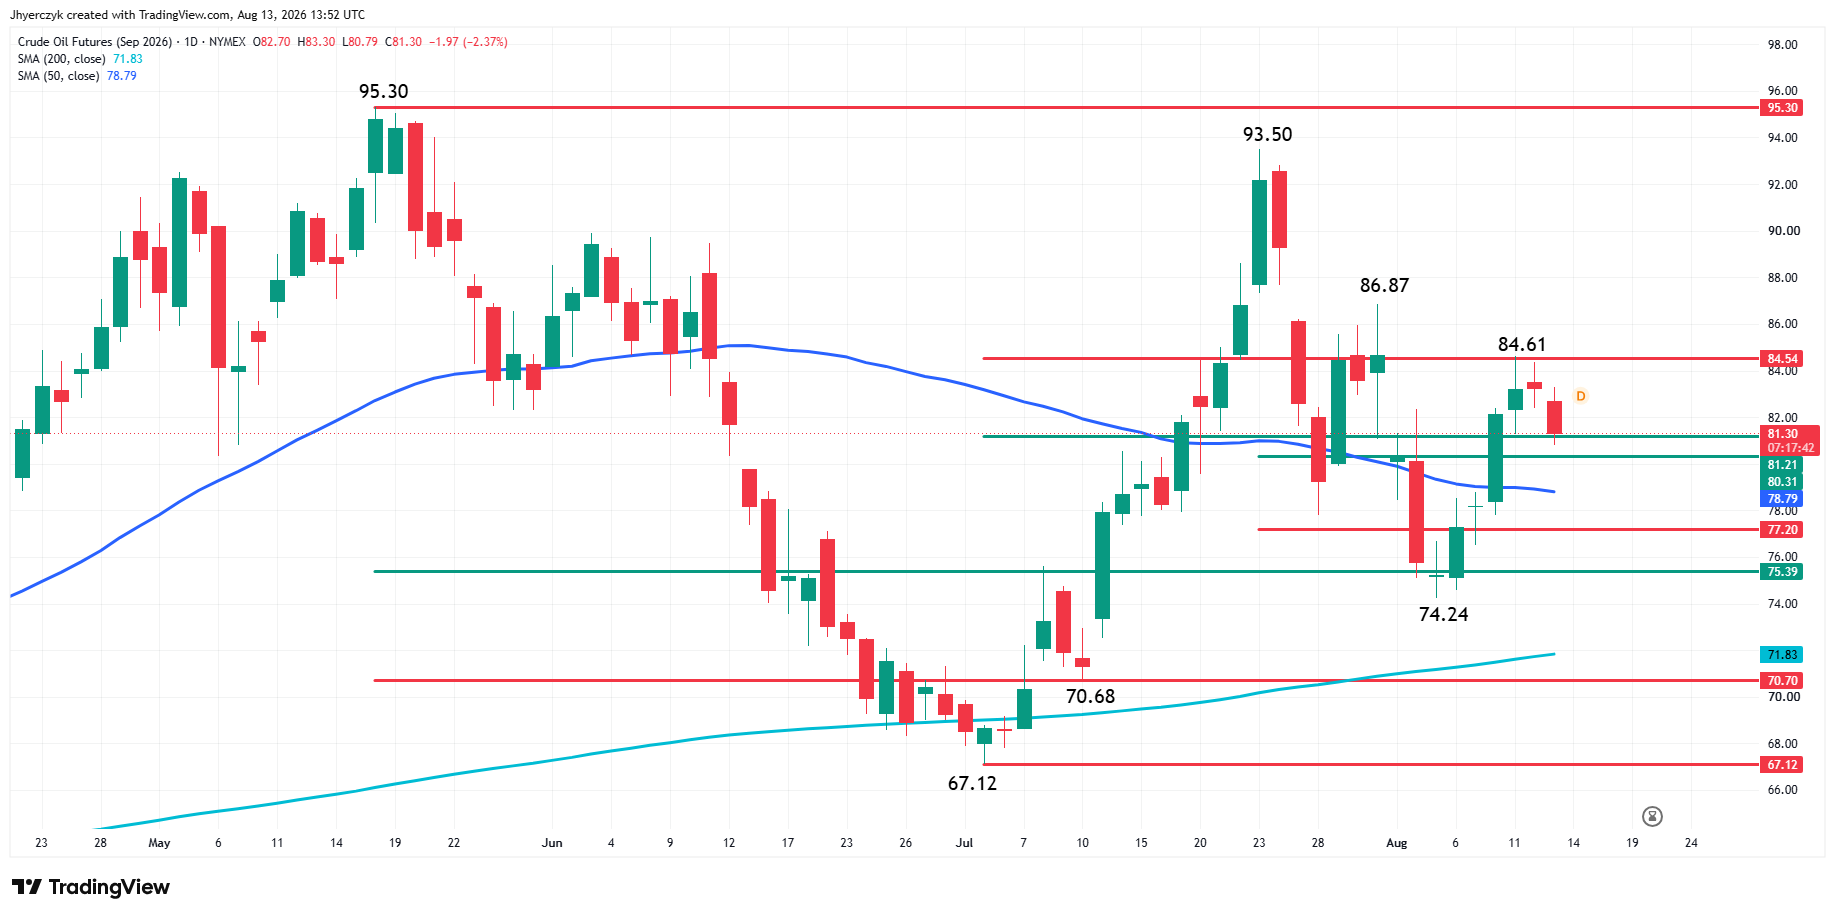
WTI near $82 and Brent near $87.70 are both down more than 1% Thursday. OPEC and the IEA both cut demand forecasts this week. Lower crude on a weekly basis takes pressure off headline inflation, and that supports the case for a Fed hold in September.
The oil decline helps gold at the margin. It does not close the inflation door. Crude is still well above the levels it traded before the Hormuz conflict started. The strait remains restricted. Houthi attacks continue on alternative shipping routes. Fed officials have said repeatedly that they are watching energy costs, and oil staying elevated even on a down day keeps that part of the argument from going away completely.
Gold is getting a friendlier inflation backdrop from cheaper crude. It is not getting an all-clear signal.
What to Watch
Gold got two soft inflation reports, lower yields and falling hike odds this week and could not sustain a move above $4,400. The market ran hard from last week’s payrolls miss through Wednesday’s CPI high and Thursday proved the buyers who drove that move are taking profits. Retail sales Friday is the last major data point of the week. A weak number reinforces the case for a Fed hold and gives gold another chance to stabilize. The dollar near a two-week high is the obstacle that has to give way before the next leg higher has room.
A second closing price reversal top this week would confirm the pattern of sellers showing up at resistance. Gold reached $4,449.83 Thursday and stalled well short of the $4,481 level where the bear market began and the 200-day moving average just above it. On the downside, the support cluster near the 50-day moving average at $4,146 is where buyers need to show up if the correction extends beyond profit-taking. The range between those zones is wide, and the close Thursday will tell you which side has control heading into Friday.
If you’d like to know more about how to trade gold, please visit our educational area.