


Zcash’s (ZEC) explosive multi-week rally is beginning to unravel as a classic inverse-cup-and-handle (IC&H) pattern takes shape on the 4-hour chart, a structure that often precedes deep corrective moves.
ZEC Could Dip Nearly 50% If Pattern Plays Out: See How
After peaking near the $750 region, ZEC has traced a rounded top, followed by a failed recovery attempt that now resembles the “handle” portion.
The breakdown from this handle is underway, with price slipping beneath its short-term rising trendline and retesting the neckline around $440, a level that previously acted as a strong demand zone.
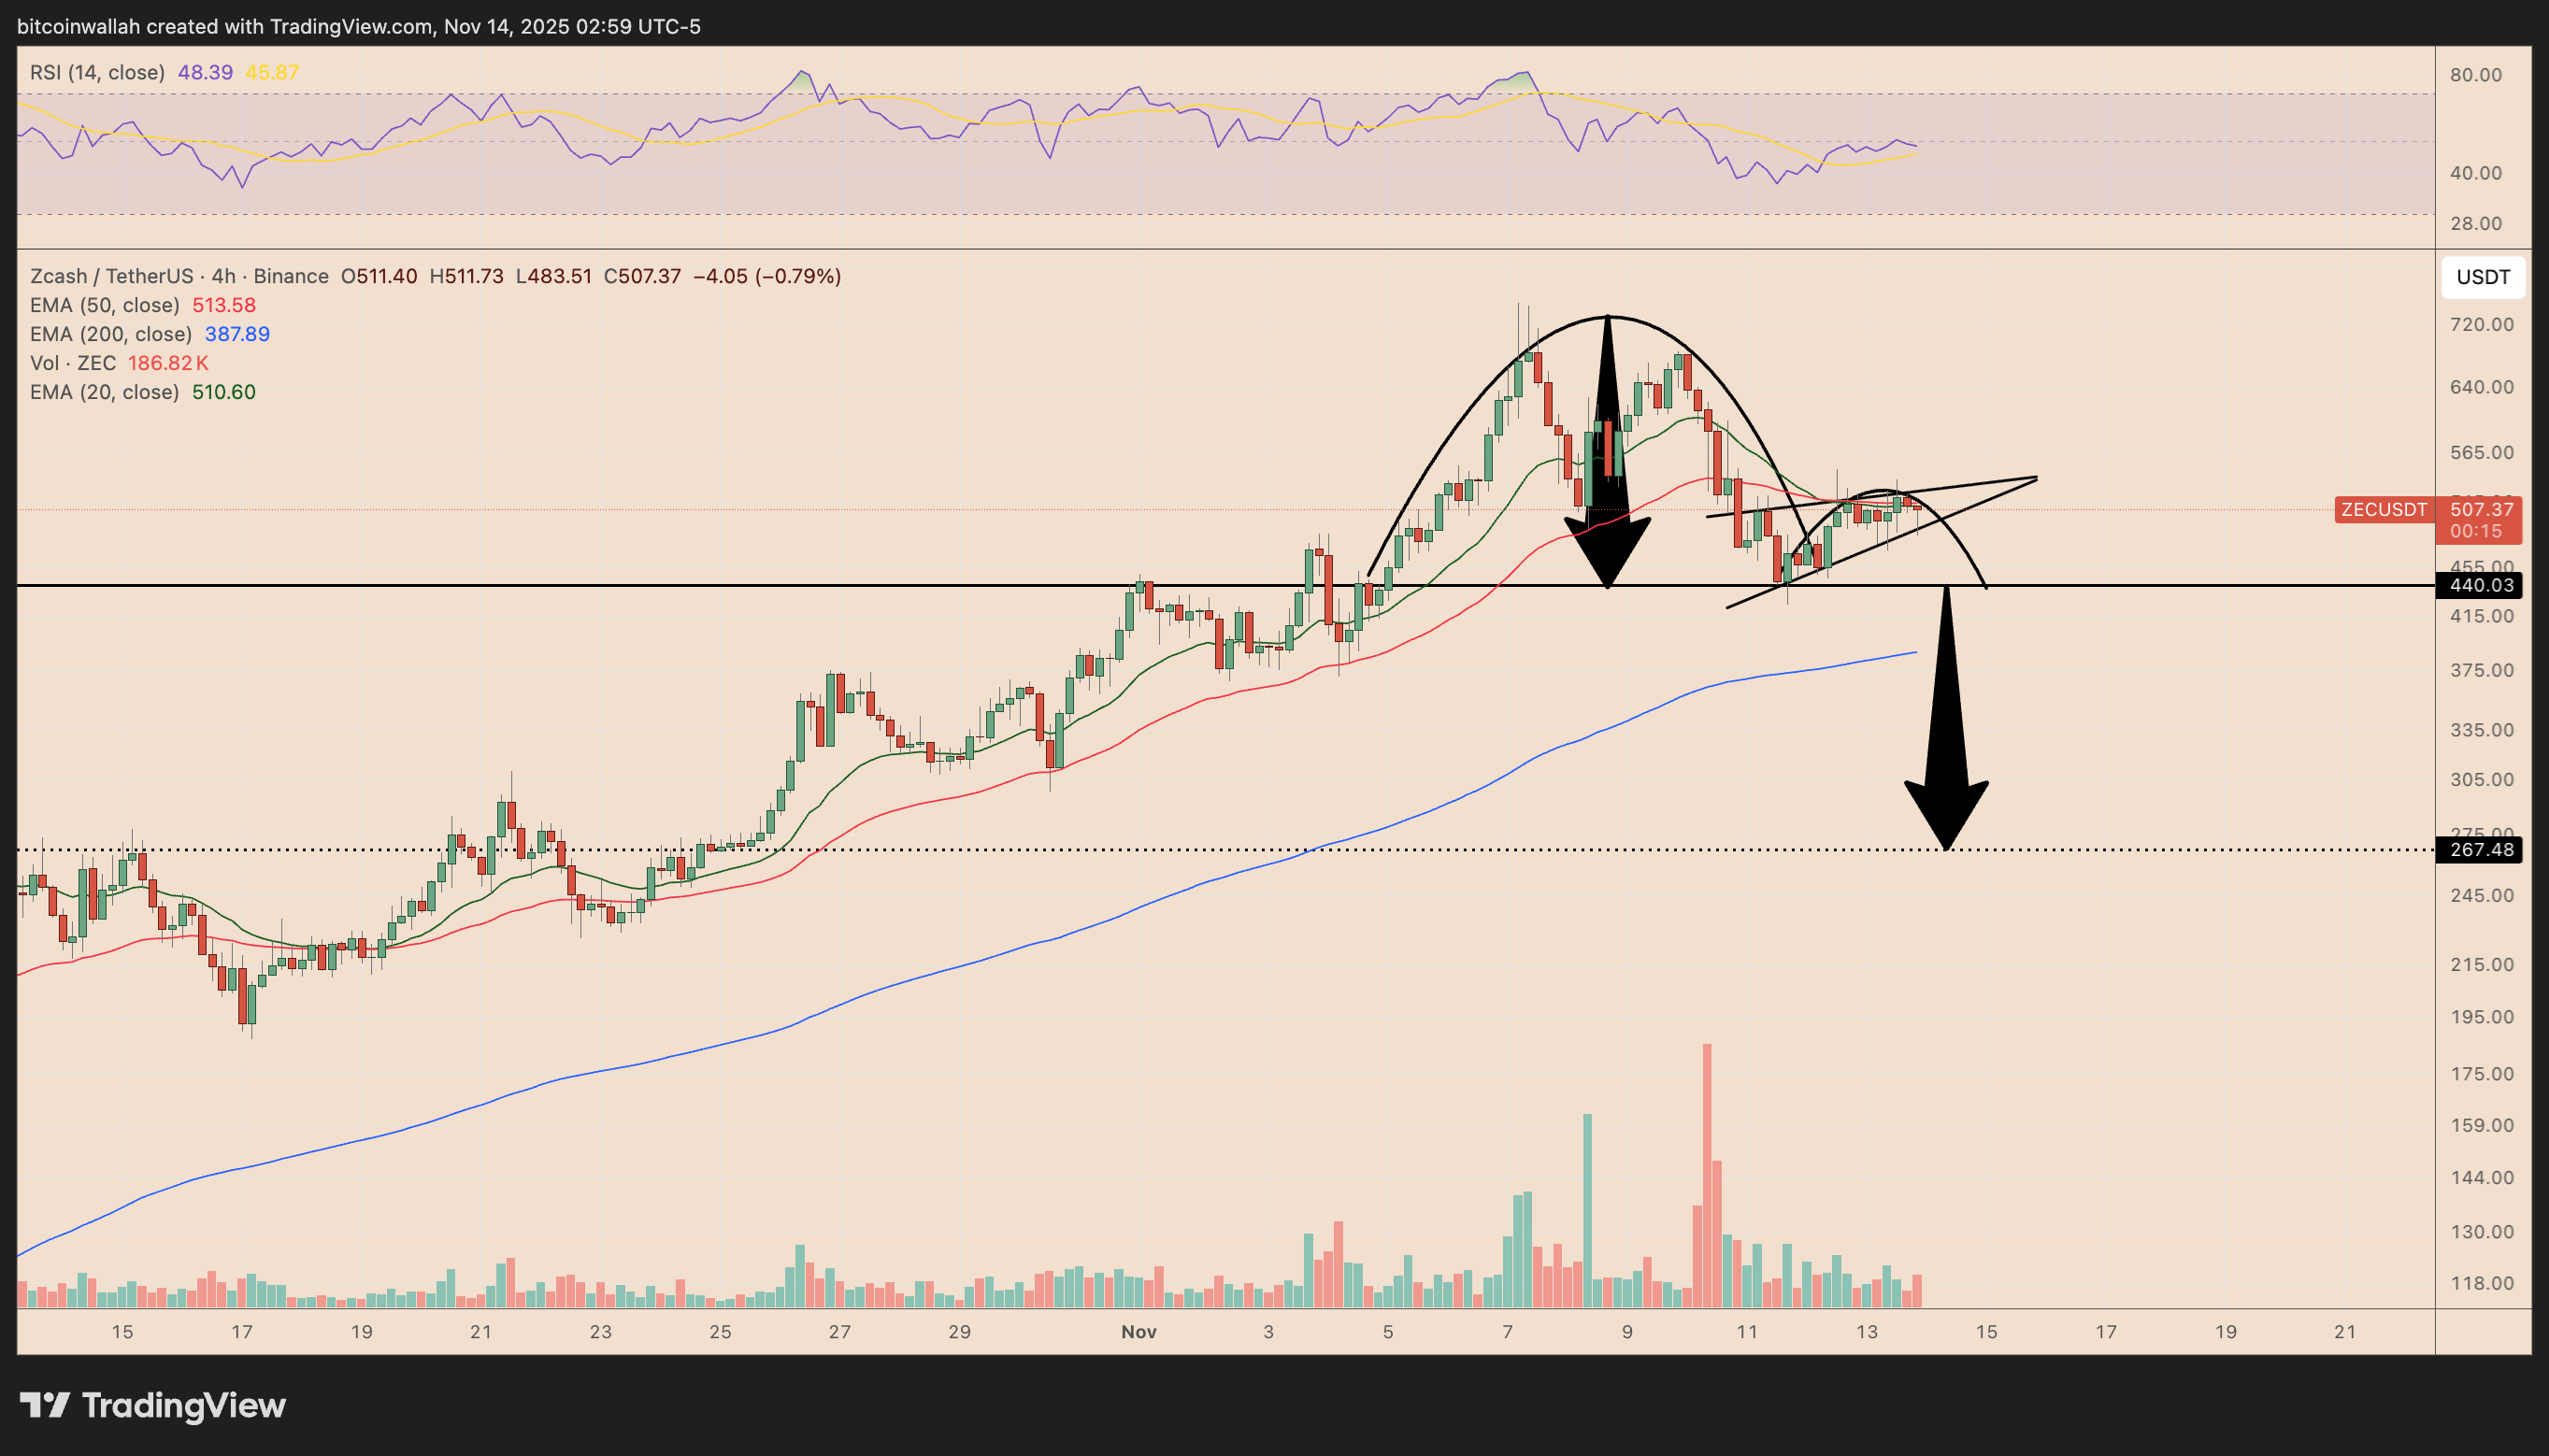
A decisive close below $440 would activate the IC&H structure, exposing ZEC to a measured-move target toward $267, marking a potential 50% decline from current levels.
The volume profile reinforces this risk: the rally into the November peak was accompanied by expanding volume, while the reversal and handle formation occurred on thinning demand, a typical hallmark of pattern exhaustion.
The 200-period EMA, located near the mid-$380s, could provide an interim cushion and may even host short-term bounces.
Fed-Induced Risk Aversion Adds Fuel to ZEC’s Reversal
Macro headwinds are compounding Zcash’s technical vulnerability.
A wave of risk aversion has swept across global markets, including US benchmarks Nasdaq and S&P 500, after traders sharply scaled back expectations for a December Federal Reserve rate cut.

This shift has pressured high-beta assets across the board, including cryptocurrencies, leading to synchronized declines in equities and digital assets.
For ZEC, which had been riding a euphoric run-up driven by a surge in speculative volume and rotation into the privacy-coin sector, the timing appears worse.
As of Friday, the coin was sitting atop nearly 580% quarter-to-date profits, offering traders a greater profit-locking opportunity compared to other crypto assets and macro markets.
What Could Change This Bearish View?
ZEC’s bearish setup could weaken if buyers continue defending the 20-day EMA, a dynamic support that has guided its entire Q4 rally.
A sustained close above this level would indicate that short-term momentum remains intact.
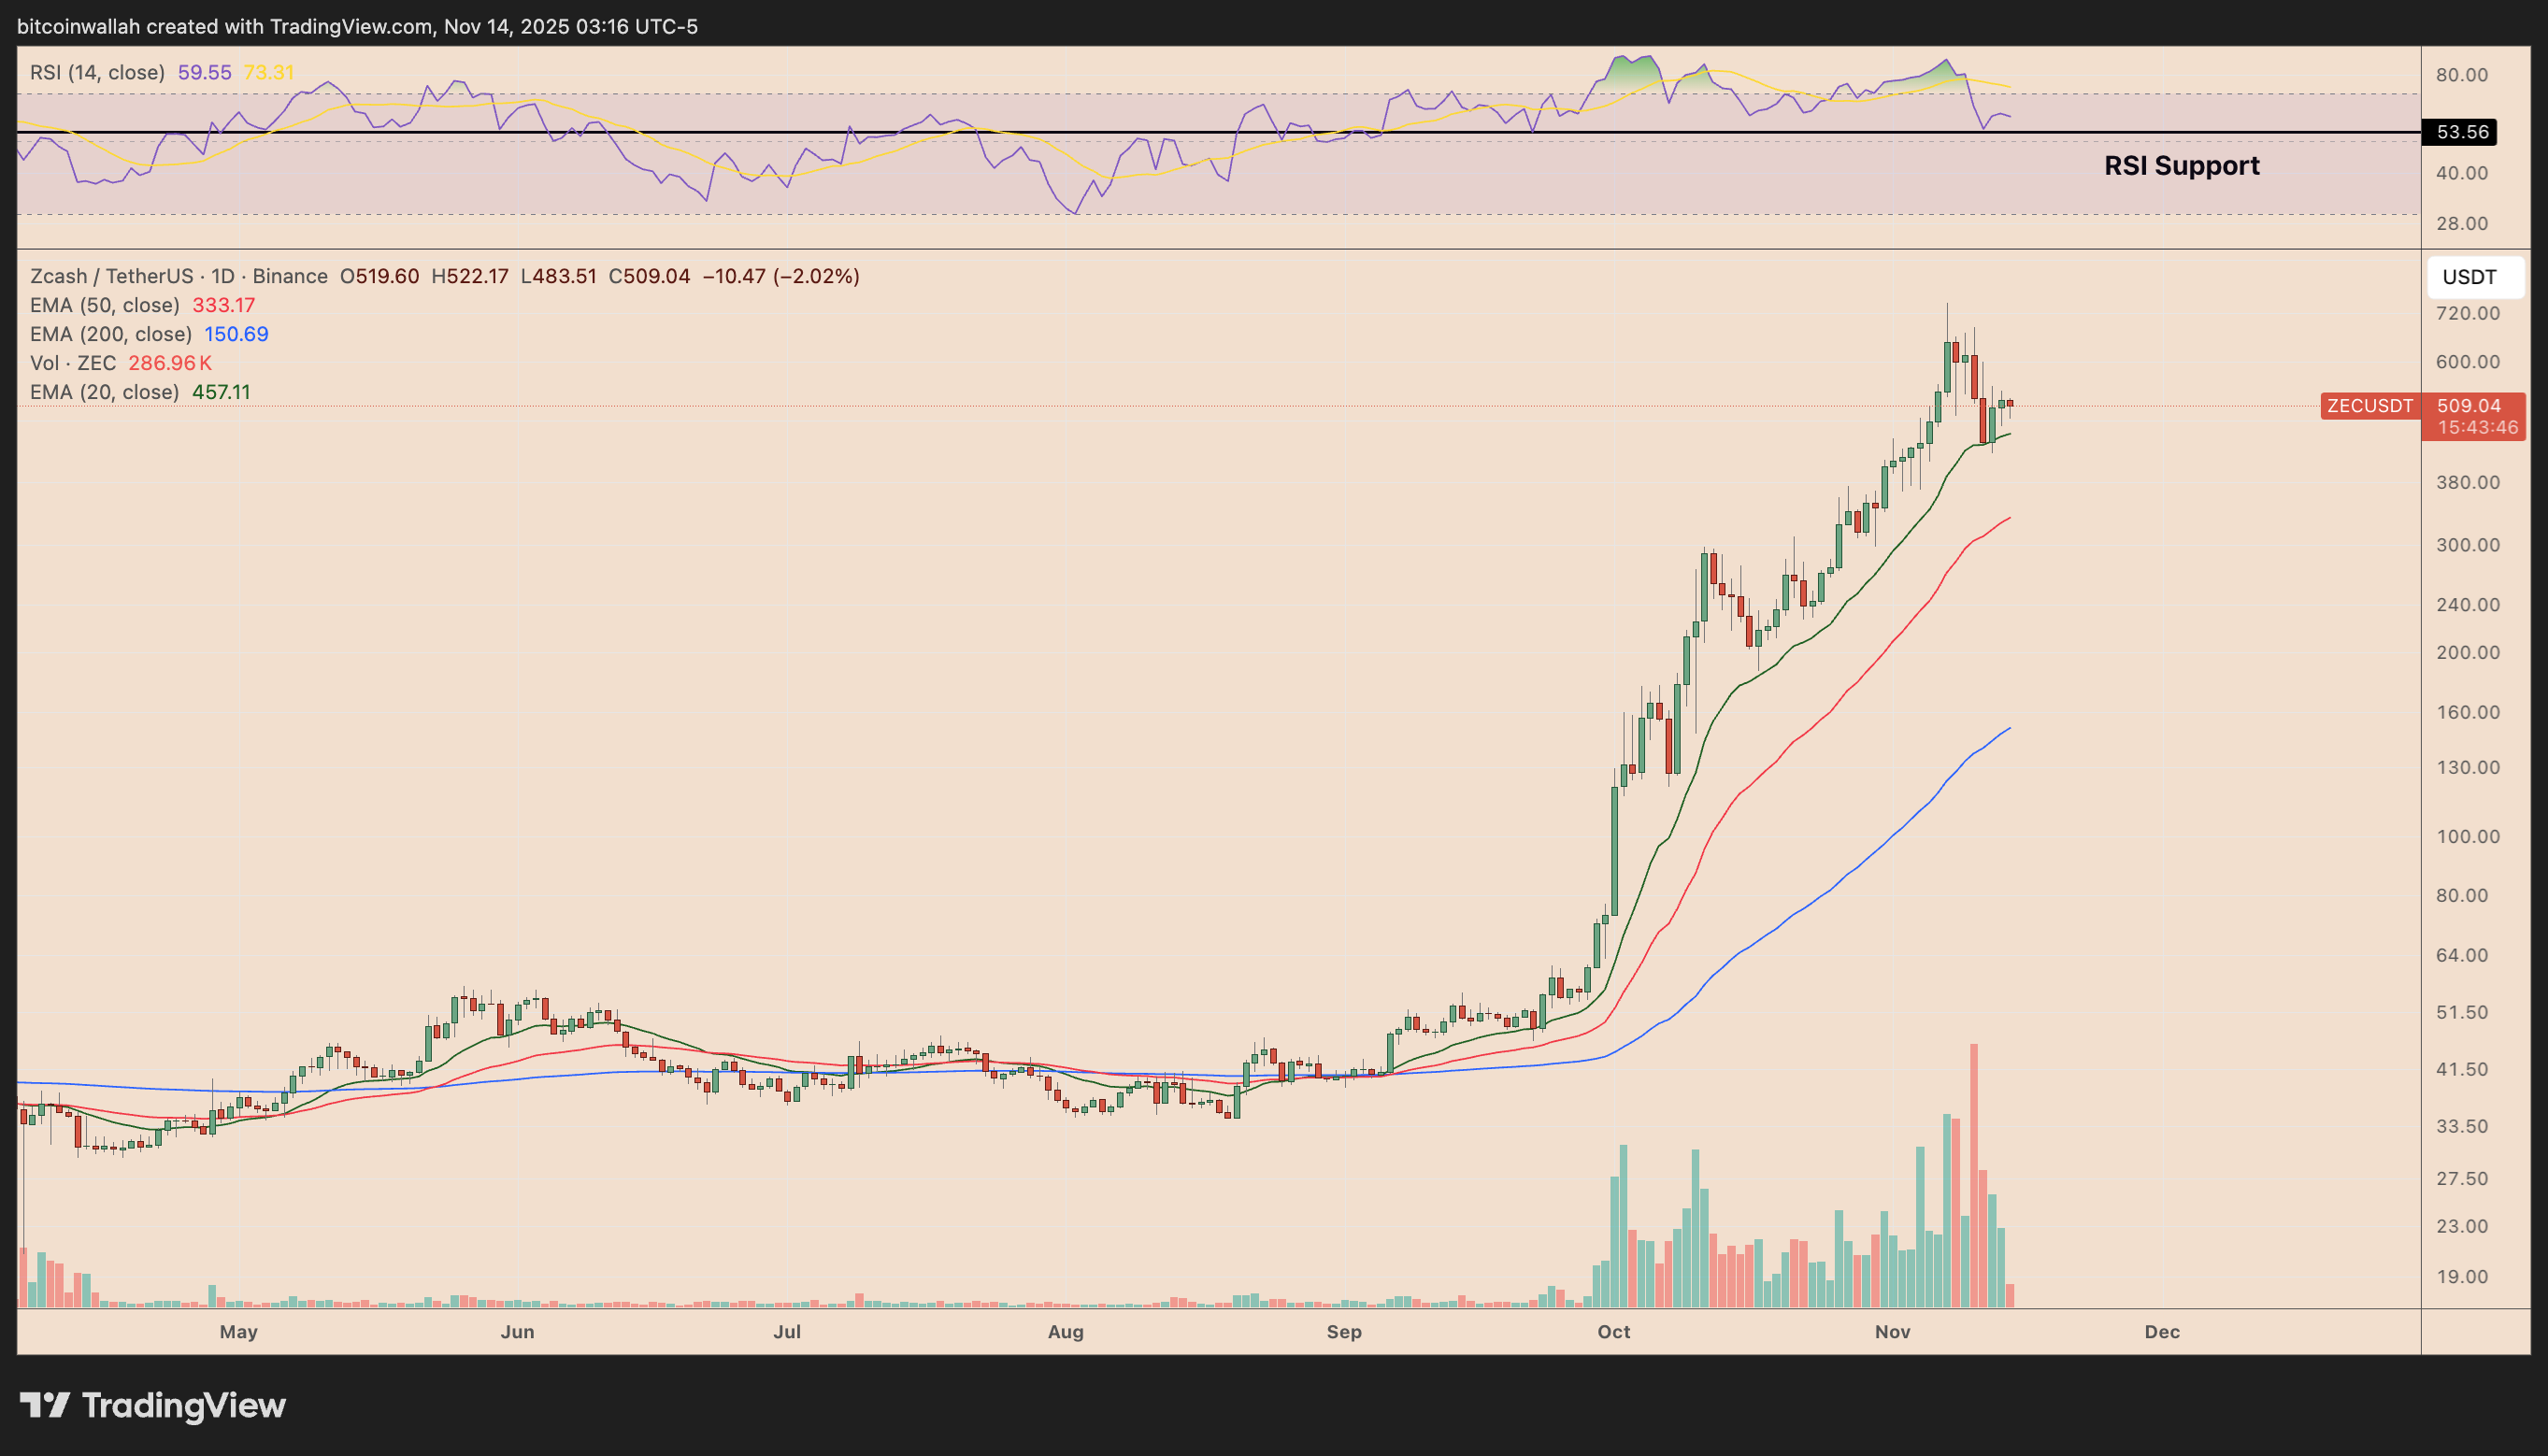
Additionally, the RSI is holding above a key support band near 53, suggesting bullish momentum has not fully broken down. A rebound from these zones could delay—or even invalidate—the inverse-cup-and-handle breakdown.