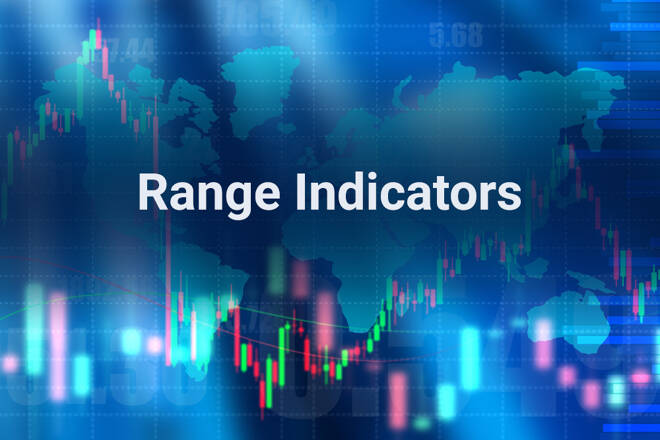
The range indicator is a technical tool that measures the limits of price movement over a specified time frame.
The range indicator is a technical tool that measures the limits of price movement over a specified time frame. It is estimated that market prices are engaged in uptrends and downtrends just 15% to 20% of the time, with the balance spent within the boundaries of trading ranges that can be relatively narrow or wide. This indicator attempts to determine the characteristics of prices caught within these ranges, seeking to predict future movement and direction.
Many range indicators look for boundaries between ranges and trends, with the technician seeking to profit when a) a trend eases into a trading range or b) a trading range yields a new trend, higher or lower. One popular method to perform this analysis identifies range boundaries and then measures the quality of price action between highs and lows. This analysis often includes volatility calculations, looking for transitions from low to high volatility, and vice-versa, to generate preliminary buy and sell signals.
Other types of technical indicators can perform sophisticated range analysis as well. For example, Bollinger Bands will expand during trends and contract during range development. Bands tend to narrow to an extreme at the starting point of a new trend and widen to an extreme at the starting point of a new trading range. Those turning points can generate actionable entry or exit signals, especially when confirmed through other forms of technical analysis.
Average True Range (ATR) measures volatility by examining a security’s price action over a specified time period. The initial calculation subtracts the high from the low of a single price bar and compares that value to price ranges in prior bars. The final calculation is derived from a smoothed moving average of these values (true ranges) over N periods, with ‘N’ the time setting chosen by the technician. 14 days (or periods) is the most common ATR setting.
Securities with high ATR readings are more volatile than securities with low ATR readings but the calculation does not predict price direction. Rather, it is a supplementary technical tool best used in conjunction with trend-following and momentum indicators. Many traders develop exit strategies using ATR multiples that seek to identify when volatility has reached an unsustainable level. In addition, the indicator has powerful applications in determining position size and risk.
The Darvas Box indicator generates rectangular-shaped boxes that rise or fall over time. Although frequently listed as a momentum indicator, the formula identifies rangebound market conditions that lower odds for profitable trend-following strategies. The rise and fall of boxes add to this analysis, signaling when the quality of price action has changed enough to permit freer directional movement, higher or lower.
Traditional Darvas Box strategies require that market participants take exposure solely in the direction of the boxes, updating stops whenever price action crosses the top threshold. The original work includes fundamental filters that prefer growth plays with strong earnings, similar to the work of William O Neil and Investor’s Business Daily. However, the indicator’s usage has expanded naturally over the years into a purely technical form of market analysis.
High Low Bands (HLB) are generated from a series of moving averages calculated by evaluating price action over specified time periods, which are then shifted higher or lower by a fixed percentage of the median price. Indicator calculation requires setting the specific period and appropriate shift percentage. The ‘right’ settings are market specific and need to match volatility characteristics for the chosen security or trading venue.
The indicator applies triangular moving averages instead of simple or exponential moving averages. This is a double-smoothed average, or an average of an average, that irons out suspected outliers from the final calculation. As a result, bands are smoother than similar indicators that track fast moving market activity and are less useful for many short-term trading strategies. However, HLB can generate extremely reliable high and low predictions in rangebound markets.
Developed by Donald Dorsey in the 1990s, Mass Index evaluates the range between the high and low of a security over a specified time period. Reversal signals with this indicator are generated when a range expands to a subjective extreme and then reverses into contraction. However, the technician may also need to examine momentum, volatility, and trend-following indicators to determine the overall trend direction that will be impacted by the reversal signal.
The classic setting uses a 9-day (or period) exponential moving average (EMA) of the range between the high and low price over the last 25 days. The initial output is then divided by a 9-day EMA of the 9-day EMA used for the initial calculation. In the original usage, an indicator value that surges above 27 and drops to 26.5 issues a reversal signal. However, in modern usage, the technician needs to identify signal levels that are appropriate for the currently traded markets and securities, which can differ greatly from Dorsey’s original observations.
Pivot Points determine range and trend intensity in different time frames. The first level of the indicator is calculated by adding the high and low of the current bar to the closing price of the prior bar, and dividing by three. Price action in the next bar is considered bullish when above the pivot point and bearish when below the pivot point. This observation has limited value so the calculation adds support and resistance levels, notated as S1, S2, R1, and R2, based upon projections from the pivot point value.
Price movement above support or below resistance signifies a strengthening uptrend or downtrend while reversals within support (S1 or S2) and resistance (R 1 or R2) boundaries define the quality of rangebound markets, at least within the time frame used in the price chart. These five levels can also be used to identify appropriate trade entry levels, place stop losses and trailing stops, and to locate high odds trade exit levels.
Anchored VWAP – attempts to identify the average price of a security over a time period chosen by the technician.
ATR Bands – are drawn around the average true range indicator to identify potential turning points and whether price is engaged in an uptrend, downtrend, or a trading range.
ATR Trailing Stops – identifies optimized stop levels using multiples of average true range indicator output.
Detrended Price Oscillator – seeks to measure the length of price cycles from peak to peak or trough to trough.
Gopalakrishnan Range Index – quantifies price movement and asset volatility by studying the asset’s trading range over a specified time period.
High Minus Low – subtracts the daily (or bar) high from the daily (or bar) low to determine average price movement over a specified time period
Highest High Value – measures the highest high over a specified time period.
Lowest Low Value – measures the lowest low over a specified time period.
Median Price – measures the most common price over a specified time period.
True Range – displays a derivative of the trading range by removing the impact of gaps and volatility between price bars.
Vortex Indicator – separates uptrends and downtrends into two continuous lines that reveal relative bull and bear power over time.
VWAP – attempts to identify the average price for a security over the entire session.
Alan Farley is the best-selling author of ‘The Master Swing Trader’ and market professional since the 1990s, with expertise in balance sheets, technical analysis, price action (tape reading), and broker performance.