


200-Day Support Comes Under Pressure
Alphabet Inc. (GOOG), the parent company of Google and a global technology leader, is at risk of further downside if it fails to hold a key support zone on the daily chart that is currently being tested. The 200-day moving average is a key trend indicator that has represented dynamic support for the bullish trend in GOOG since it was reclaimed in June 2025. It failed as support briefly during the prior decline to a low of $314.89, which also completed a 61.8% Fibonacci retracement of the prior advance.
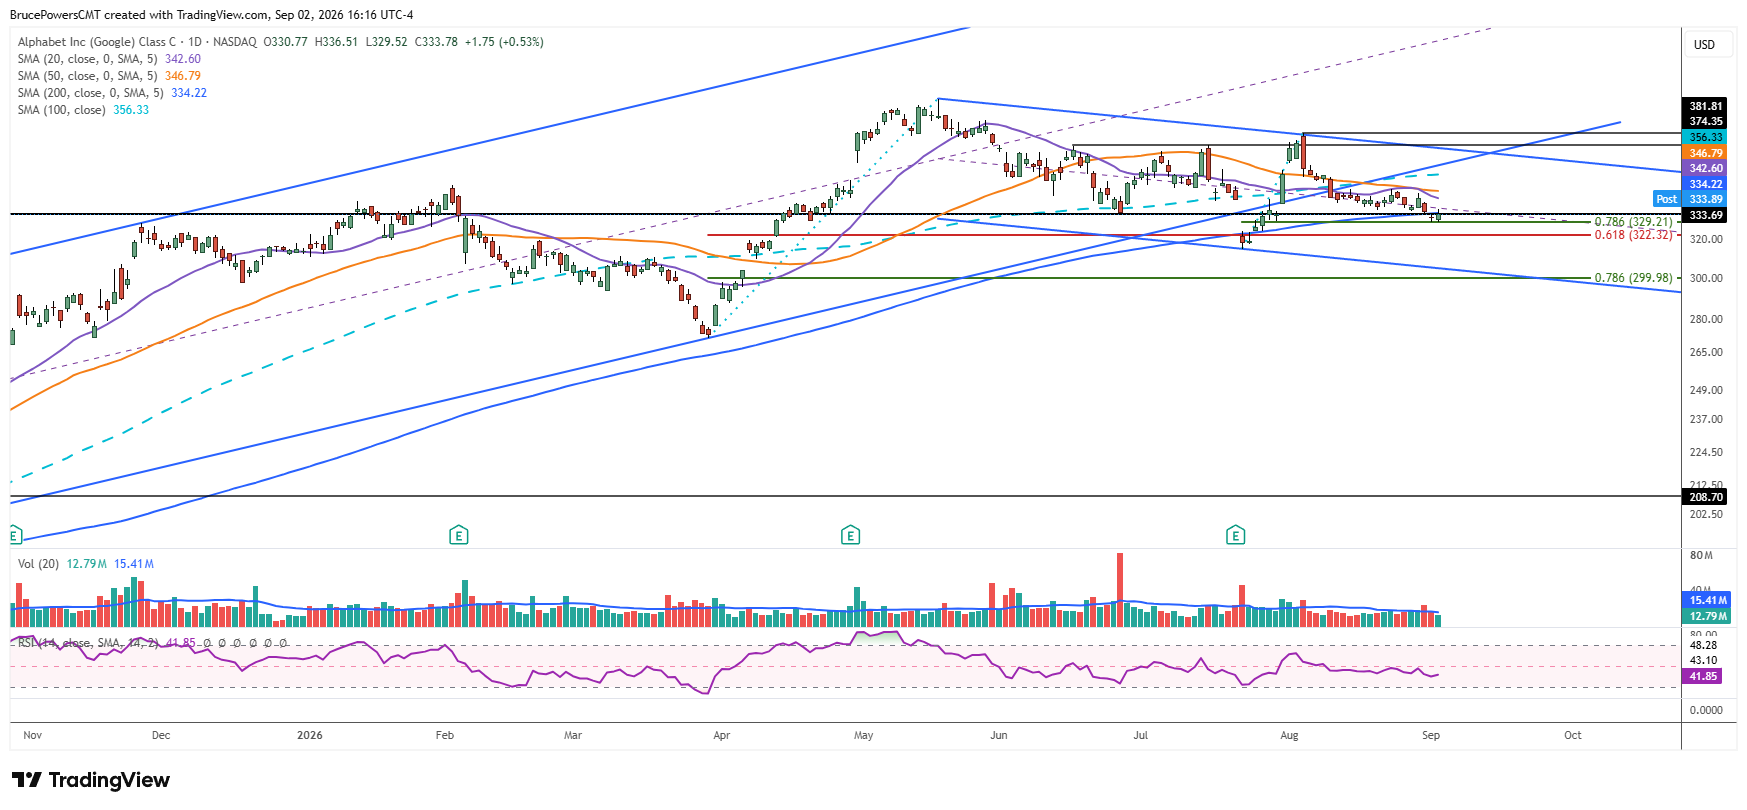
During that correction there were two days that traded below the average before it was reclaimed, followed by a sharp advance to a high of $381.81. Underlying strength was indicated by the fact that a resistance shelf near $374.34 was surpassed during the advance. That $381.81 high is now a key lower swing high for the corrective structure that followed the peak in May at $404.47.
Another Test Could Shift the Structure
The last two days have also seen GOOG trade largely below the 200-day moving average. If GOOG continues to trade below that average for a third day, the prior pattern will be broken and reflect continued downward pressure. This puts it in a vulnerable position if this week’s low of $329.29 is broken to the downside. This week’s low completed a 78.6% Fibonacci retracement of the prior advance, which adds to the bearish evidence if it fails to hold.
Weekly Support Offers a Potential Floor
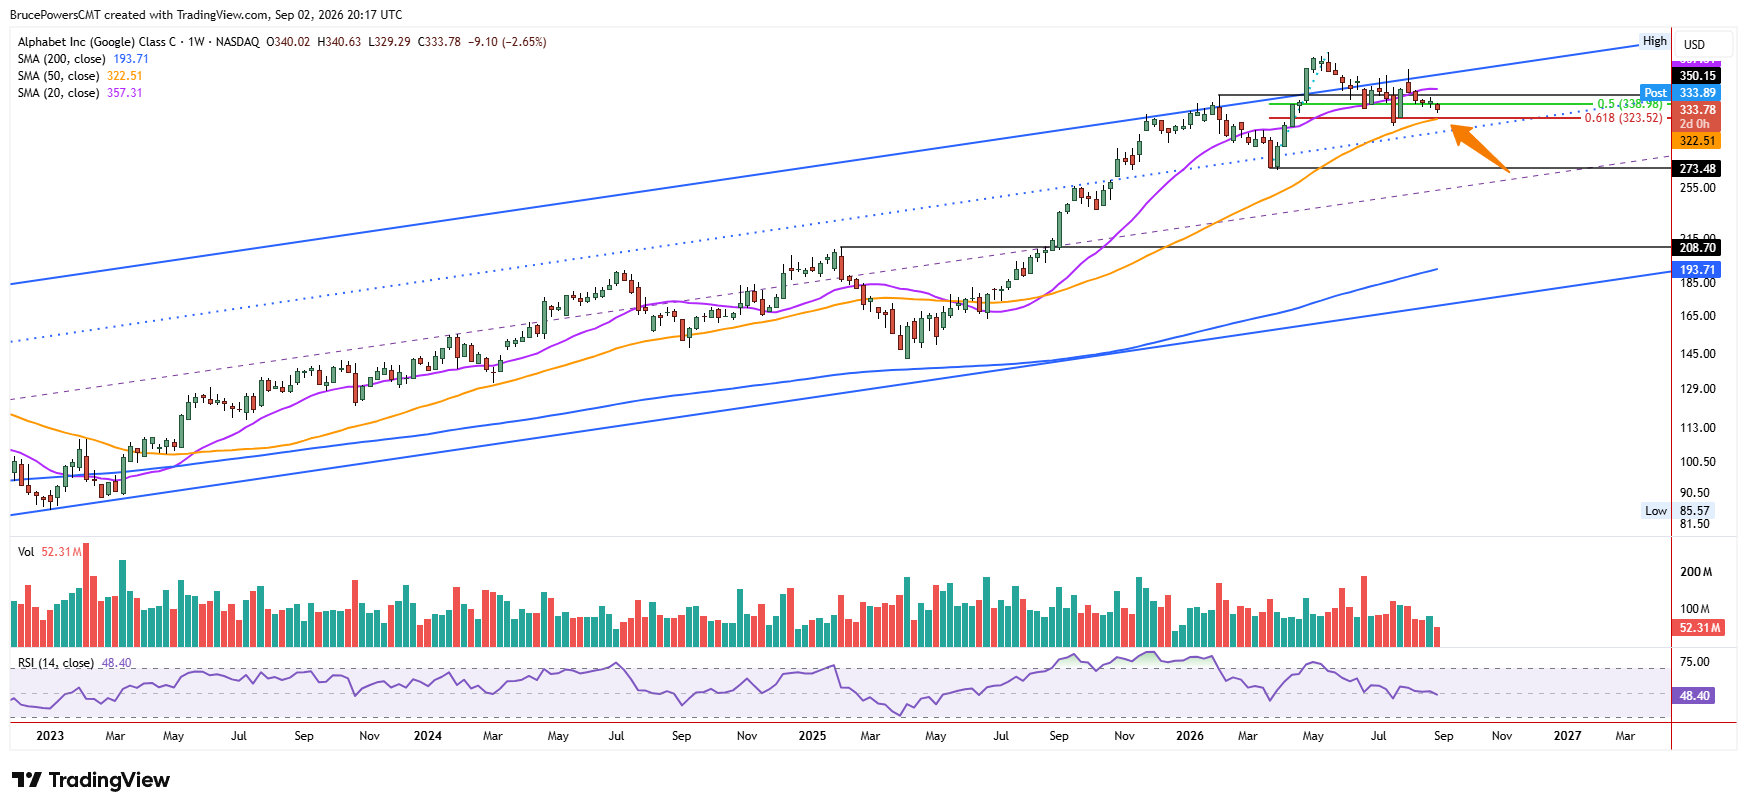
Despite the bearish implications on the daily, the weekly chart shows GOOG approaching a potential test of support near the 50-week moving average, now near $322.50. It is now close to aligning with the 61.8% Fibonacci retracement level at $323.52, adding to its significance. Since the 50-week moving average has not been tested specifically as support since it was reclaimed in June 2025, there is a chance it may be before the larger bearish correction in GOOG is complete.
Reclaim Could Restore Bullish Momentum
Alternatively, a reclaim of the 200-day moving average, currently near $334.22, before new lows would be bullish and may lead to a higher swing low. That would add to the technical evidence for a possible continuation toward the top downtrend line. A rally above Wednesday’s high of $336.51 would provide a bullish signal and a reclaim of the 200-day average.
If you’d like to know more about technical analysis and how traders use it, please visit our educational area.