Shakeout Completes at $4,283
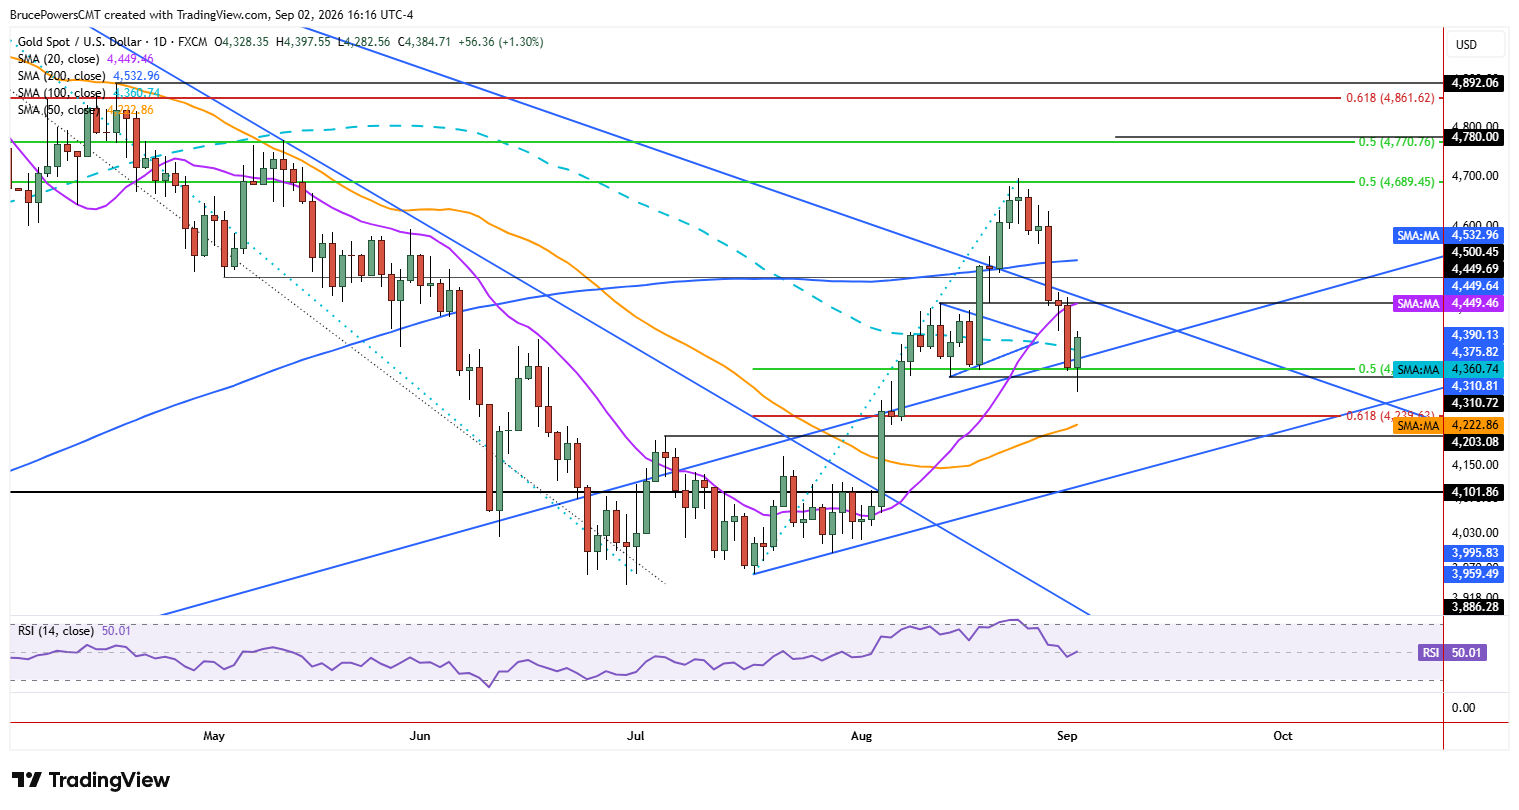
Gold’s drop to $4,283 on Wednesday looked like another leg of the correction until buyers recaptured the levels that had just broken. An intraday advance recovered the 100-day moving average, the long-term uptrend line, and the 50% retracement of the prior advance, levels that provided bearish technical signals on the way down. A one-day bullish recovery may have established a low for now and could lead to a continuation of strength toward higher resistance. Given how quickly several prior support levels were recaptured, it looks as if stops were hit and cleared the way for a counter-trend rally.

Old Uptrend Line Gets Another Vote
Starting with Wednesday’s initial decline, gold broke below the 100-day moving average, a long-term uptrend line, the 50% retracement of the prior full advance, and a higher swing low at $4,311, which had been key support for the prior rising trend structure. Support near the uptrend line is significant. That line was recovered in early August after gold fell below it in late June. If it now holds as support rather than resistance and is followed by strength, the first pullback after the earlier bullish reversal of the prior downtrend may be complete. That still depends on follow-through.
First Ceiling, Then 200-Day Verdict
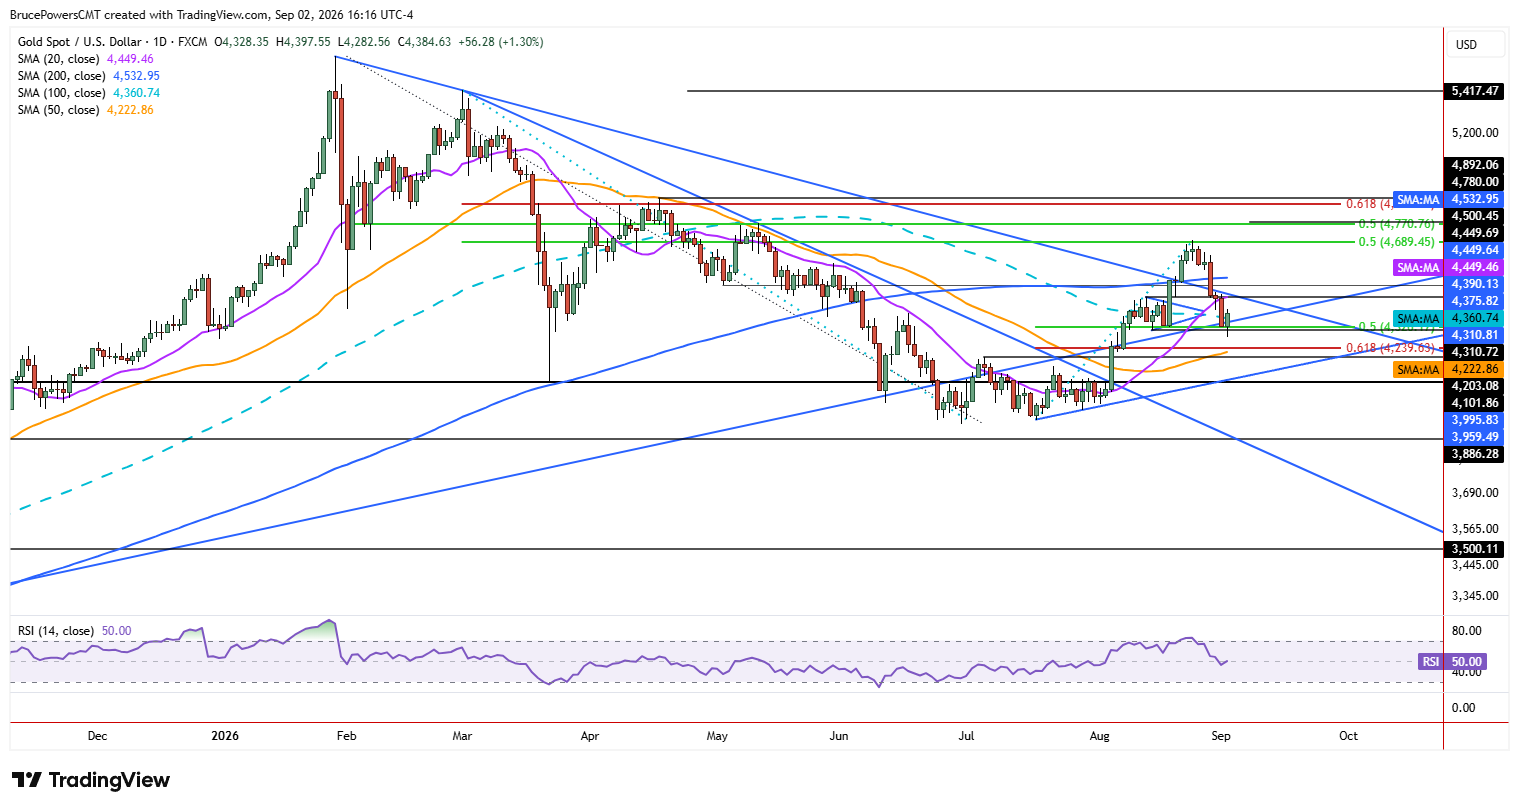
If the session high at $4,398 is broken to the upside, Wednesday’s low becomes a key support level. Tuesday’s high of $4,464 can then be used as an initial upside target zone, since it is joined by a prior swing high at $4,450 and the 20-day moving average near $4,449. A downtrend line nearby adds to the cluster. Together, this confluence of potential resistance is the zone that must be recovered before gold can go higher. For now, Monday’s high of $4,472 can be used as a proxy for the top of the resistance zone.
How gold behaves from there will tell the next step. A decisive upside break above $4,472 would get gold back above the downtrend line and the 20-day moving average. Then it must contend with resistance near the 200-day moving average, currently at $4,533. The recent rally failed to hold above the 200-day moving average, which makes that area a more significant resistance zone and a bullish signal for the larger trend if it is reclaimed. The buyers who reversed Wednesday’s breakdown would then be testing the level that shows whether the larger uptrend is back in control.
If you’d like to know more about how to trade gold and silver, please visit our educational area.