EUR/USD Technical Analysis
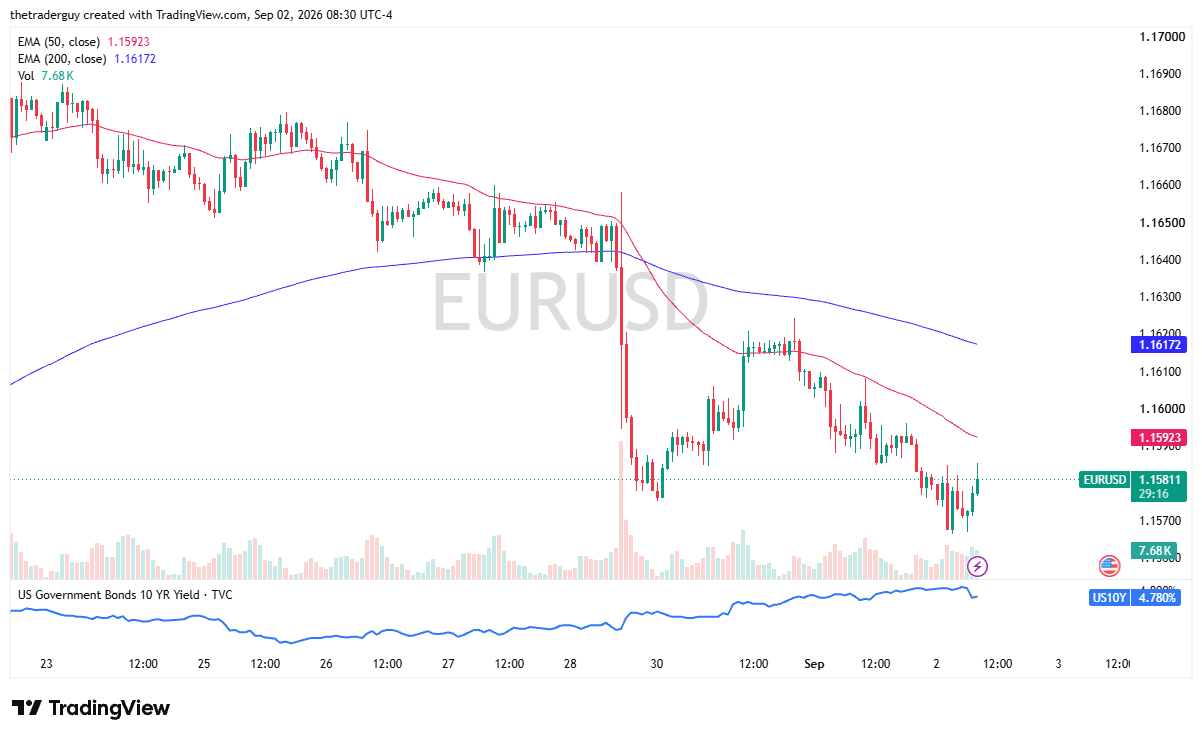
The euro has been pretty negative in the early part of the session, but we are starting to turn things around a little bit here as we head into the US session. With this, I think we have to look at this as a market that may try to recover a little bit.
With interest rates in America drifting lower, I’m still going to watch the 1.16 level. I think that’s an area that could end up being a little bit of a barrier. I still prefer the US dollar over the euro. A nice bounce here, signs of exhaustion, would be a classic continuation play.

USD/CAD Technical Analysis
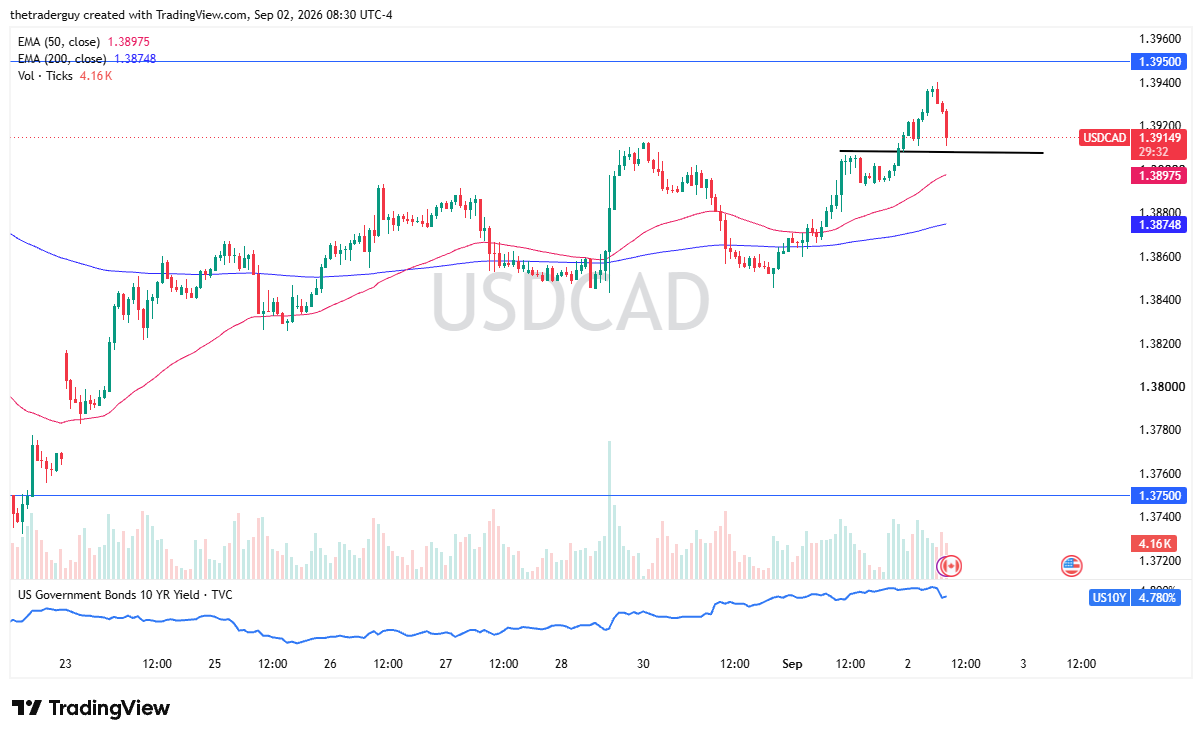
The US dollar has been strong against the Canadian dollar, and I think that probably continues. So, I’ll be watching the 1.3910 level for a potential bounce that I can take advantage of.
In this environment, the trade war between the United States and America continues to be a major factor. Plus, we have to keep in mind that both of these countries release their jobs numbers on Friday, so we could get a little bit of a wiggle here. I plan on taking advantage of it.
USD/CHF Technical Analysis
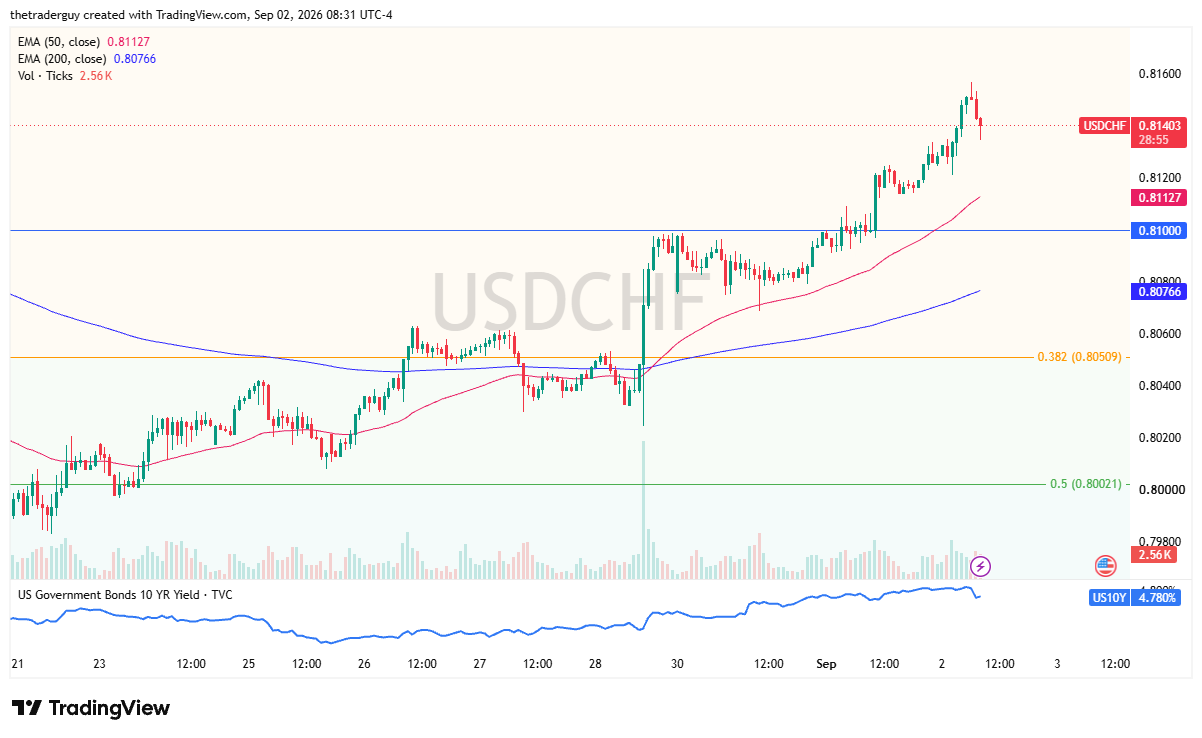
In the US dollar against the Swiss franc pair, this has been a long-term holding of mine for some time. I think we have a situation here where traders will continue to look at this as a buy-on-the-dip scenario right around 0.8120 and 0.81. Both areas I’m looking to buy some type of bounce if I get the opportunity. The 0.8160 level above is short-term resistance that, if broken, could get a bit of FOMO trading in this pair for short-term traders to join the trend.
If you’d like to know more about how to trade forex, please visit our educational area.