Gold Bounced From a Three-Week Low and the Rate Trade Did Not Flinch
Gold found buyers Wednesday after dropping to $4,282.62, its lowest level in more than three weeks. The recovery reached $4,336.90. The dollar stayed firm. Treasury yields stayed near multiyear highs. September rate hike odds stayed near 68%. Crude held above $90 WTI and near $95 Brent. Everything that drove the metal lower since Friday is still sitting on the market. The bounce came from the level, not from a change in the trade.
At 12:51 GMT, Spot Gold (XAUUSD) is trading at $4,336.90, up $8.49 or 0.20%.

The 10-Year Pulled Back From 4.814% and Gold Got a Bounce
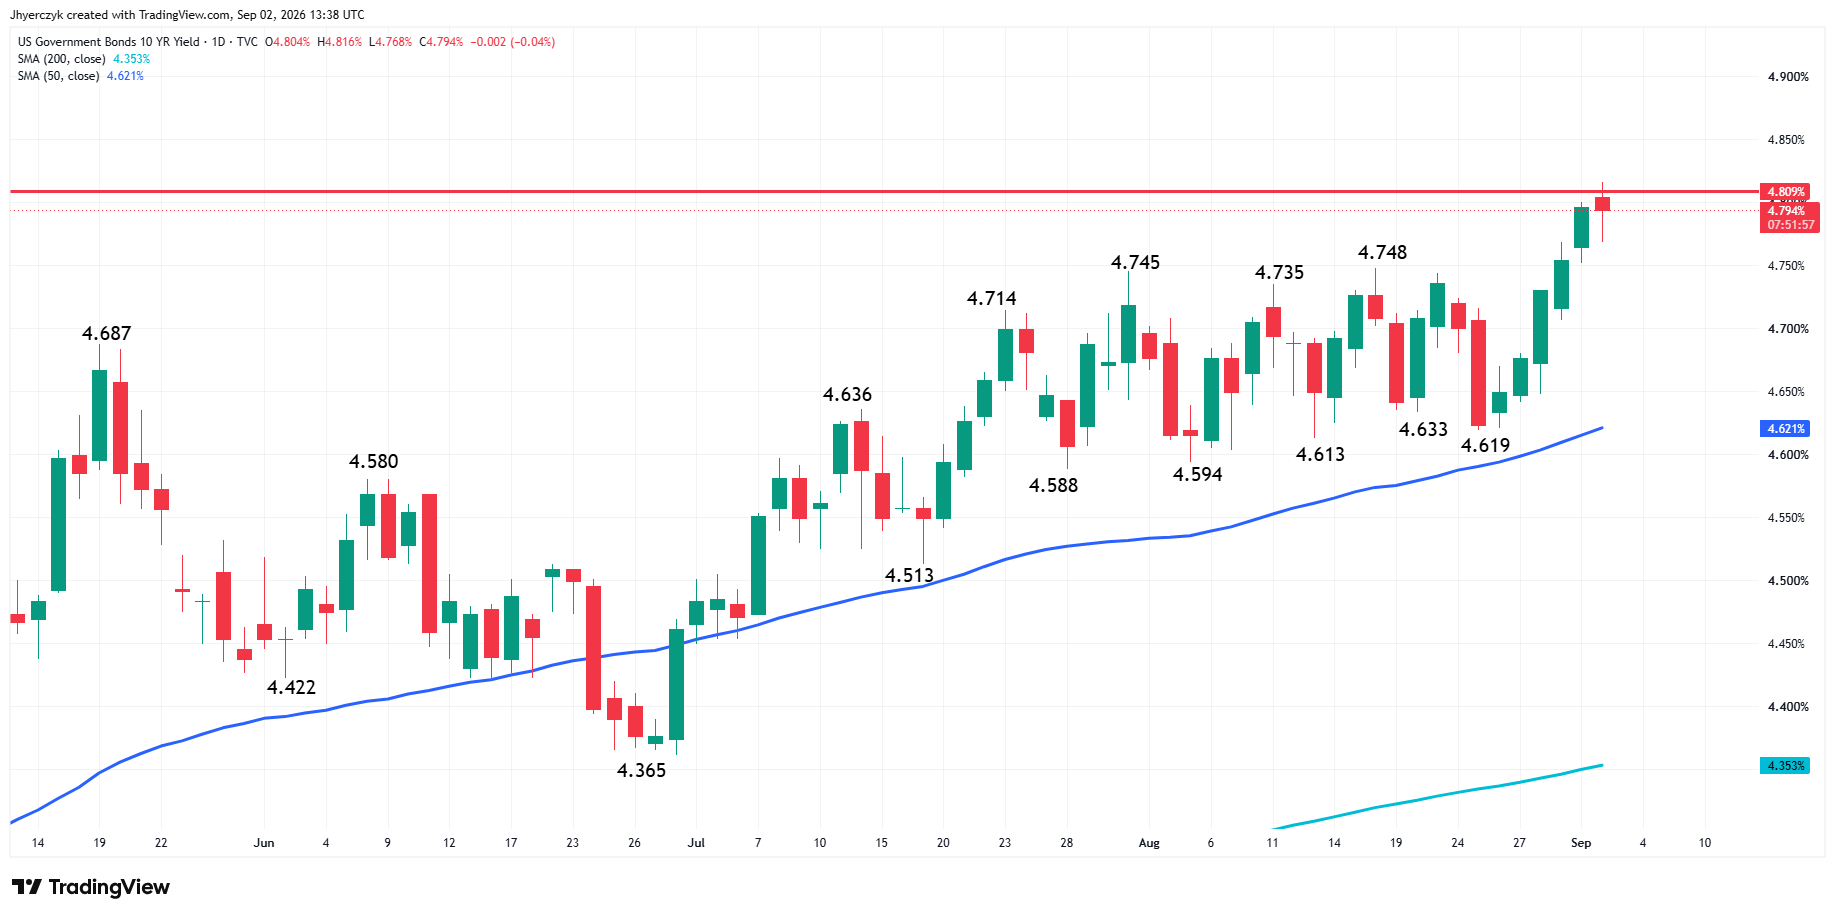
The 10-year Treasury yield reached 4.814% Wednesday, the highest since November 2023. It later eased to 4.776%, down more than two basis points on the day. The 30-year slipped to 5.247%. The 2-year eased to 4.377%.
Gold recovered from the morning low on that pullback. The 10-year is still near 4.8%. The 2-year is still near 4.4%. Japan’s 10-year is near 3%. U.K. gilts are at financial crisis levels. Government borrowing costs are rising across every major market. The yield pullback Wednesday was intraday, not directional. Gold got room to bounce. It did not get a reason to rally.
The Dollar Is Still Getting the Safety Bid Gold Wants
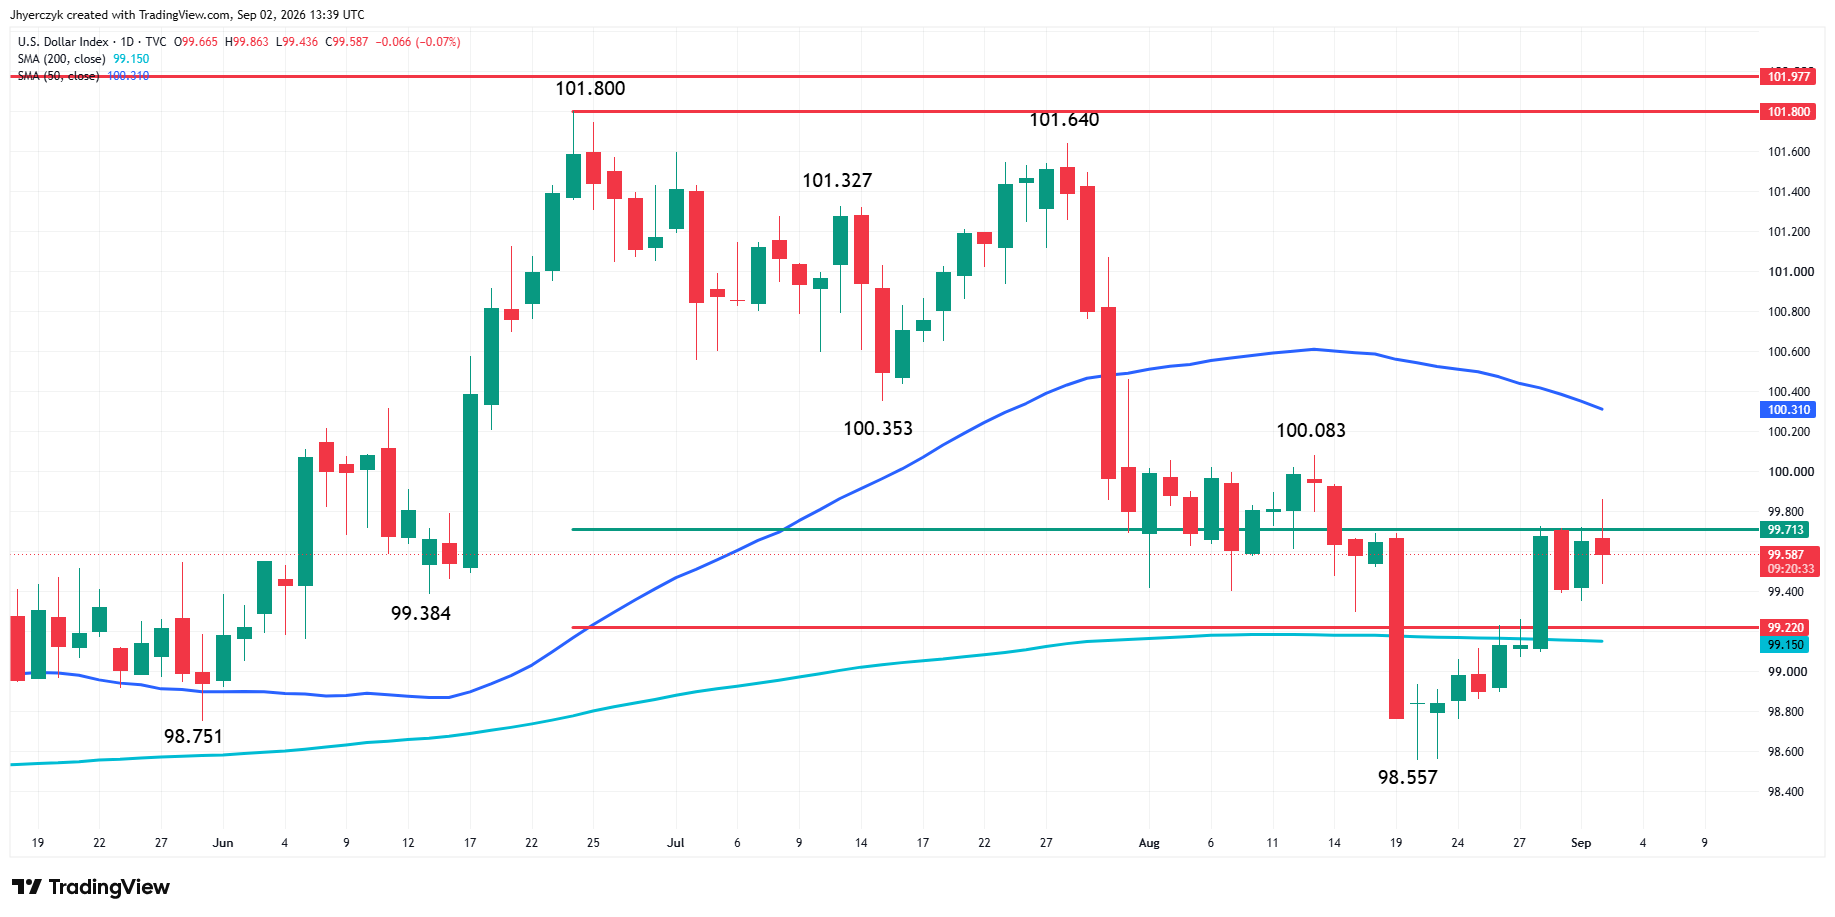
The dollar index held near 99.67 Wednesday after reaching a two-week high. The euro and sterling stayed weak. The yen was trading near 160.21 per dollar, still on the weak side of the level Japanese officials have been watching.
The United States and Iran exchanged their largest round of fire since July. Washington struck Iranian targets. Tehran retaliated. Oil moved higher on the supply risk. Those are headlines that normally give gold a reason to catch a bid. Wednesday the dollar took the safety flows instead. The metal found buyers at $4,282.62 but it did not take back the ground lost to the stronger currency.
Gold Price Forecast
Every new Gold analysis as it publishes, today's technical signal and key levels, live price — on one page.
See all Gold forecastsU.S. Treasury Secretary Scott Bessent pushed Japan for more decisive action against yen weakness. The Bank of Japan is expected to consider another rate hike this month. The yen is still above 160. Until it holds a stronger bid, the dollar has less competition for safety flows and gold keeps losing that trade.
Crude Above $90 Is Still Working Against the Metal
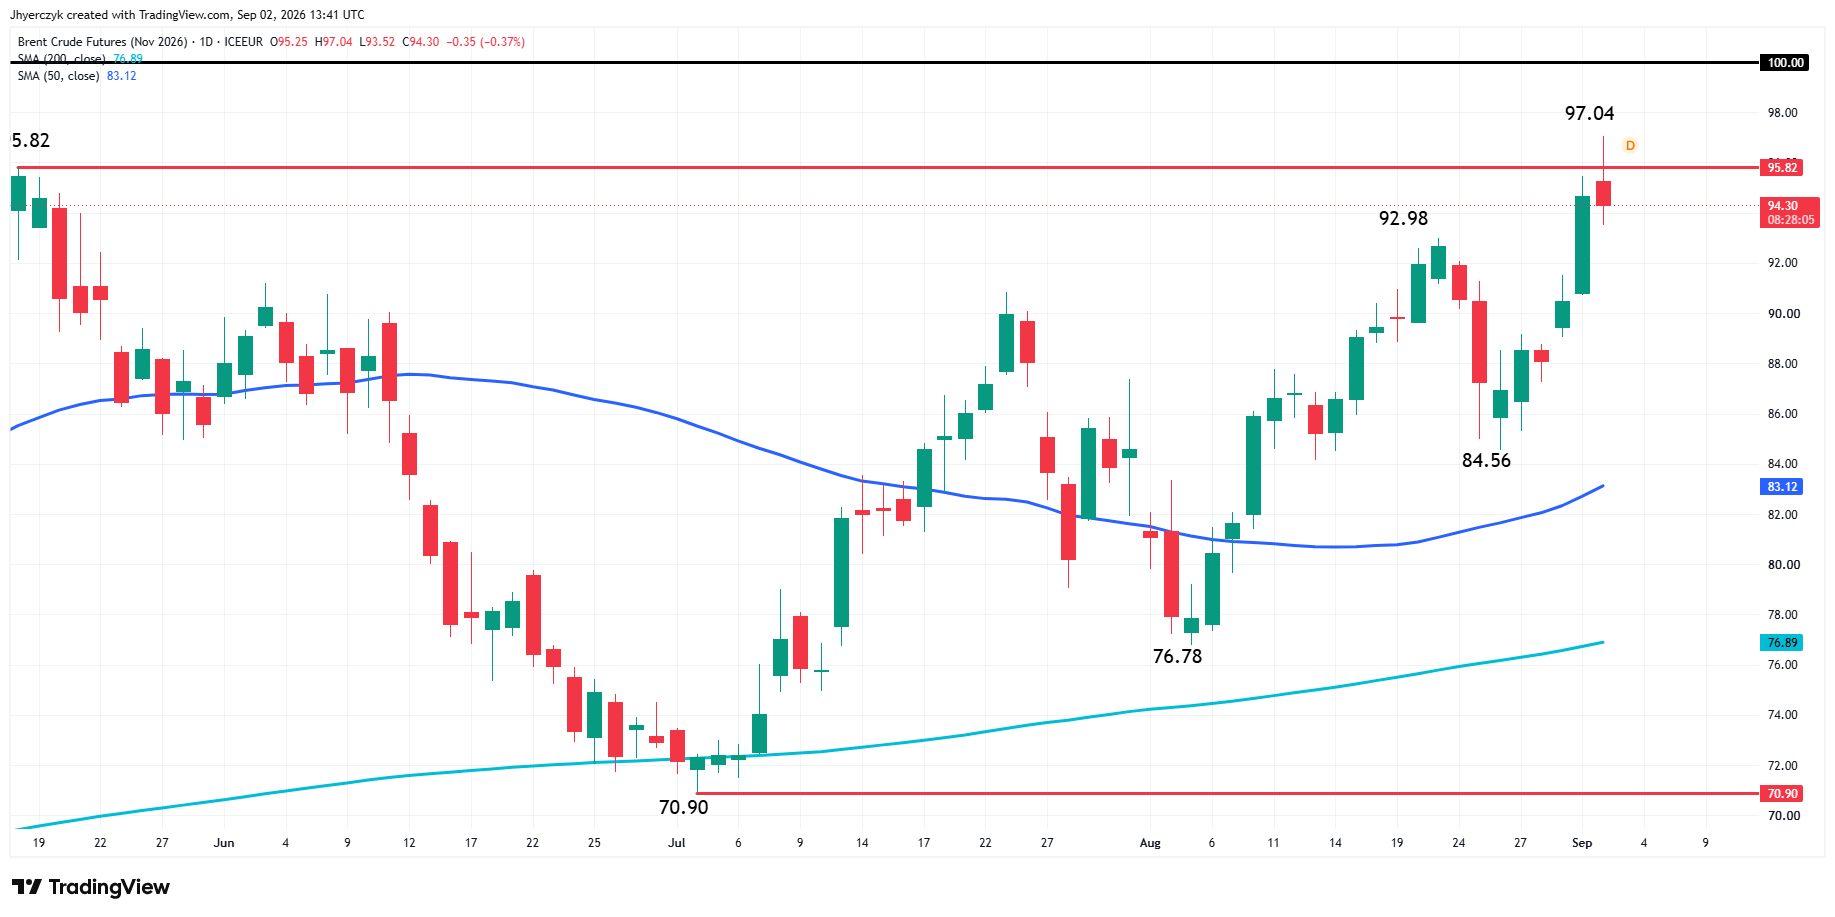
Brent was near $95.52 in early Wednesday trading. WTI was near $91.02. The latest U.S.-Iran strikes and retaliation put the supply risk back into crude and it has not come out.
Silver traders already know what crude above $90 does to the inflation outlook and gold traders are reading the same tape. Warsh said last week the central bank would have more work to do if inflation did not cool toward 2%. Fed Governor Michael Barr followed Tuesday with the same message. Oil above $90 WTI does not give either one a reason to back off.
The conflict is lifting crude. Crude is keeping yields and the dollar firm. Gold is at the end of that chain. The geopolitical bid is on the table and the metal cannot pick it up because the rate response is stronger.
The Data Has Not Cracked the 68% Odds
Tuesday’s ISM manufacturing reading and JOLTS job openings both came in below forecasts. Neither was soft enough to force traders to reduce September rate hike odds. The 68% probability held through both reports.
ADP employment data lands later Wednesday. Friday’s nonfarm payrolls report is the larger test. Economists expect 56,000 jobs added in August. A firm number with stronger wages keeps the 68% where it is. A soft number forces a repricing of September and that is the only thing that gives gold a clean opening from here.
The market has heard from Warsh and Barr this week. The Fed message is set. The data decides whether it holds.
Daily Spot Gold (XAUUSD) Technical Analysis
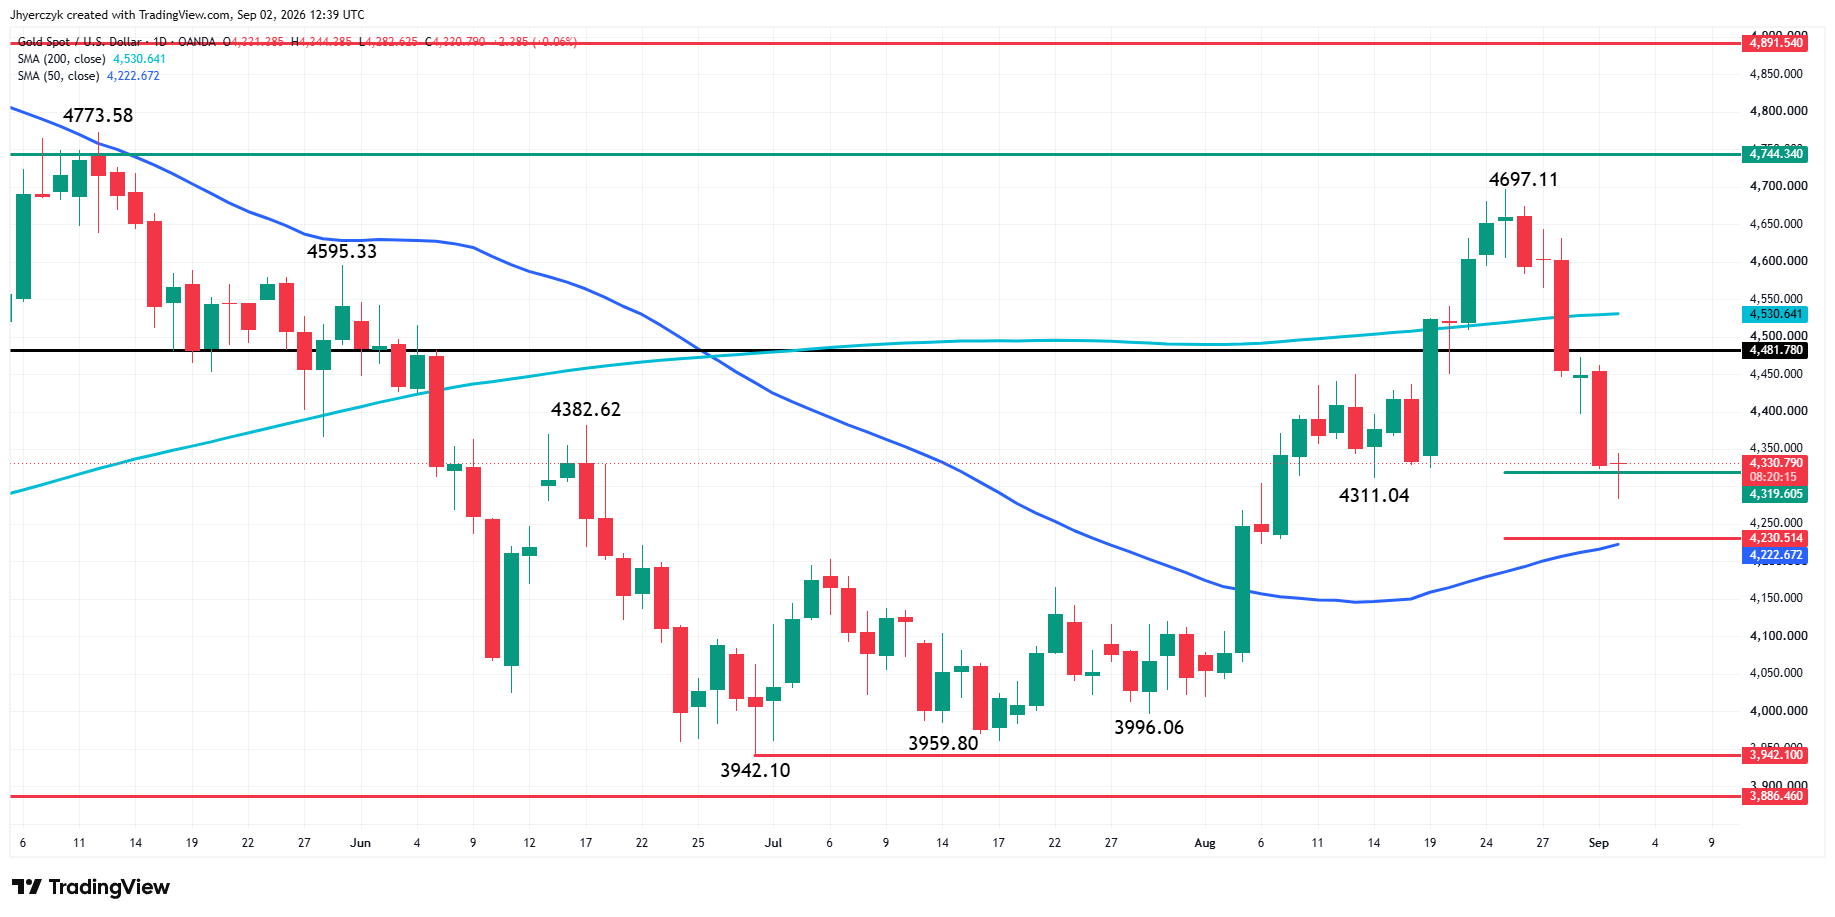
Spot gold is edging higher Wednesday after rebounding from an early session setback. The main trend changed to down earlier today when sellers took out the swing bottom at $4,311.04, but new buyers may have emerged on the test of a key retracement zone.
The long-term range is $3,942.10 to $4,697.11. Its 50% to 61.8% retracement zone is $4,319.60 to $4,230.51. Today’s rebound came from a trade to $4,282.62, which fell inside the zone. To some traders, this is a value zone.
Adding to concerns about heightened volatility is the fact that Spot gold is trading under 200-day moving average resistance at $4,530.71 and nearing 50-day moving average support at $4,222.93.
The early price action suggests trader reaction to the 50% level at $4,319.60 will determine the direction of the market into the close. A sustained move over this level could lead to a strong rally into the close, while failure to hold it would put the $4,230.51 to $4,222.93 support cluster back on the radar.
What to Watch
The rate trade stays pointed against gold until the data changes it. Warsh and Barr both said this week the Fed has more work to do. The 10-year pulled back from 4.814% but is still near a multiyear high. The dollar index is at 99.67. Crude is above $90 WTI and near $95 Brent. The geopolitical bid from the Middle East conflict is going to the dollar, not the metal. Friday’s payrolls report at 56,000 expected is the number that can either keep the 68% September odds in place or force a repricing. The rate pressure holds until a soft jobs number gives buyers a reason to step back in.
Gold bounced from $4,282.62 inside the long-term retracement zone at $4,319.60 to $4,230.51. The main trend turned down Wednesday when sellers took out $4,311.04. The 200-day moving average at $4,530.71 is resistance above. The trade stays bearish while gold sits under $4,319.60. A close above that level is the first sign value buyers are taking over. A break through the 50-day at $4,222.93 opens the support cluster down to $3,942.10. The 200-day break from Friday is still the damage running this market. Wednesday’s bounce has not undone it.
If you’d like to know more about how to trade gold, please visit our educational area.