Bitcoin (BTC) is facing renewed selling pressure after hotter-than-expected US Consumer Price Index (CPI) data reignited fears of persistent macroeconomic inflation.

US Inflation Report Triggers Macro Headwinds for Crypto
Bitcoin dipped by over 1% shortly after the US Consumer Price Index (CPI) data’s release on Wednesday.
The report delivered a hotter-than-expected inflation print, reigniting hawkish fears across global financial markets. Headline CPI accelerated to 3.6% year-over-year (YoY), up from 3.4% previously, and rose 0.6% month-over-month (MoM), driven largely by a 9.1% surge in gasoline prices.
Meanwhile, Core CPI (excluding food and energy) held sticky at 2.6% YoY.
Following the report, market expectations for Federal Reserve monetary policy shifted rapidly:
Bitcoin Price Forecast
Every new Bitcoin analysis as it publishes, today's technical signal and key levels, live price — on one page.
See all Bitcoin forecasts-
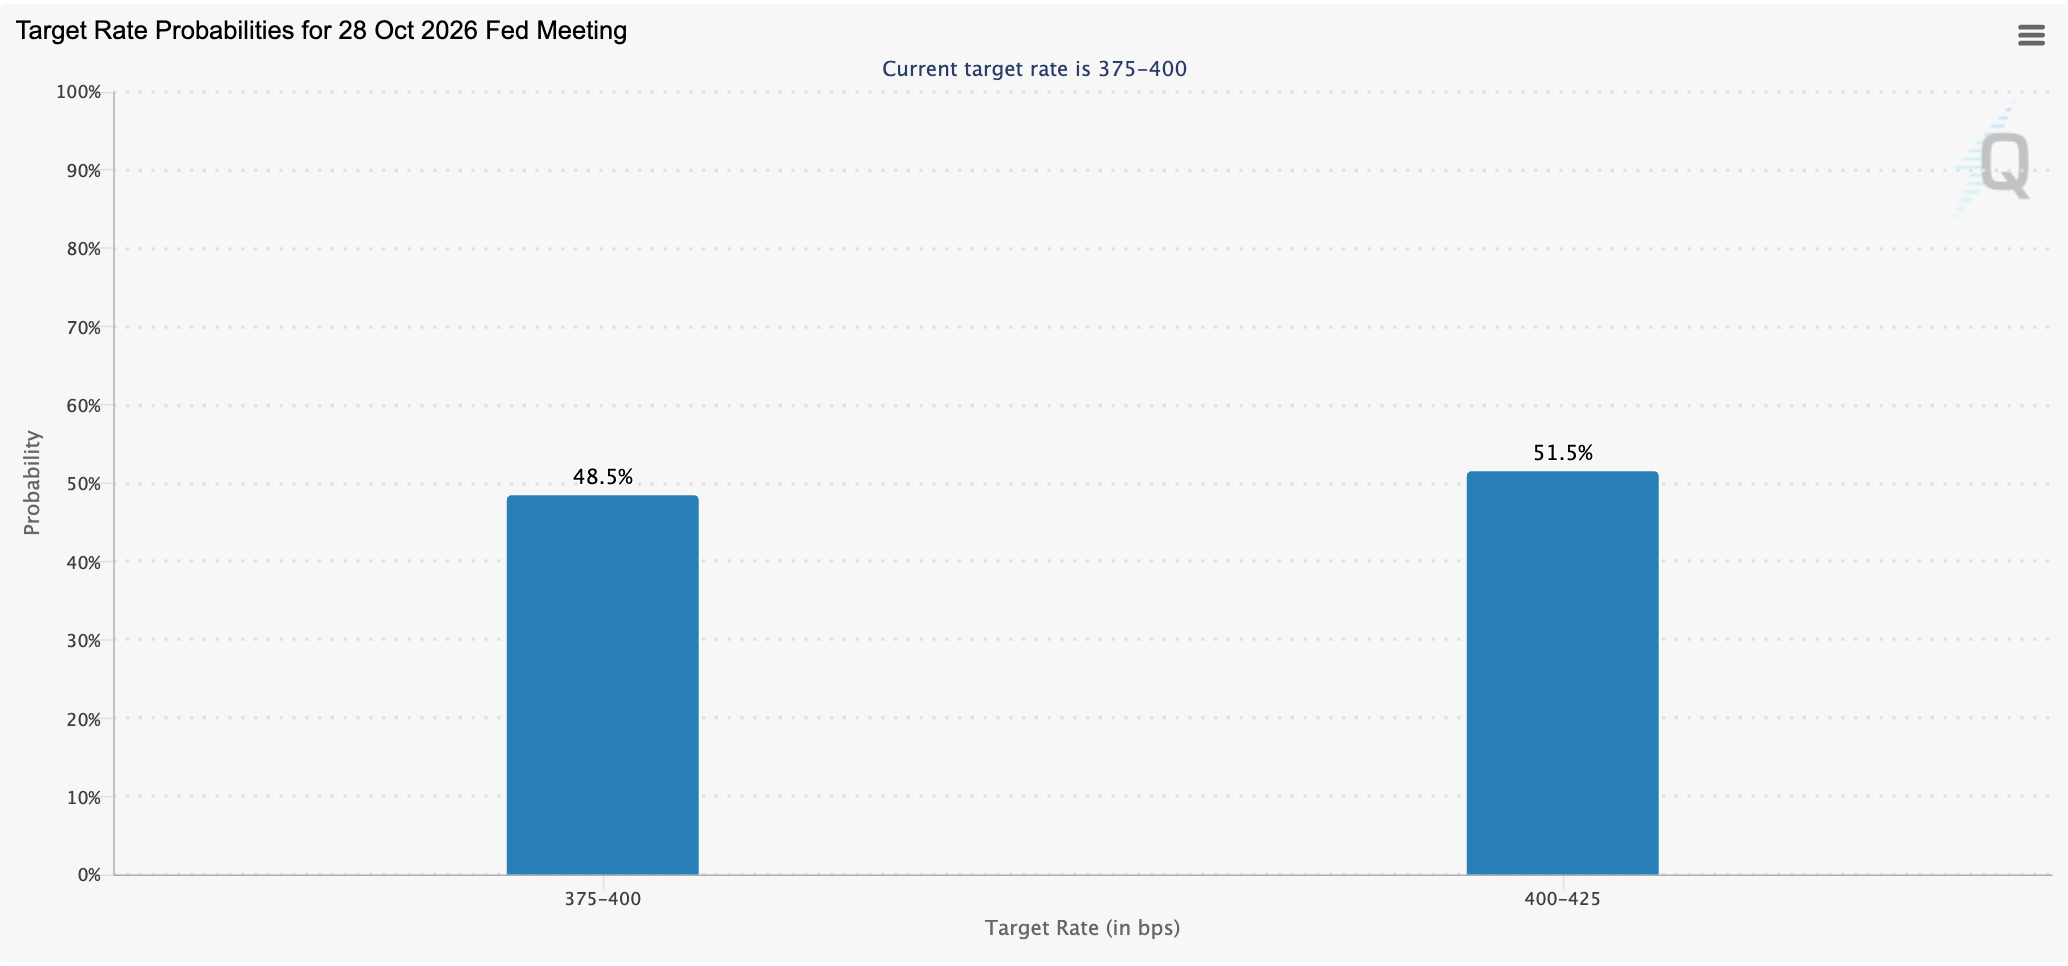
CME FedWatch Rate Hike Odds Spike: According to the CME FedWatch Tool, traders rapidly repriced interest rate expectations, pushing the probability of a 25-basis-point rate hike at the upcoming October 28 FOMC meeting to over 50%, up from just ~20% earlier in the week.
-
Rate Cut Hopes Evaporate: The odds of Fed interest rate cuts before year-end have plunged, turning the next monetary policy decision into a near coin-flip between a pause and an active rate hike.
-
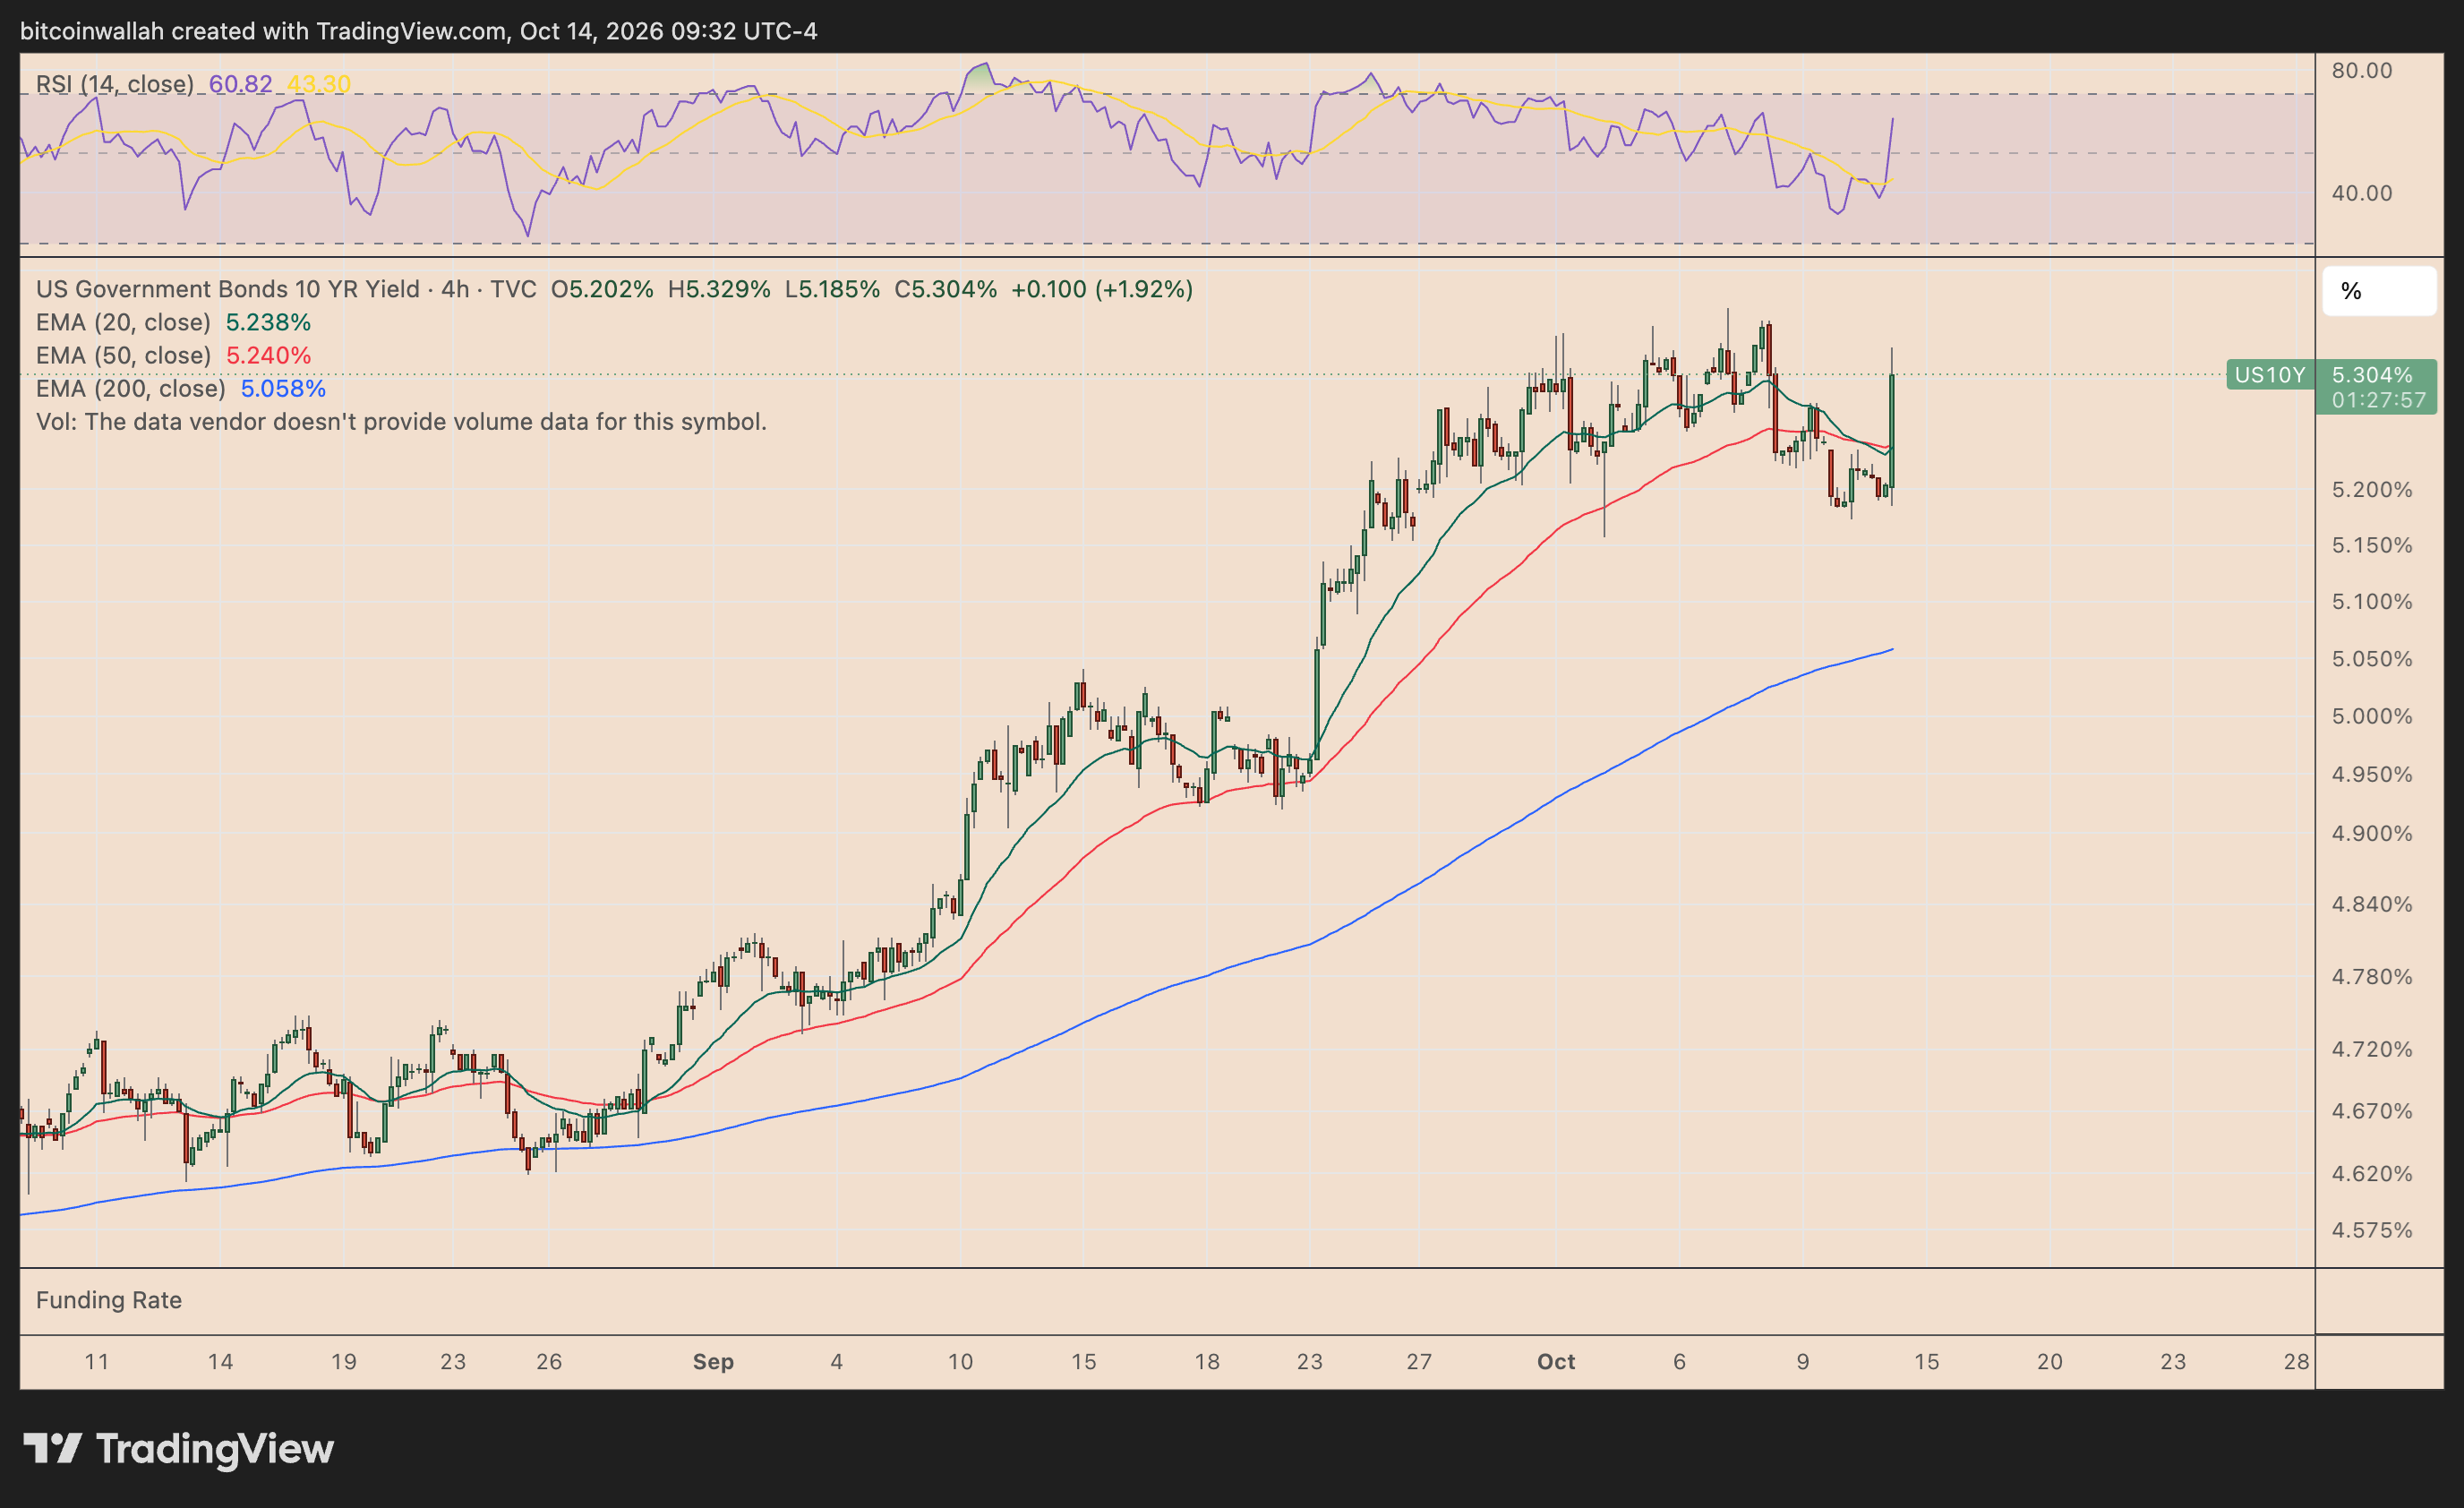
Yields & Dollar Surge: U.S. 10-year Treasury yields firmed, and the US Dollar Index (DXY) strengthened, draining liquidity from high-risk assets like cryptocurrencies.
Bear Flag Breakdown Points to $78.2K
The 4-hour BTC/USDT perpetual chart displays a textbook bearish continuation setup. Following an initial impulse decline from the $86,000 local peak down to $81,000, price action consolidated within a narrow, upward-sloping channel. This structural behavior forms a clear bear flag pattern.
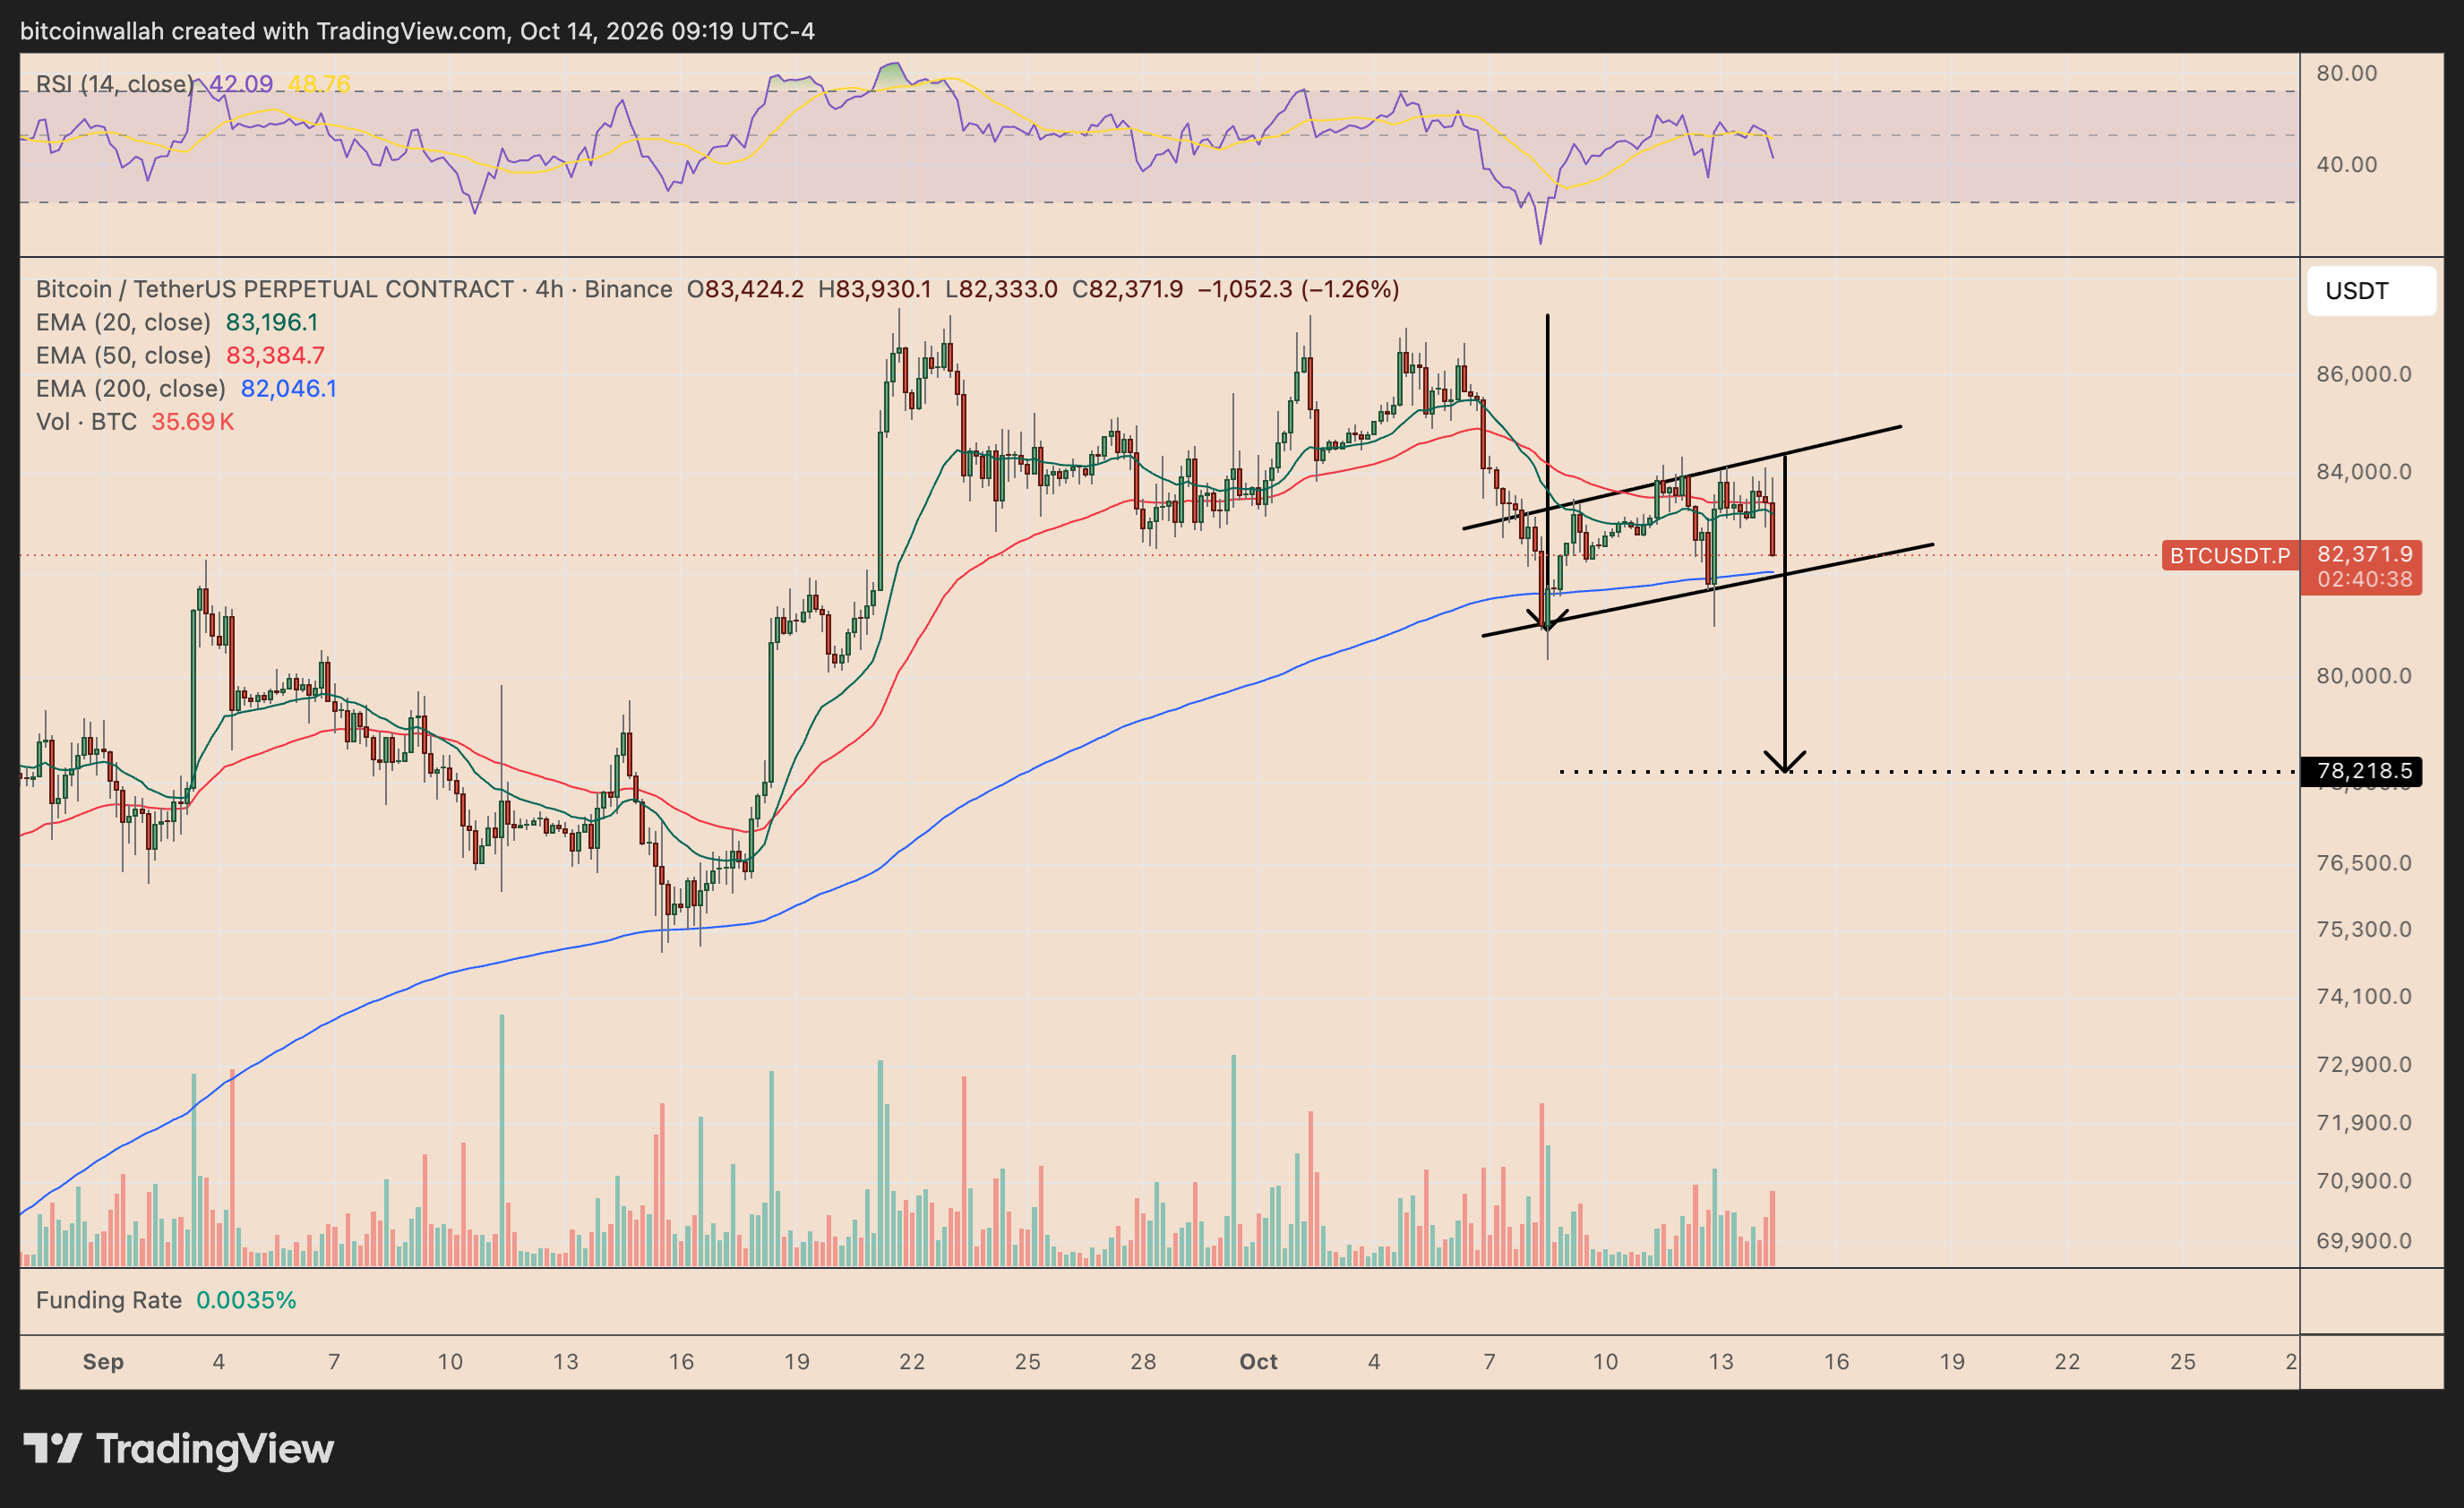
Currently, Bitcoin is attempting to break below the lower boundary of this channel near $82,371:
-
Dynamic Resistance Clustered Above: BTC remains trapped beneath its 20-period Exponential Moving Average (20 EMA at $83,196) and 50-period EMA (50 EMA at $83,384). Rejection at these moving averages reinforces the prevailing short-term downtrend.
200 EMA Under Threat: Sellers are testing the crucial 200 EMA at $82,046. A sustained 4-hour close below this long-term trendline would confirm the flag breakdown.
Subdued RSI Momentum: The 14-period Relative Strength Index (RSI) sits at 42.09, pointing downward and indicating that sellers maintain control without reaching oversold conditions.
Positioning Risk: The perpetual funding rate stands at a modest 0.0035%. A breach of key support risks unwinding leveraged long positions, speeding up a move lower.
Calculating the measured move by projecting the length of the flag pole downward from the breakdown level outlines a technical target near $78,218.5—well below the $80,000 mark.
Primary Levels to Watch
-
Critical Support ($82,046 & $80,000): Holding the 200 EMA at $82,046 is vital for bulls. Failing here opens the gate to psychological support at $80,000 and the pattern target at $78,218.
-
Bullish Invalidation ($83,400+): To void the bear flag breakdown, buyers must reclaim the 50 EMA ($83,384) and push above $84,000. A daily close above $84,000 would shift focus back toward $86,000.
If inflation-driven risk aversion continues to weigh on broader markets, Bitcoin remains vulnerable to testing sub-$80,000 liquidity zones in the near term.