NEAR Protocol (NEAR) could decline nearly 20% toward $4 in the coming sessions as a bearish technical pattern signals weakening upside momentum following its recent rally.
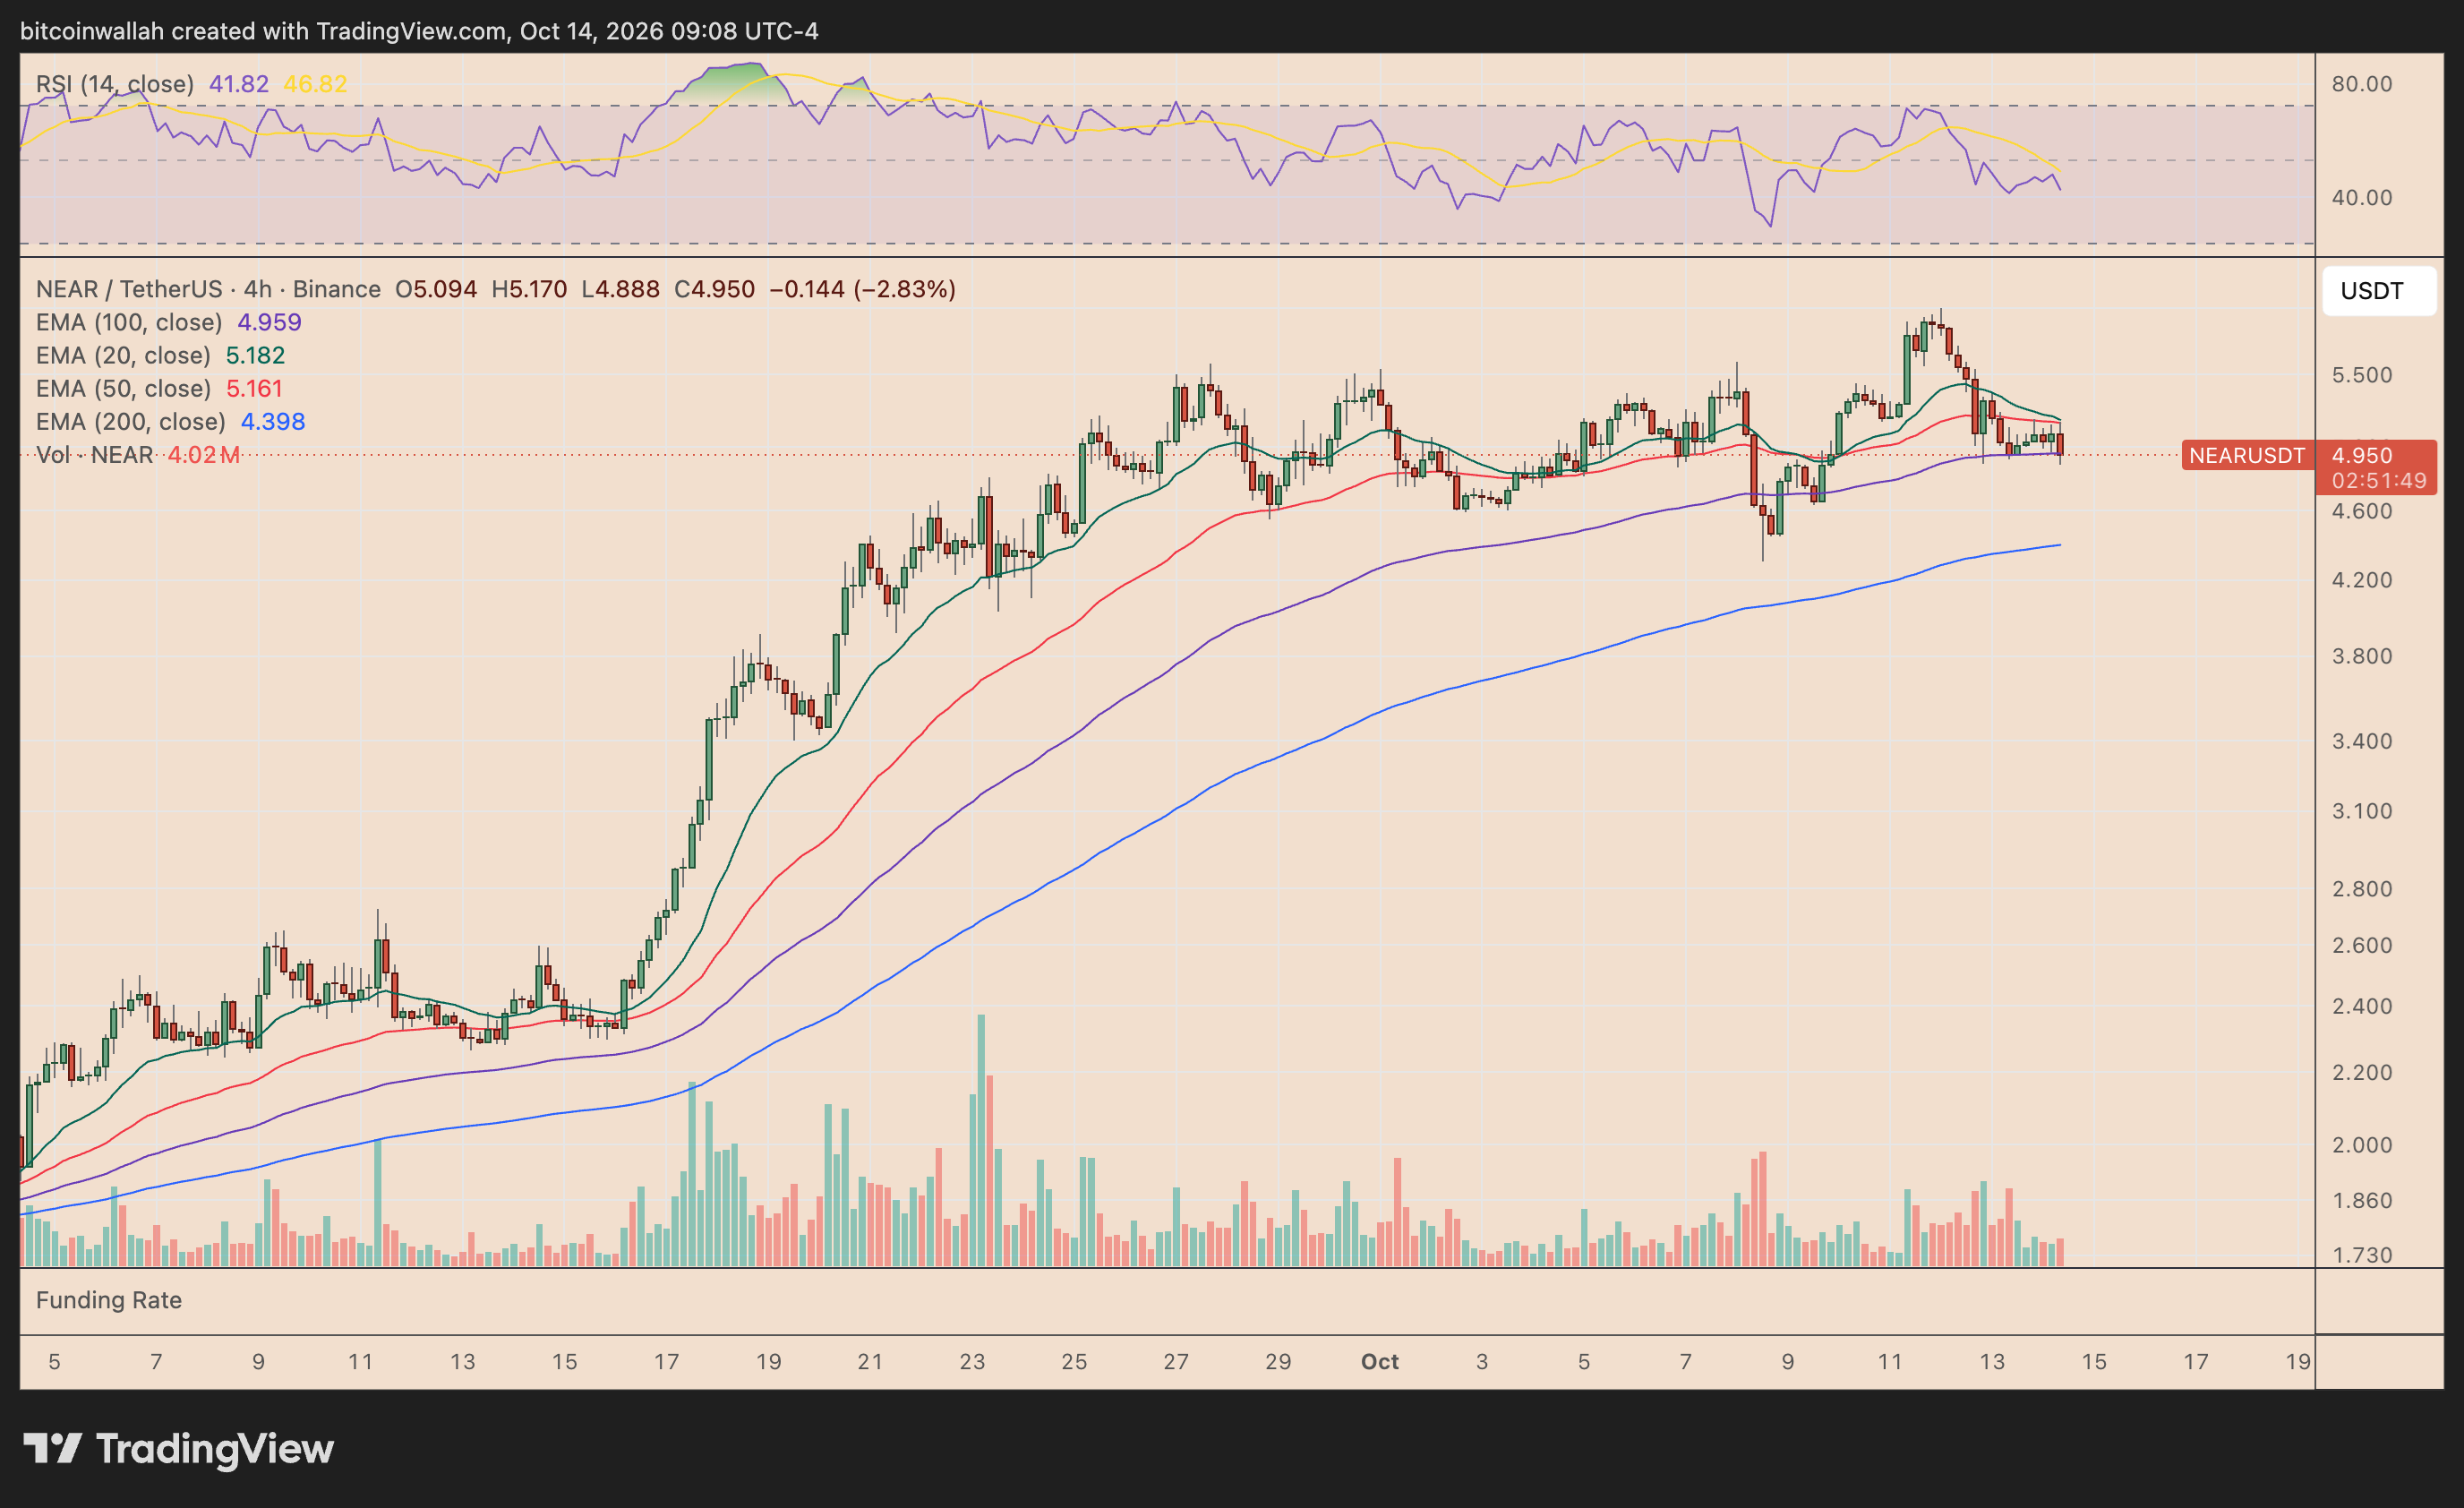
The token was trading near $5.00 on Oct. 14, consolidating after a sharp September run that pushed its price above $5.50. However, the latest price action suggests buyers may be losing control.

NEAR Token Warning: The Broadening Wedge Points to Correction
NEAR’s daily chart shows a broadening ascending wedge. This bearish reversal pattern features two diverging, upward-sloping trendlines connecting successive higher highs and higher lows.
The formation typically reflects growing market volatility, with buyers pushing prices to new highs but struggling to sustain each breakout.
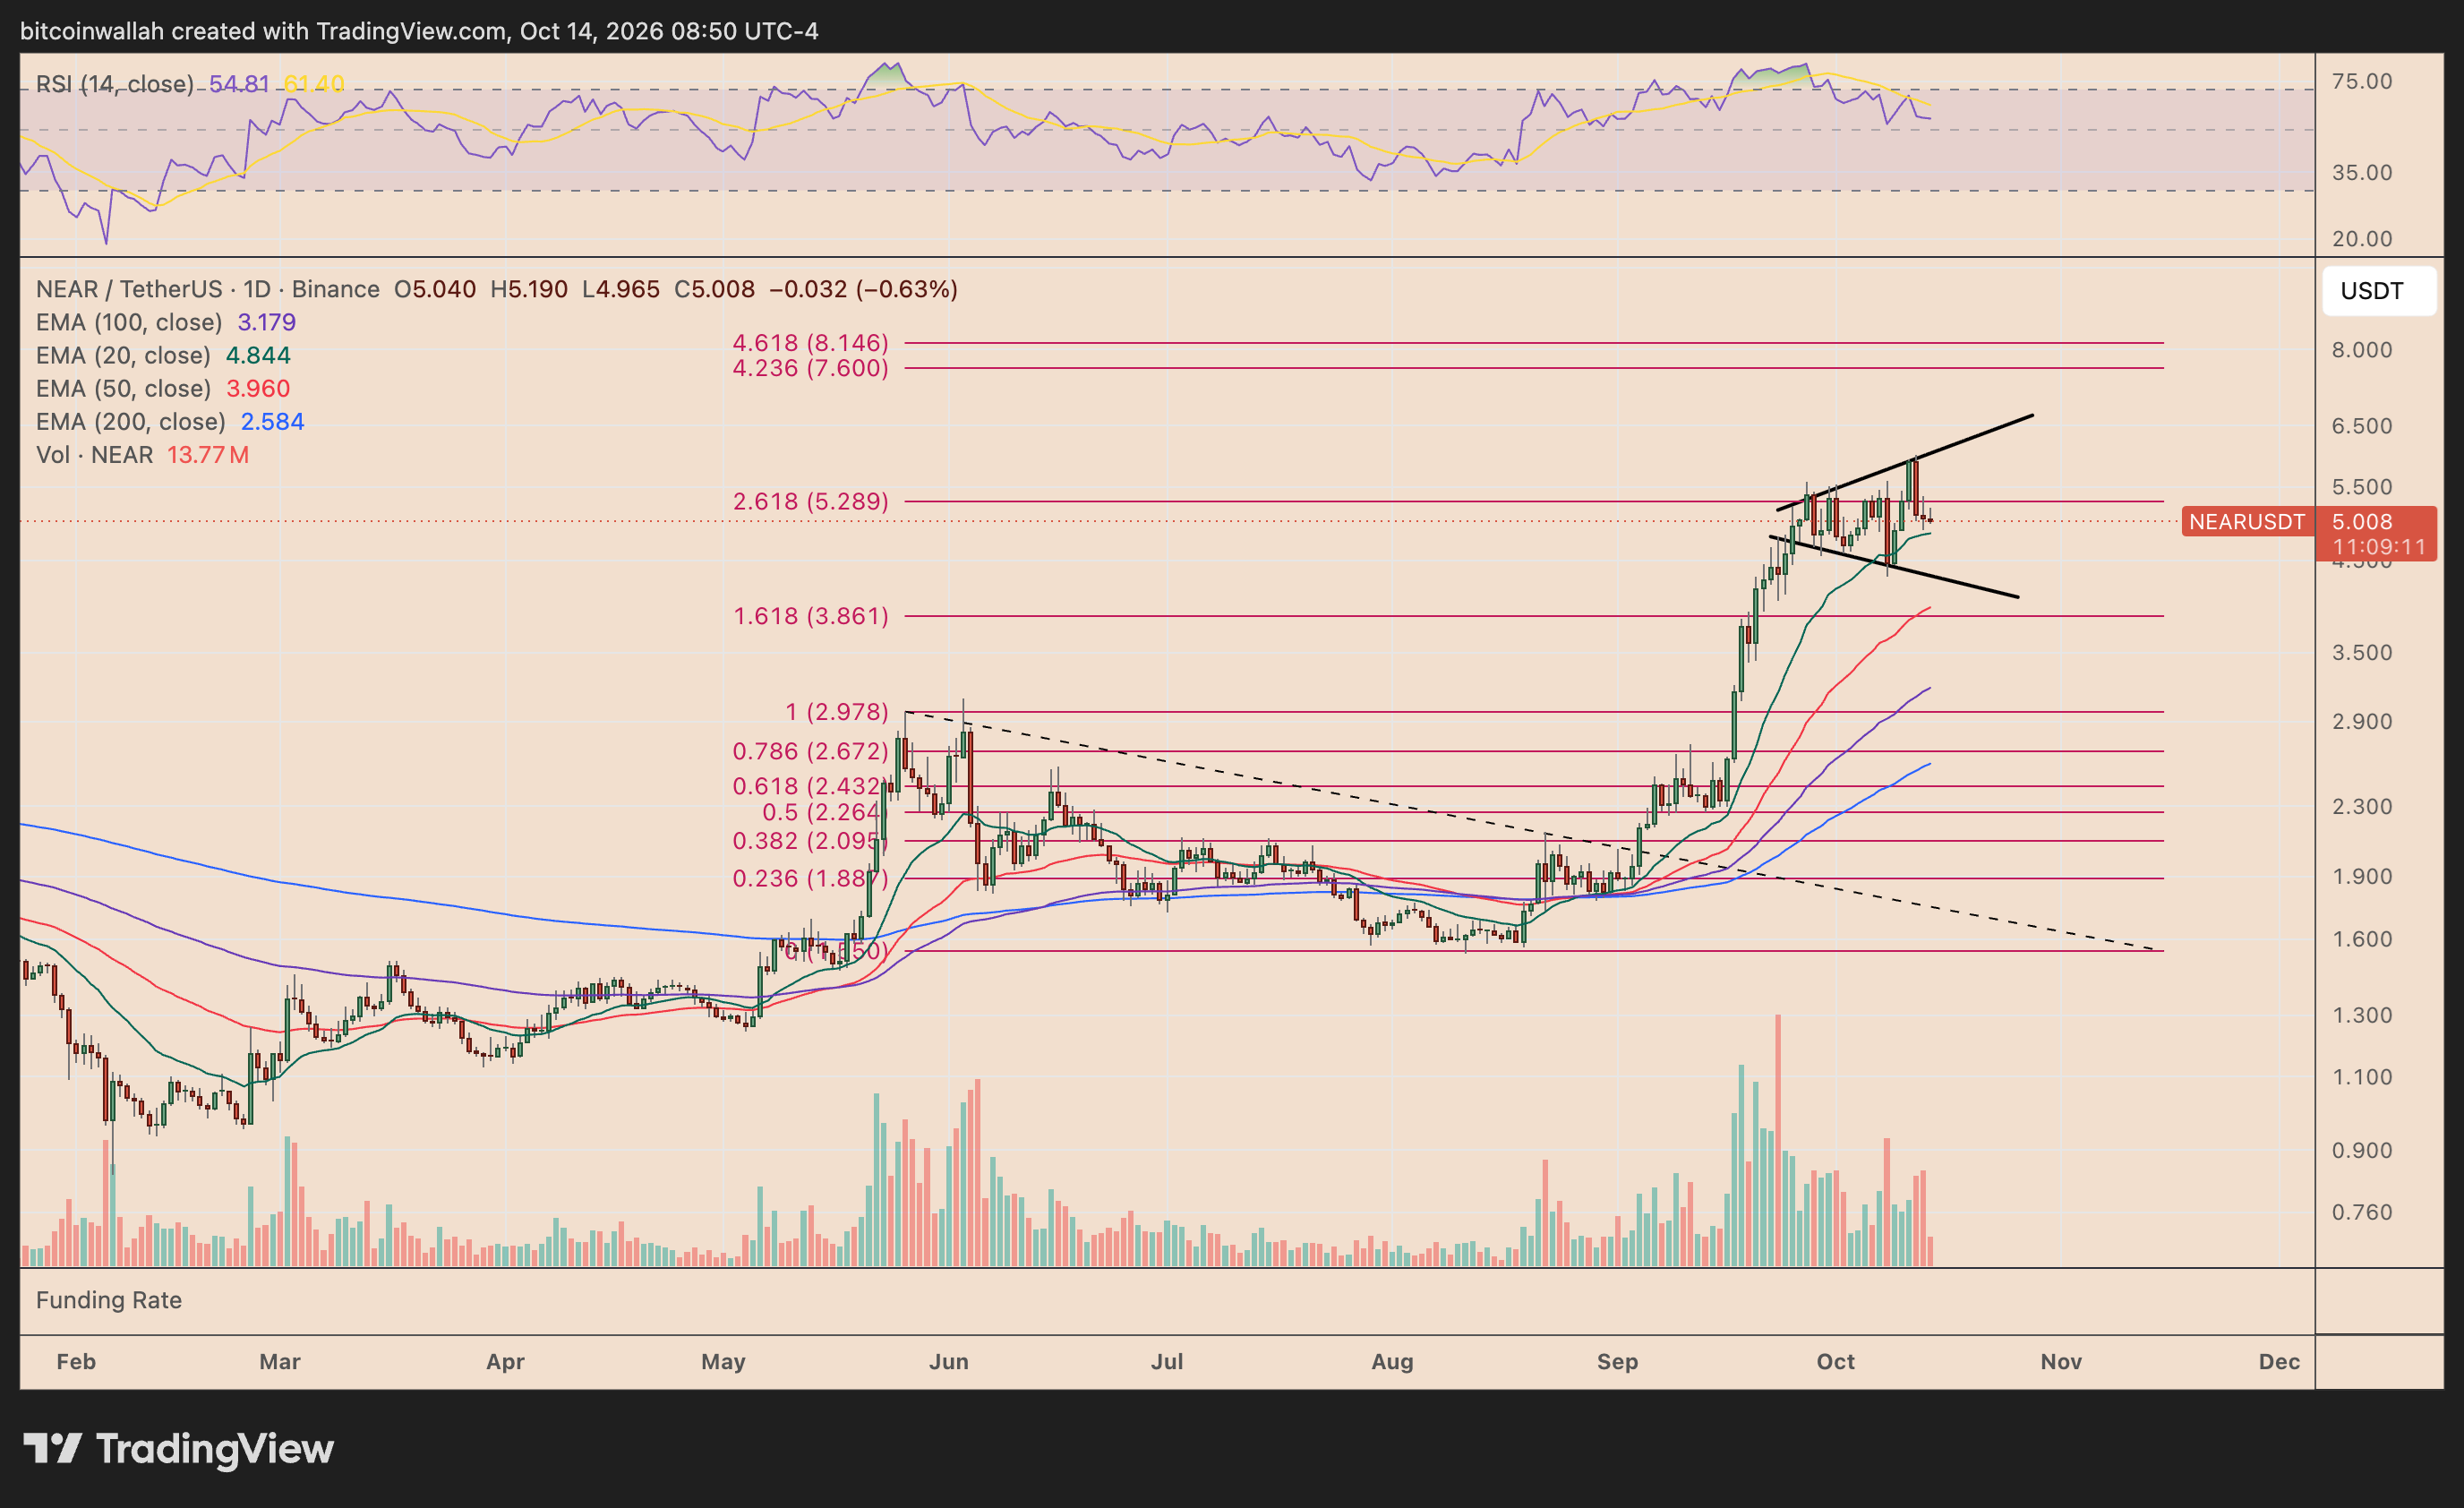
NEAR is now testing the wedge’s lower trendline support near $5.00, making the coming sessions critical. A decisive daily close below this support—preferably accompanied by rising trading volumes—could confirm a bearish breakdown and accelerate selling pressure.
Key Downside Targets to Watch
In a breakdown scenario, NEAR could initially retreat toward its 20-day exponential moving average (20-day EMA, green) near $4.84, before extending losses toward the $3.86–$4.00 support zone. This primary downside target aligns with a heavy confluence of technical indicators:
-
50-day EMA (red): Sitting directly at $3.96.
-
Fibonacci Extension: The 1.618 level rests precisely at $3.86.
Together, these indicators reinforce the $4 region as a high-probability downside objective. NEAR’s daily relative strength index (RSI) has also retreated to around 55 after approaching overbought territory, further suggesting that bullish momentum is cooling.
The Bullish Invalidation
This bearish outlook remains conditional on a confirmed breakdown. A rebound from the wedge’s lower boundary could instead push NEAR toward the upper trendline near $6.50, entirely delaying the anticipated 20% correction.
NEAR Fundamental Analysis:
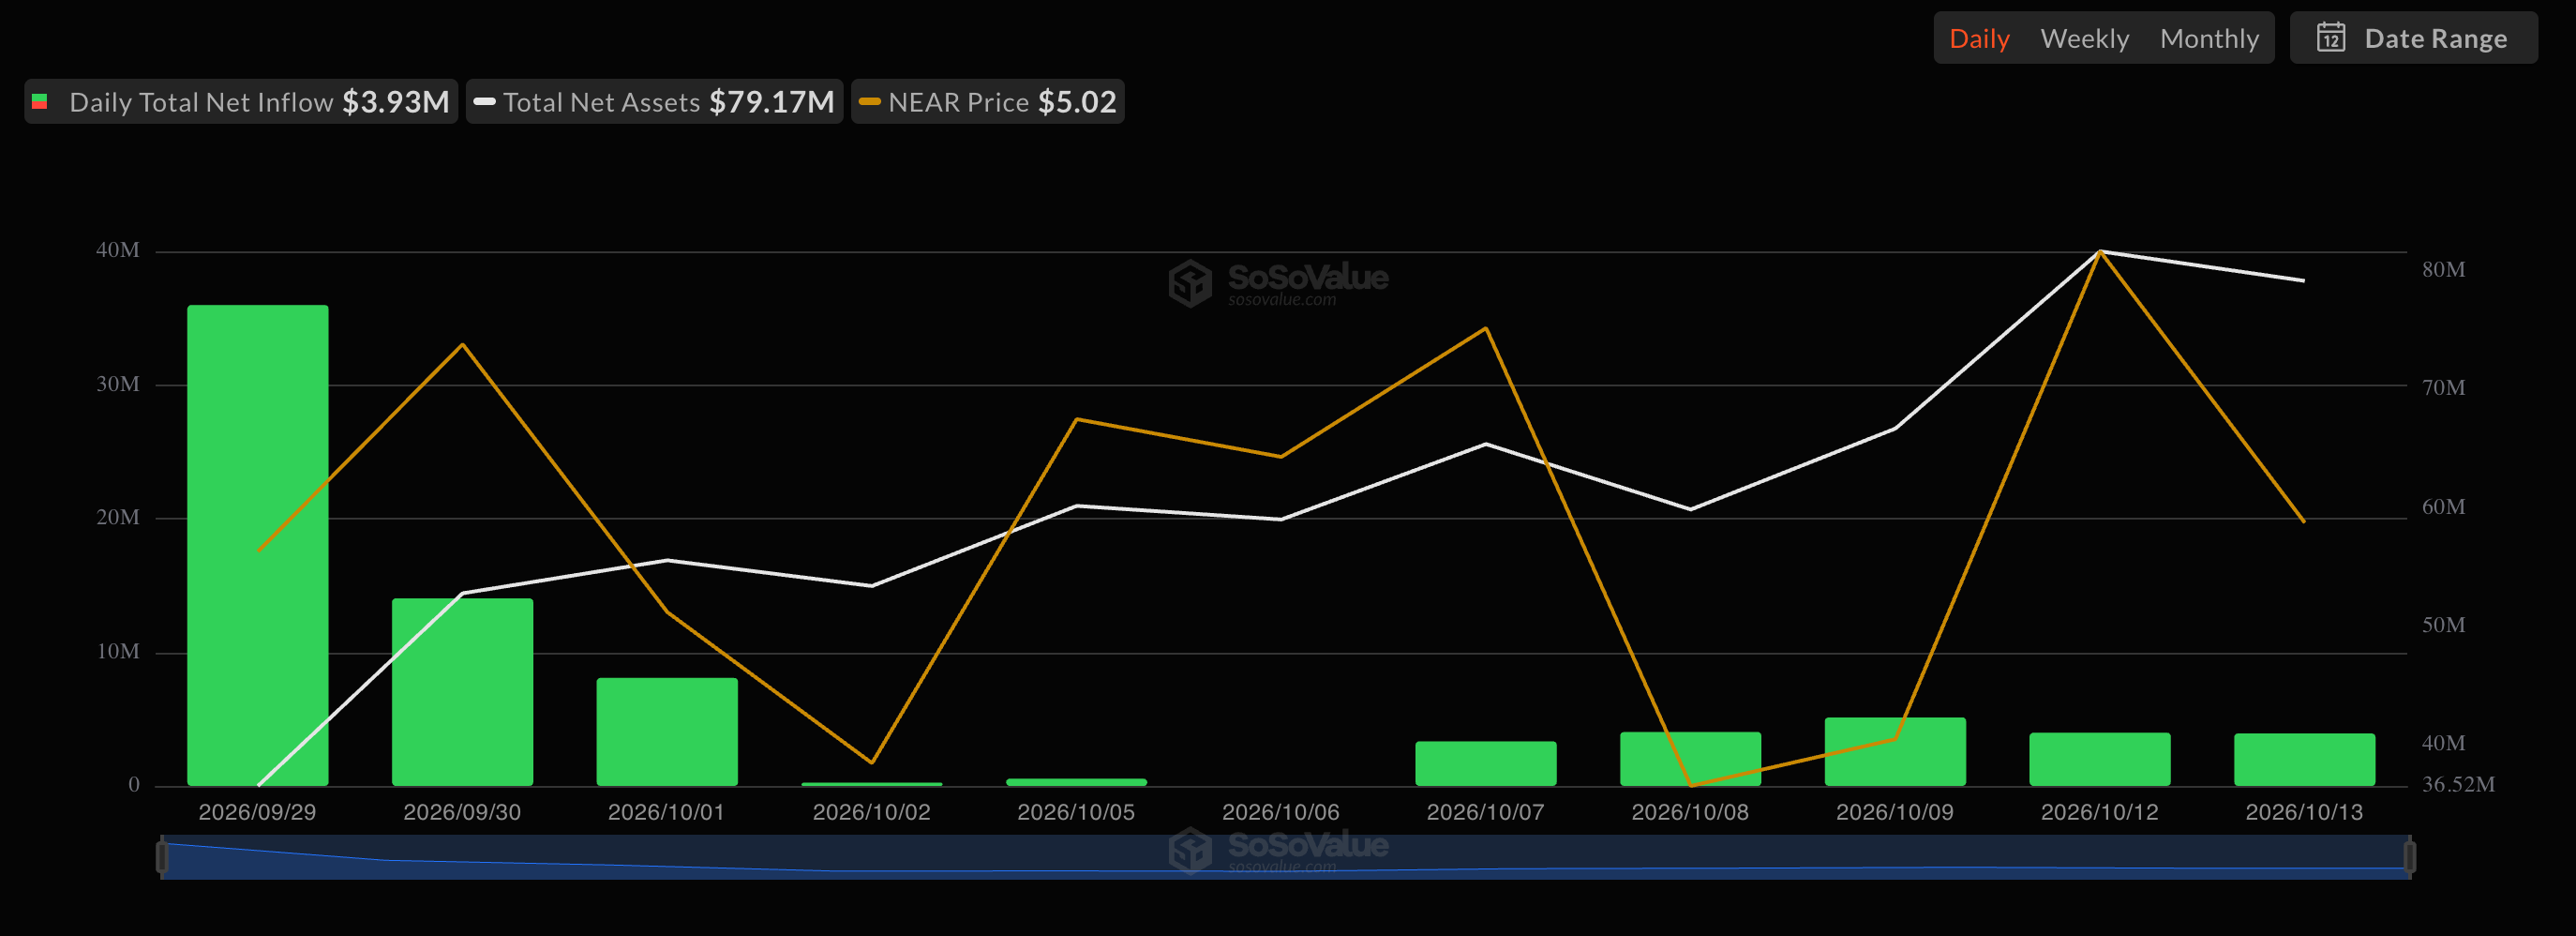
A strong fundamental background could help limit how far the NEAR price drops if a sell-off happens.
Here are the key bullish factors working in NEAR’s favor:
-
Less Inflation: A new network proposal aims to cut NEAR’s annual token inflation from 2.5% down to 1.6%. If passed, this will make the token more scarce over the next two years.
-
Booming Network Activity: NEAR is seeing massive real-world use. Its cross-chain trading features recently crossed $30 billion in total volume, with locked funds continuing to climb, according to official data.
-
The AI Connection: NEAR is deeply tied to the booming artificial intelligence sector. Its co-founder helped write the famous AI research paper “Attention Is All You Need,” and the network is actively building an “Agent Market” where AI can perform automated tasks on the blockchain.
The Bottom Line: For investors, this creates an interesting tug-of-war. If NEAR’s price breaks below the wedge support on the chart, the $3.86–$4.00 zone will be the ultimate test to see if this strong network growth can successfully absorb the selling pressure.