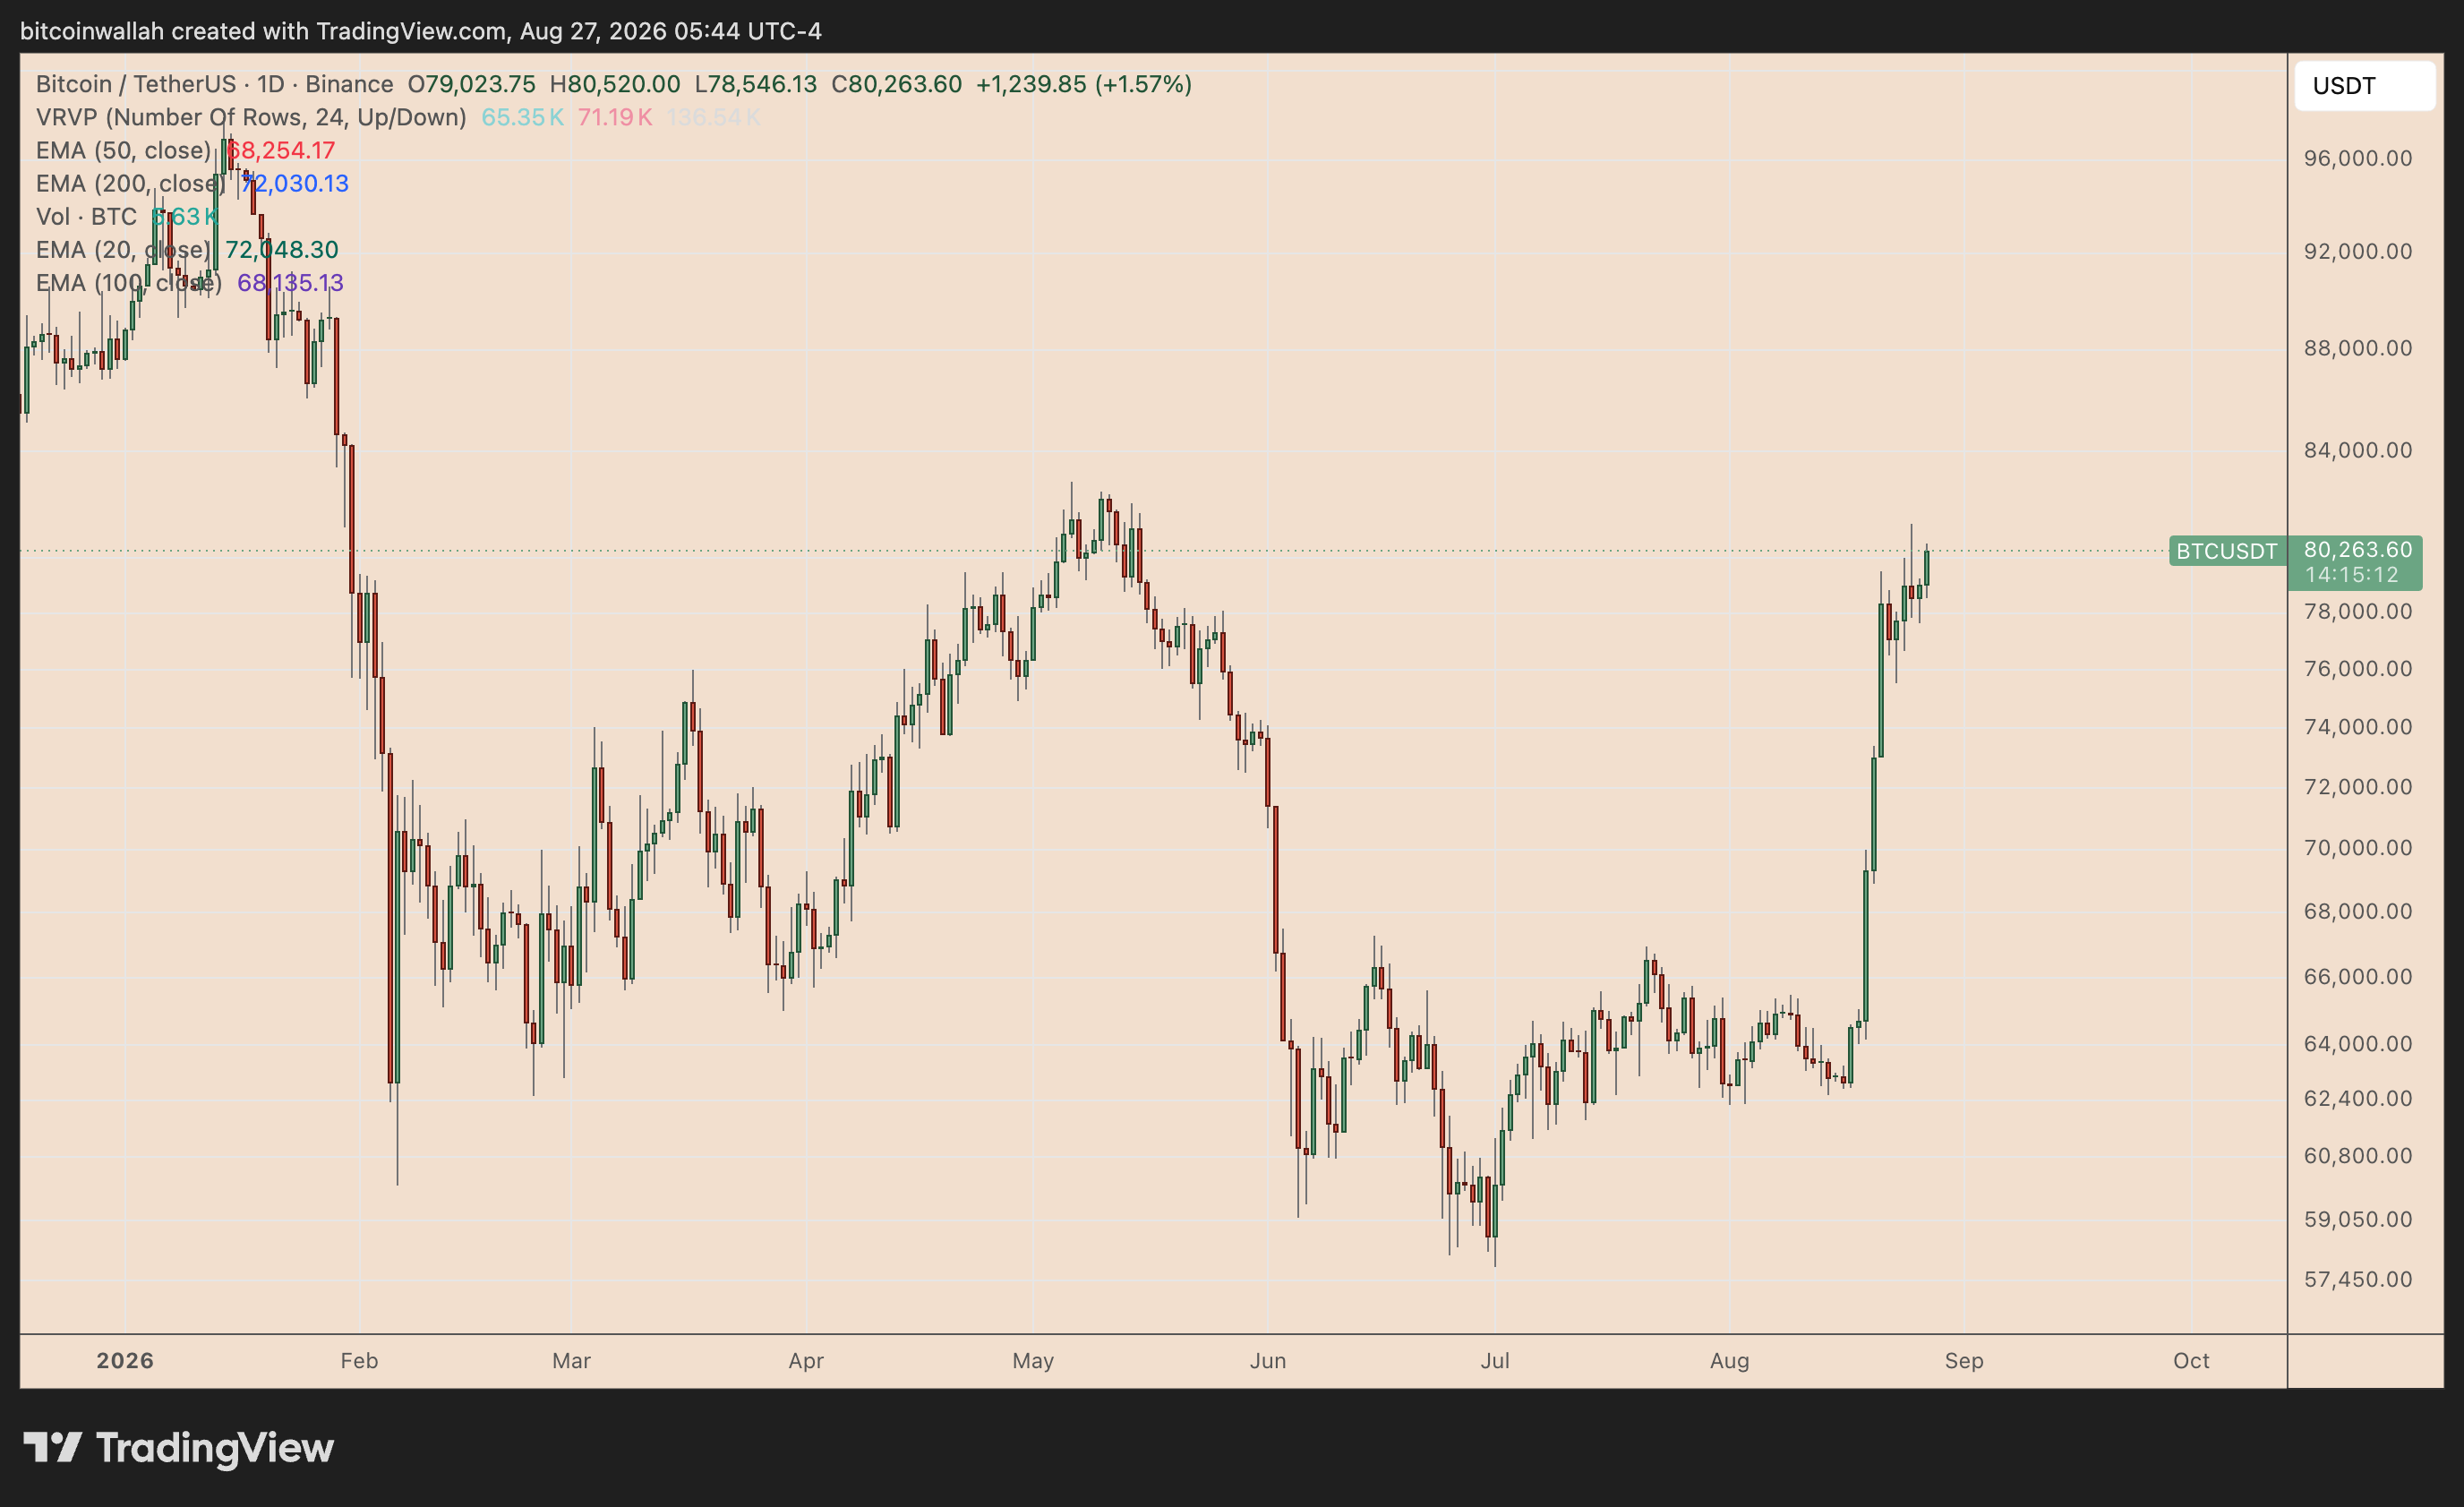
Bitcoin (BTC) has jumped roughly 40% from its July low at around $57,800, sparking hopes that the cryptocurrency is bottoming out after months of consolidation.
Still, a key metric suggests that the rally may turn out to be a bull trap.

BTC Enters Capitulation Zone That Last Sent Prices Down 30%
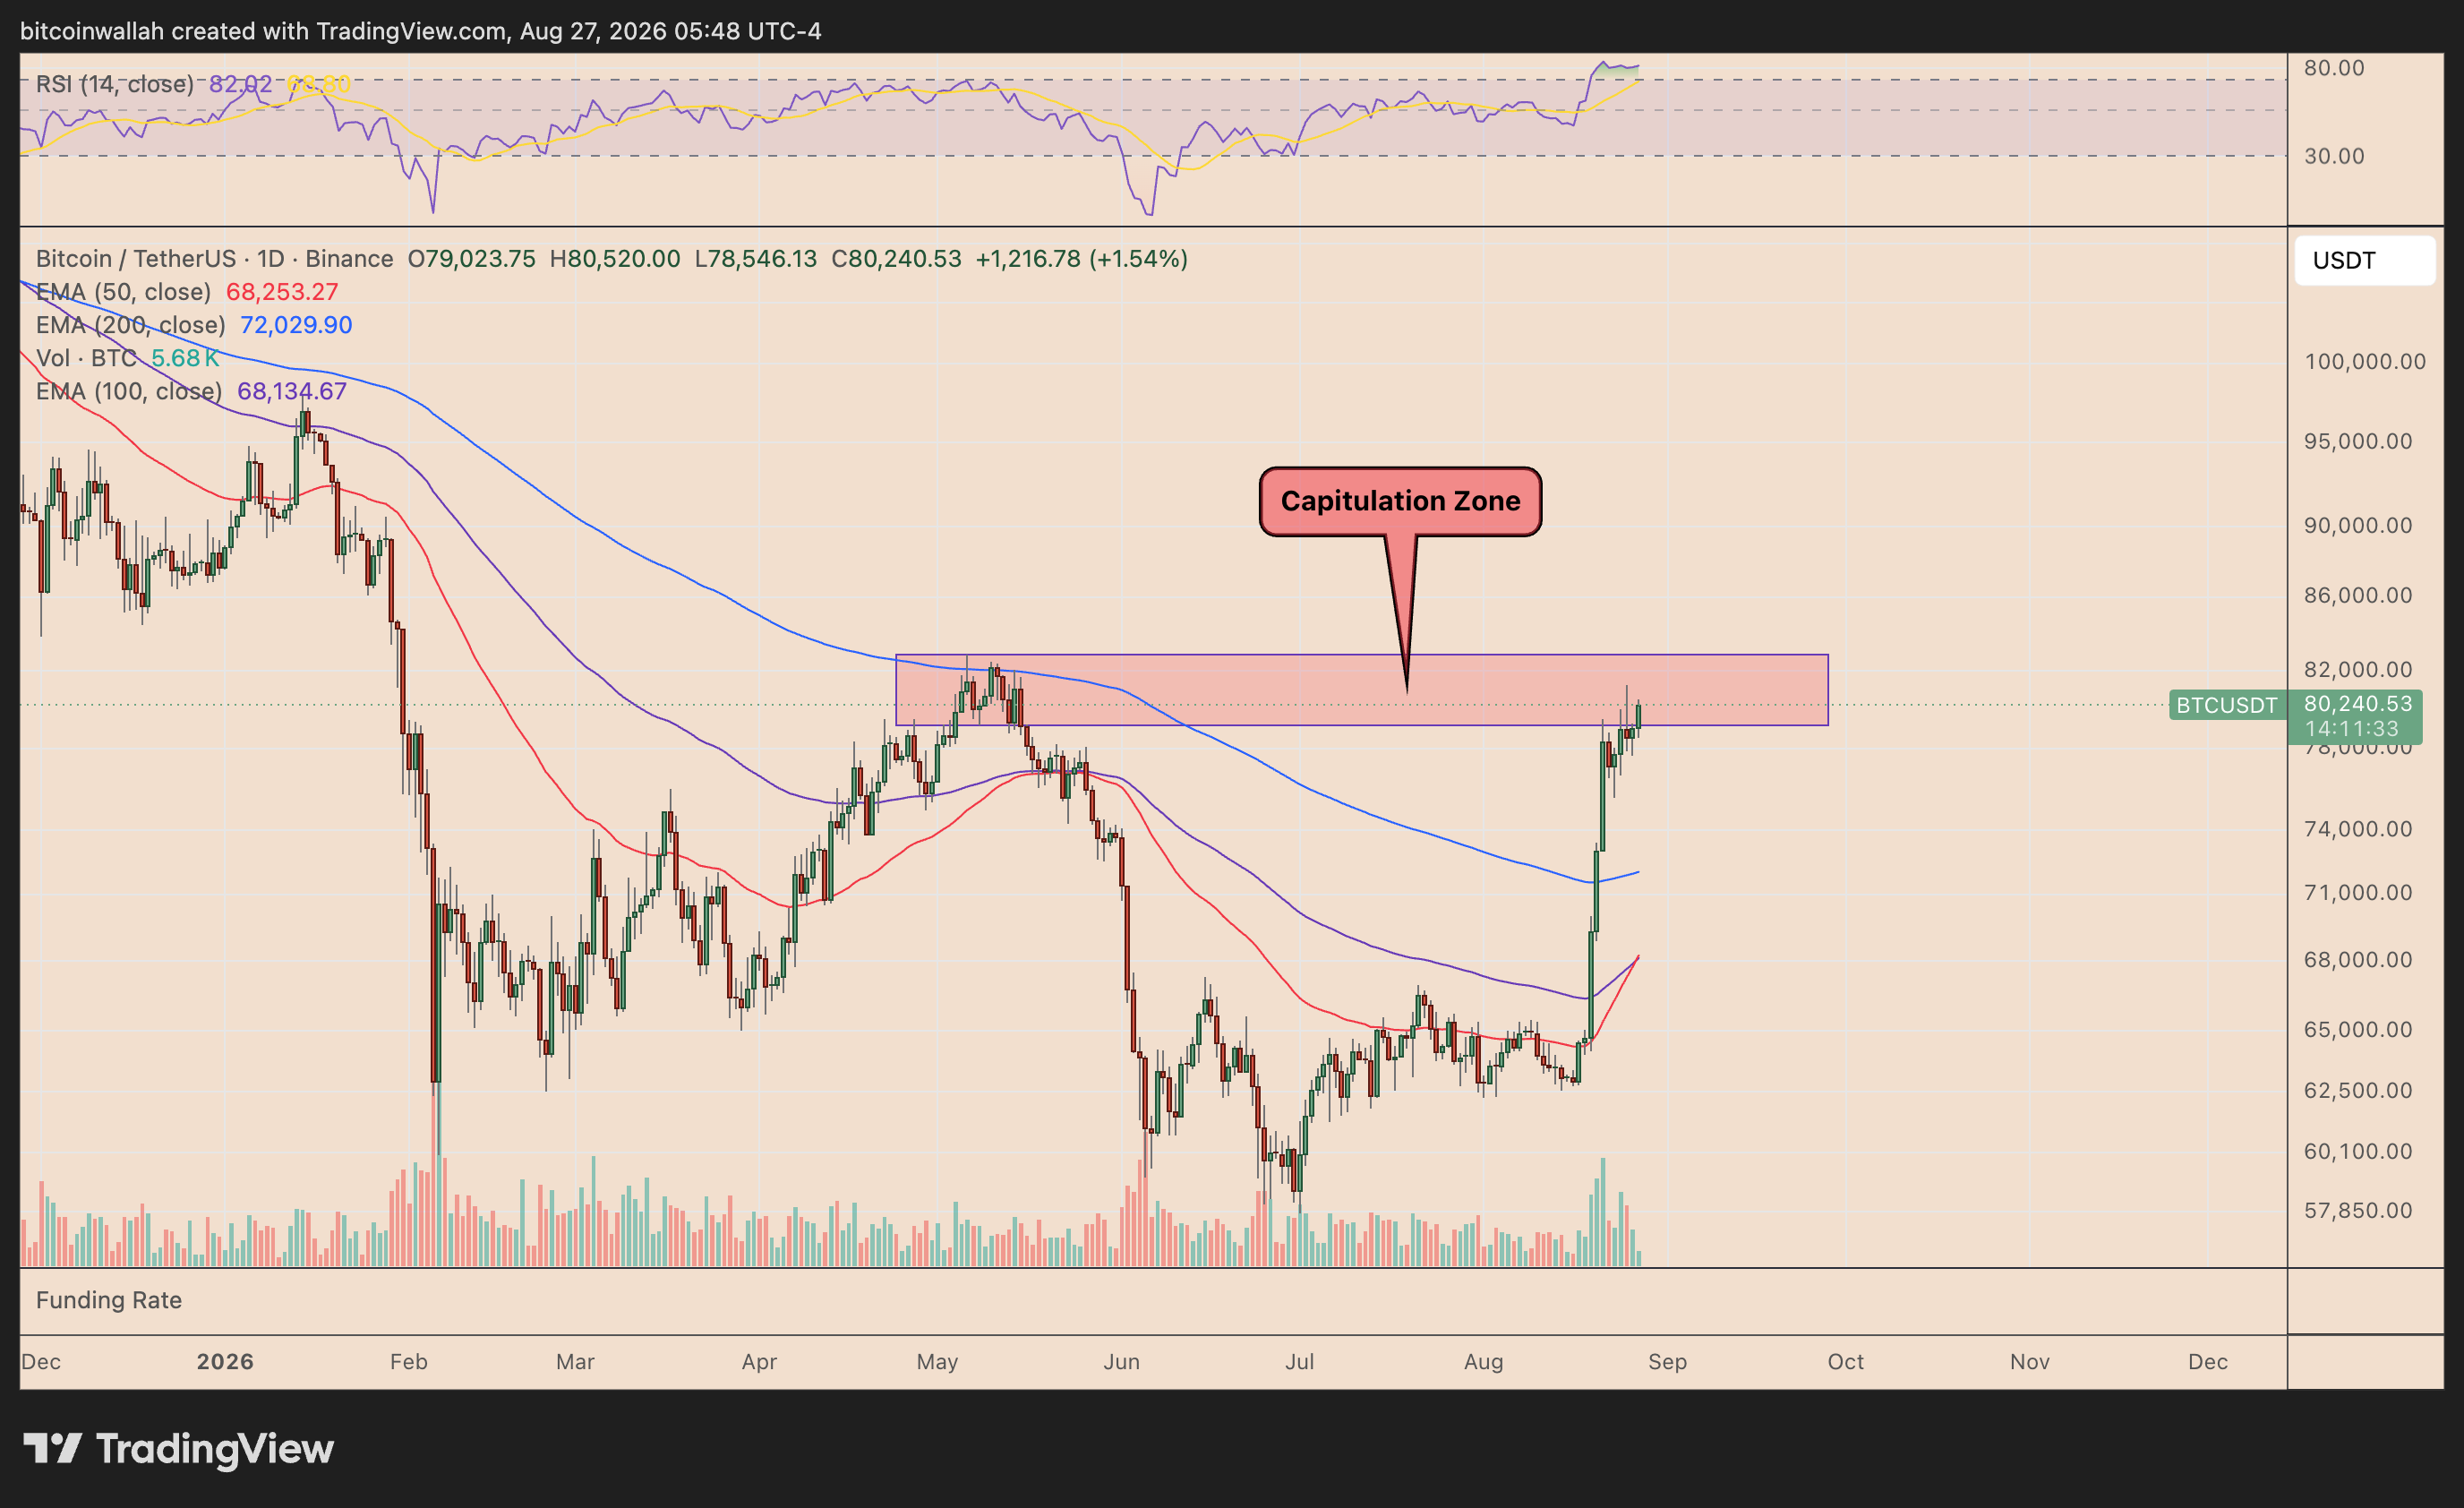
As of Thursday, Aug. 27, Bitcoin was trading near $80,200, putting it back inside the $79,000–$82,500 resistance area that capped its recovery in May.
In May, BTC consolidated around the same zone before sellers regained control. The rejection eventually sent the cryptocurrency toward $57,800, representing a decline of roughly 30% from the zone’s upper boundary.
The latest retest is showing similar signs of overheating.
Bitcoin’s daily relative strength index (RSI) has climbed above 82, well beyond the 70 threshold traditionally associated with overbought market conditions. That raises the likelihood of profit-taking.
A rejection from the $79,000–$82,500 area would put Bitcoin’s 200-day exponential moving average (200-day EMA; blue) near $72,000 in focus as the first major downside target.
That would amount to a roughly 10% correction from current levels.
A stronger selloff could push BTC toward the $68,000–$68,300 region, where its 100-day EMA (purple) and 50-day (red) EMA are converging.
The bearish setup would weaken if BTC decisively closes above the $82,500 resistance area. Such a breakout would turn the former capitulation zone into potential support and increase the likelihood that the July bottom was sustainable.
Bitcoin Price Forecast
Every new Bitcoin analysis as it publishes, today's technical signal and key levels, live price — on one page.
See all Bitcoin forecastsBitcoin Liquidation Heatmap Shows Bigger Downside Magnets
Bitcoin’s liquidation heatmap adds to the bearish case, showing significantly more leveraged positions at risk below the current price than above it.
The most immediate “liquidity magnet” sits around $77,500, where roughly $392.31 million in long positions could be liquidated if BTC falls into the area, according to data from CoinGlass.
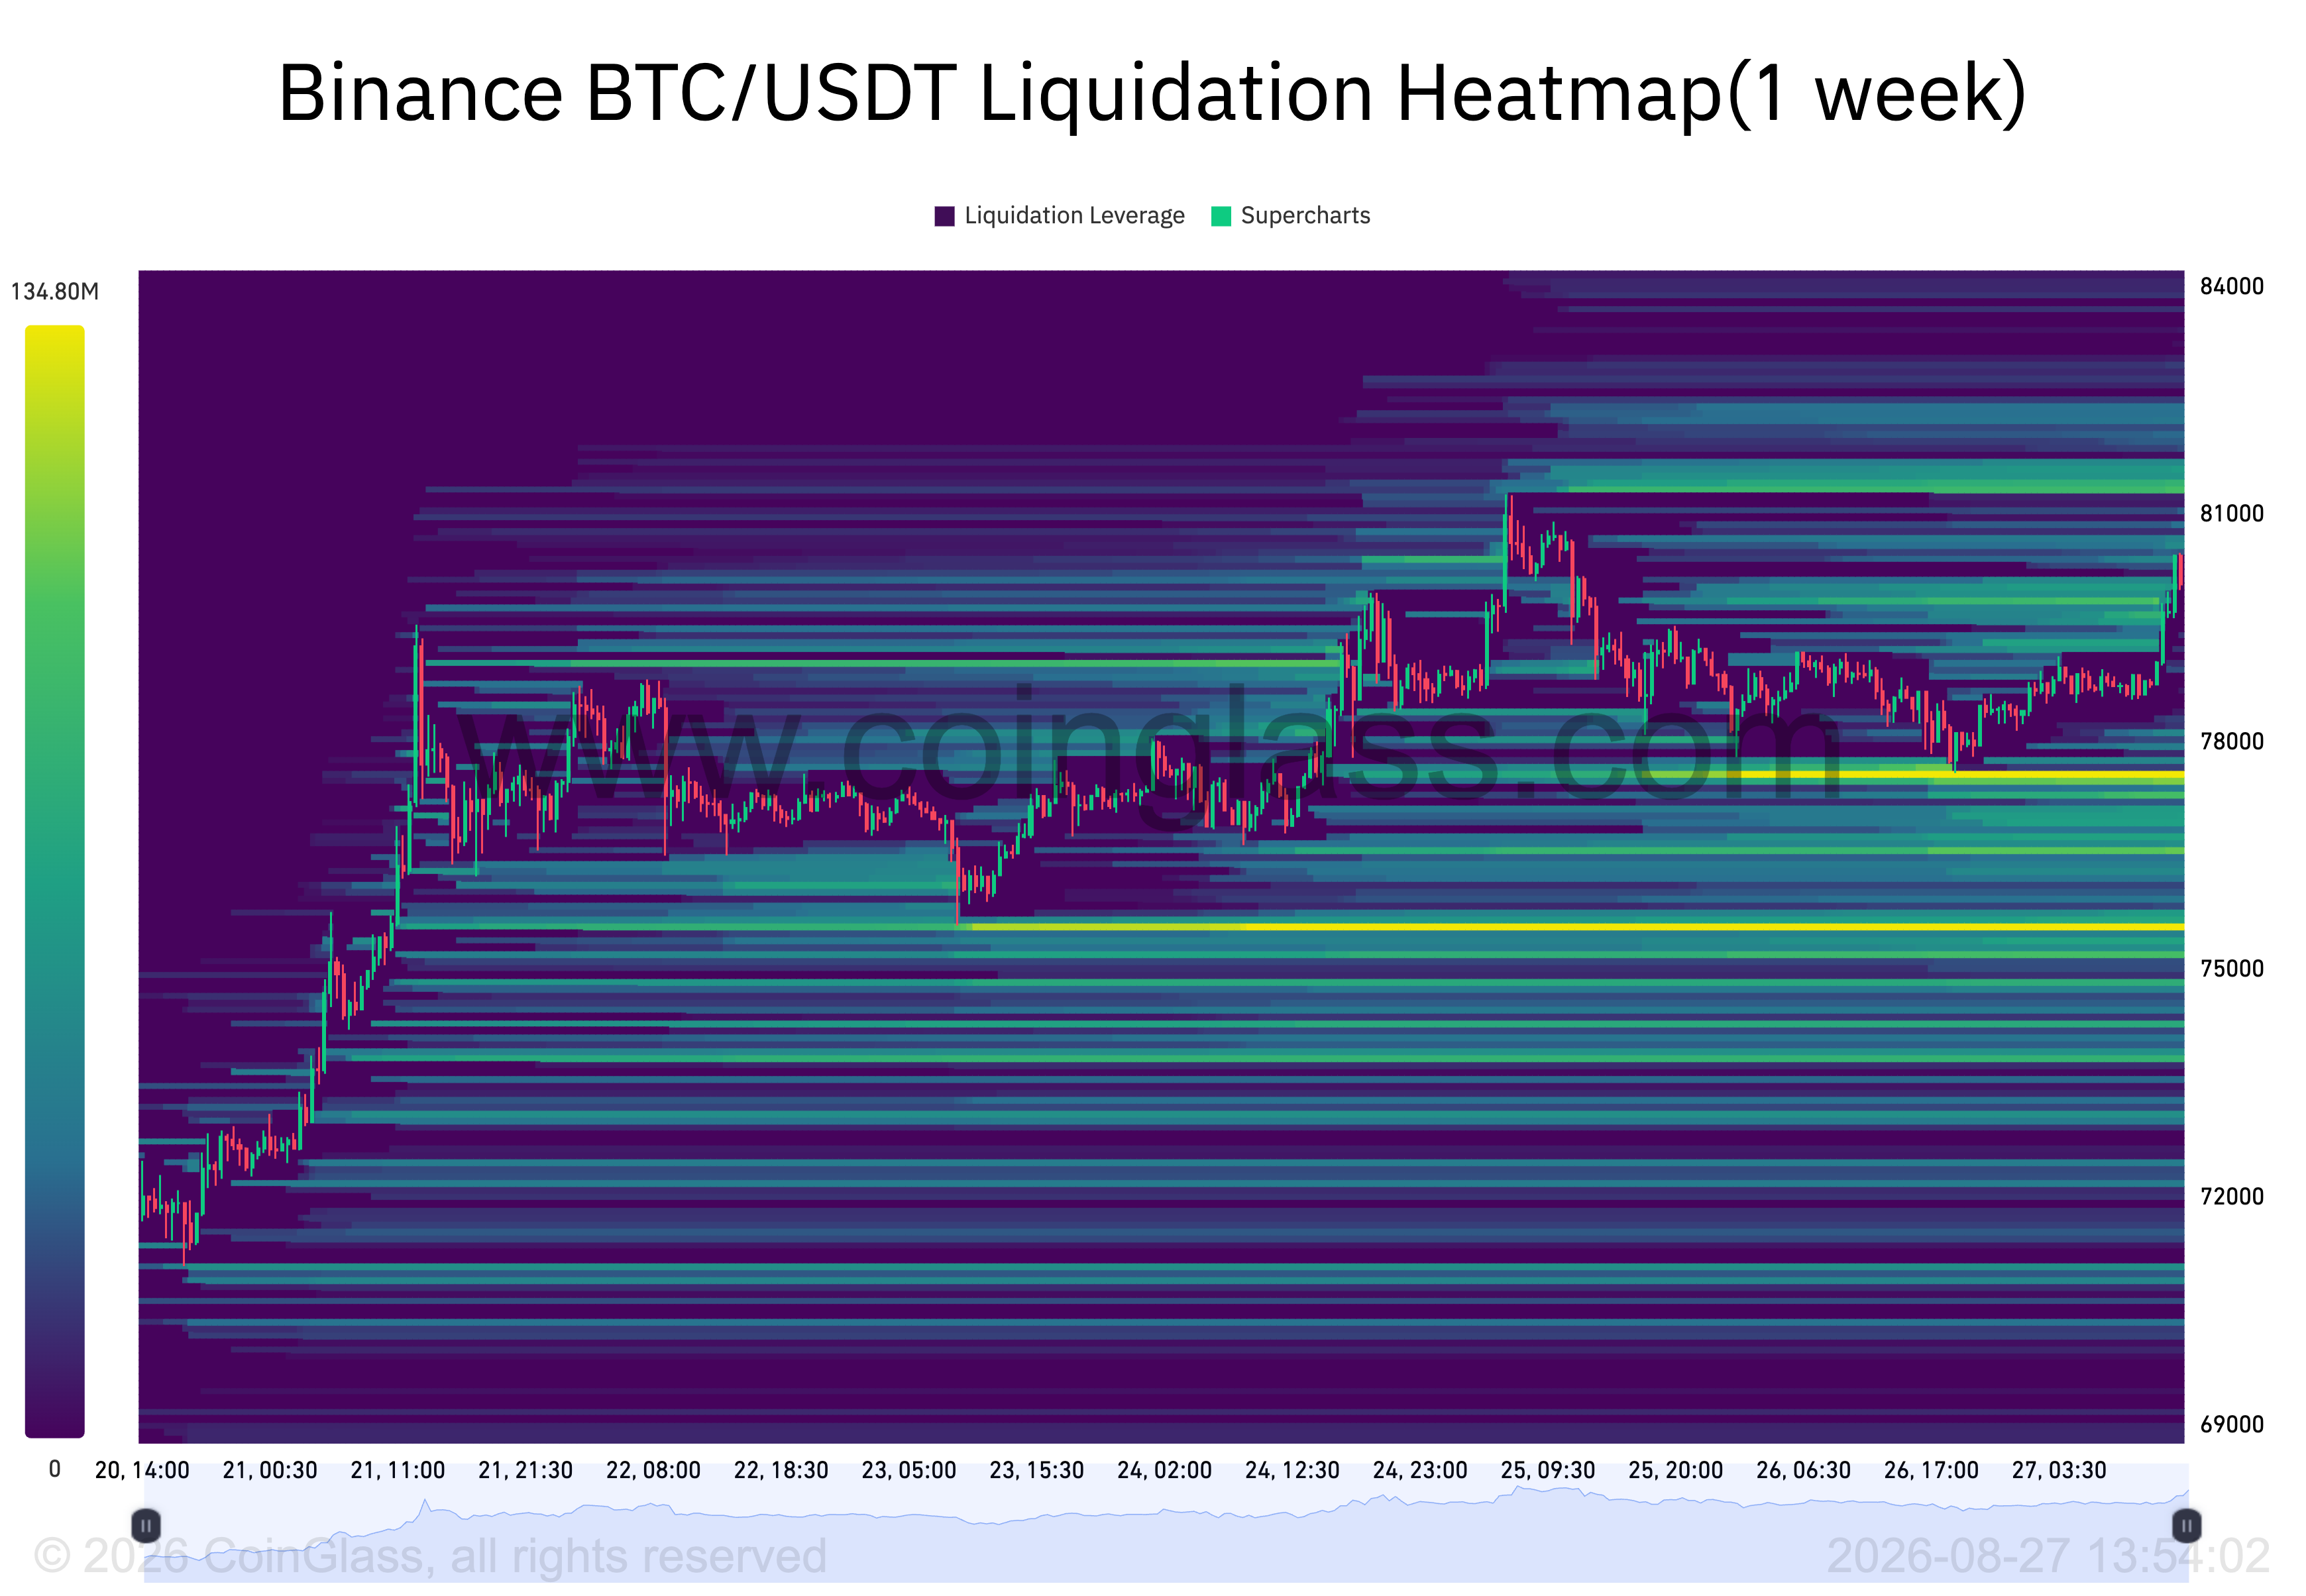
For beginners, liquidation zones are price levels where a large number of leveraged traders could be forced out of their positions. They are often called “magnet zones” because price tends to move toward areas with large concentrations of liquidity.
A drop toward $77,500 could therefore trigger forced selling from leveraged bulls, potentially accelerating the decline.
More importantly, the downside liquidity pool becomes substantially larger below that level. An estimated $2.90 billion in long positions could face liquidation if Bitcoin falls toward $68,000.
By comparison, the main upside liquidation zone for short sellers sits near $84,200–$84,215.
That leaves BTC with two major liquidity magnets on either side of the market, but the much larger pool of long liquidations below current prices strengthens the bearish scenario.