Bitcoin (BTC) has booked a 3% gain in the past 24 hours and could resume its rally as October has typically been a great month for crypto.
Also known as “Uptober”, BTC’s historical returns show that the top crypto has delivered gains ranging from 5.6% to 60.8% since 2013, according to data from CoinGlass.
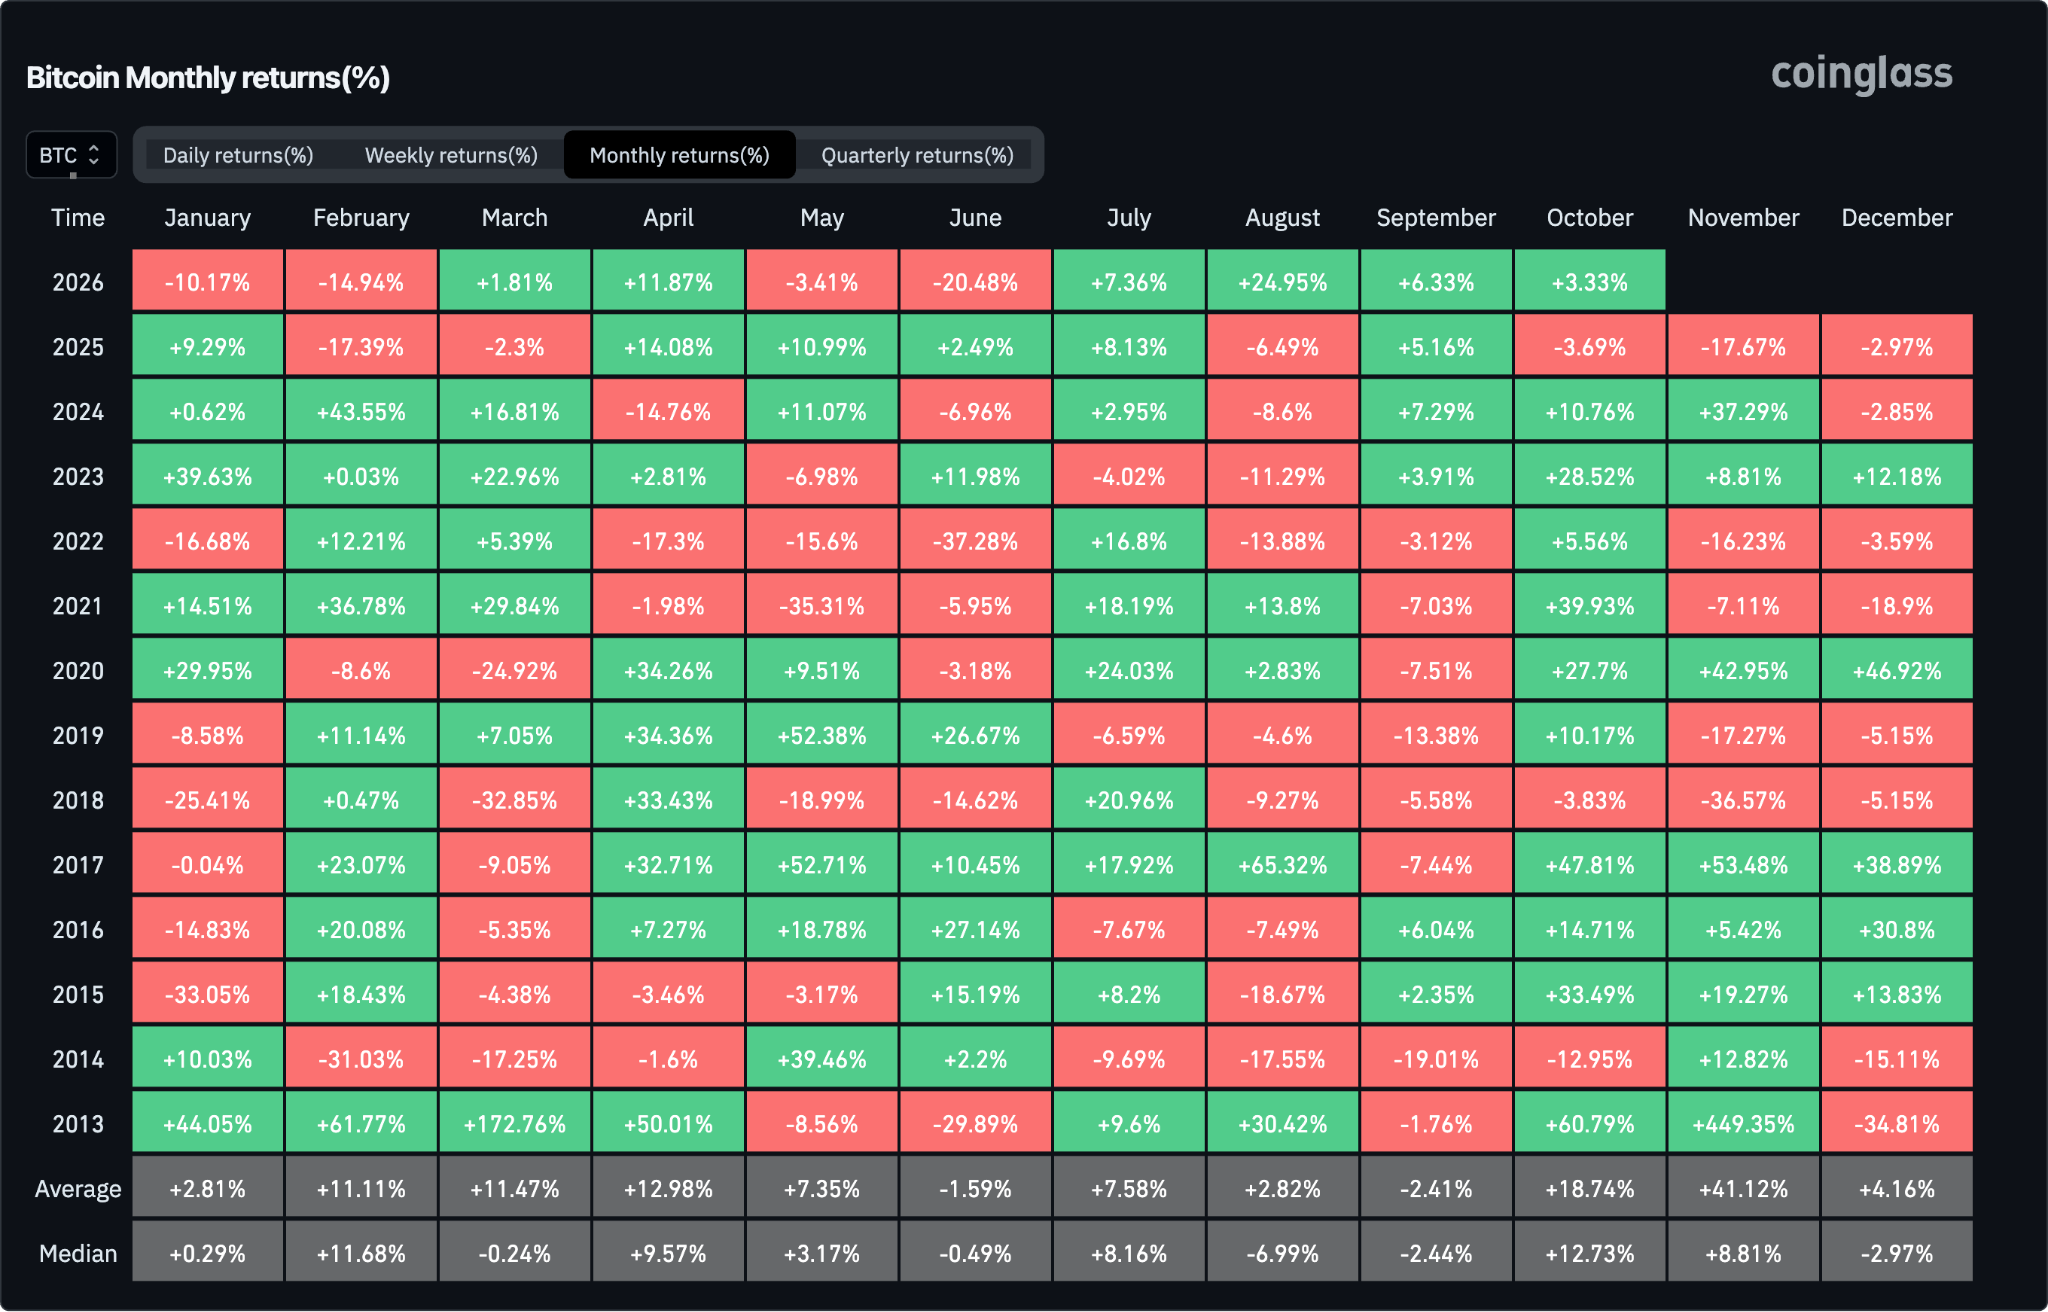
The token’s performance has been positive in 10 out of the last 13 years. Since both technical and on-chain indicators have confirmed that this could be the beginning of a bullish cycle, the baseline scenario for BTC is that the rally that started last month will eventually resume.
Meanwhile, macroeconomic conditions improved a bit after this week’s cooler-than-expected inflation print in the United States. According to the Bureau of Economic Analysis, the Core PCE Price Index, the Federal Reserve’s preferred metric for inflation, came in at 0.2%.
This was 10 basis points below the market’s consensus estimate for August. As a result, analysts have lowered the odds of a rate hike in October from 50% to 24%, setting the stage for the continuation of the current rally in the next two months at least.

Net Inflows to Bitcoin ETFs Slowed Down in September
Exchange-traded funds (ETFs) linked to BTC broke a 9-day streak of positive net inflows on Wednesday. Hence, the risk of a pullback still exists, especially as BTC only retreated slightly upon hitting the $85,000 resistance.
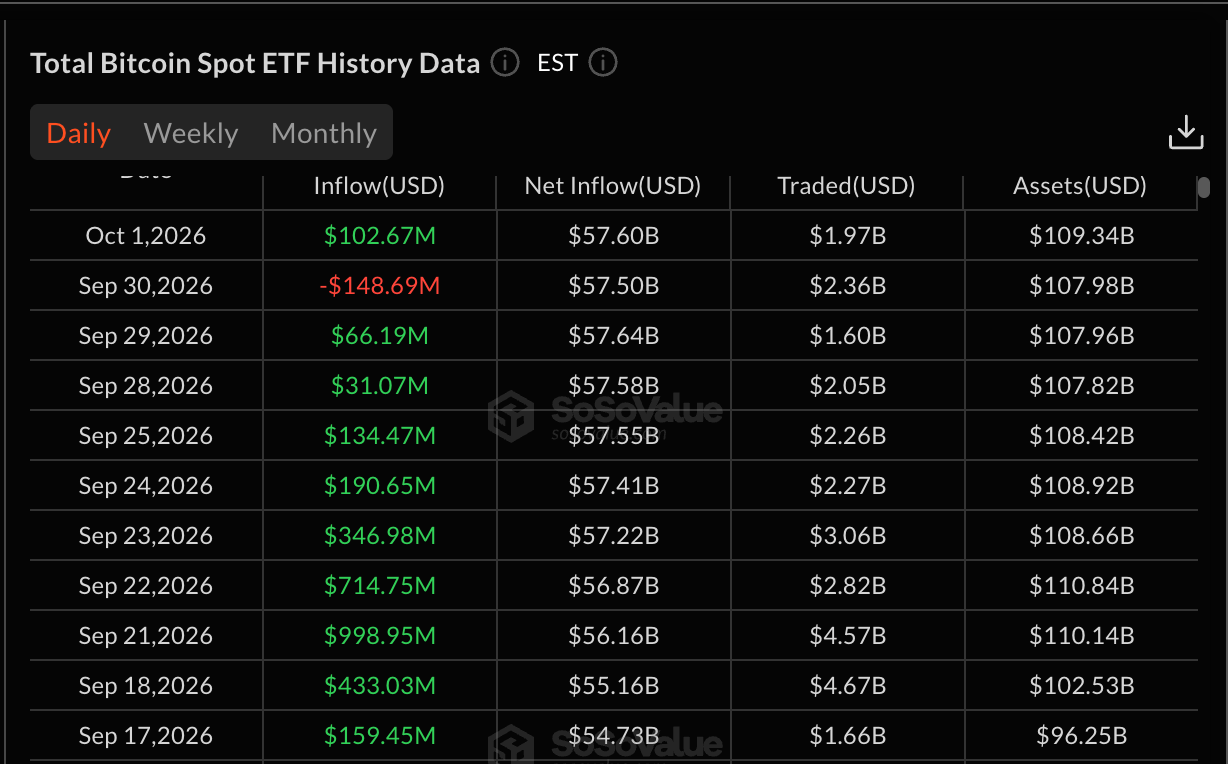
Last month, net inflows ended at $2.65 or 25% below August’s total. Although Wall Street continues to be positioning for the continuation of the rally, it seems that investors were more cautious, as a more aggressive pullback seems necessary to lure late buyers into the rally.
Short liquidations spiked in the last 24 hours as a result of BTC’s strong climb, rising to $244 million. This has been the highest single-day wipeout for bears since September 20. BTC shorts were the most impacted during this period, accounting for more than half of that total.
Bitcoin Price Forecast
Every new Bitcoin analysis as it publishes, today's technical signal and key levels, live price — on one page.
See all Bitcoin forecastsBTC Could Still Dip to $80K If It Fails to Break Past Its Current Sell Wall
Heading to the daily chart, we can see that BTC is nearing its late-September highs today. This is a key supply zone to watch, and any strong reaction in the price could indicate that the selling pressure persists at this particular area.
Momentum readings continue to be quite positive, with the Relative Strength Index (RSI) currently standing at 68.
That said, we still see high odds that the $85K resistance will hold. If it does, this could trigger a more significant decline toward $80,000, as the crypto market seems to be running out of liquidity to break past this sell wall.
Turning to the 4-hour chart, we can see that $87,500 is the key level to watch during today’s session. If we get past that mark, the short squeeze may intensify, which may result in a definite breakout and subsequent rally to $90,000 and beyond.
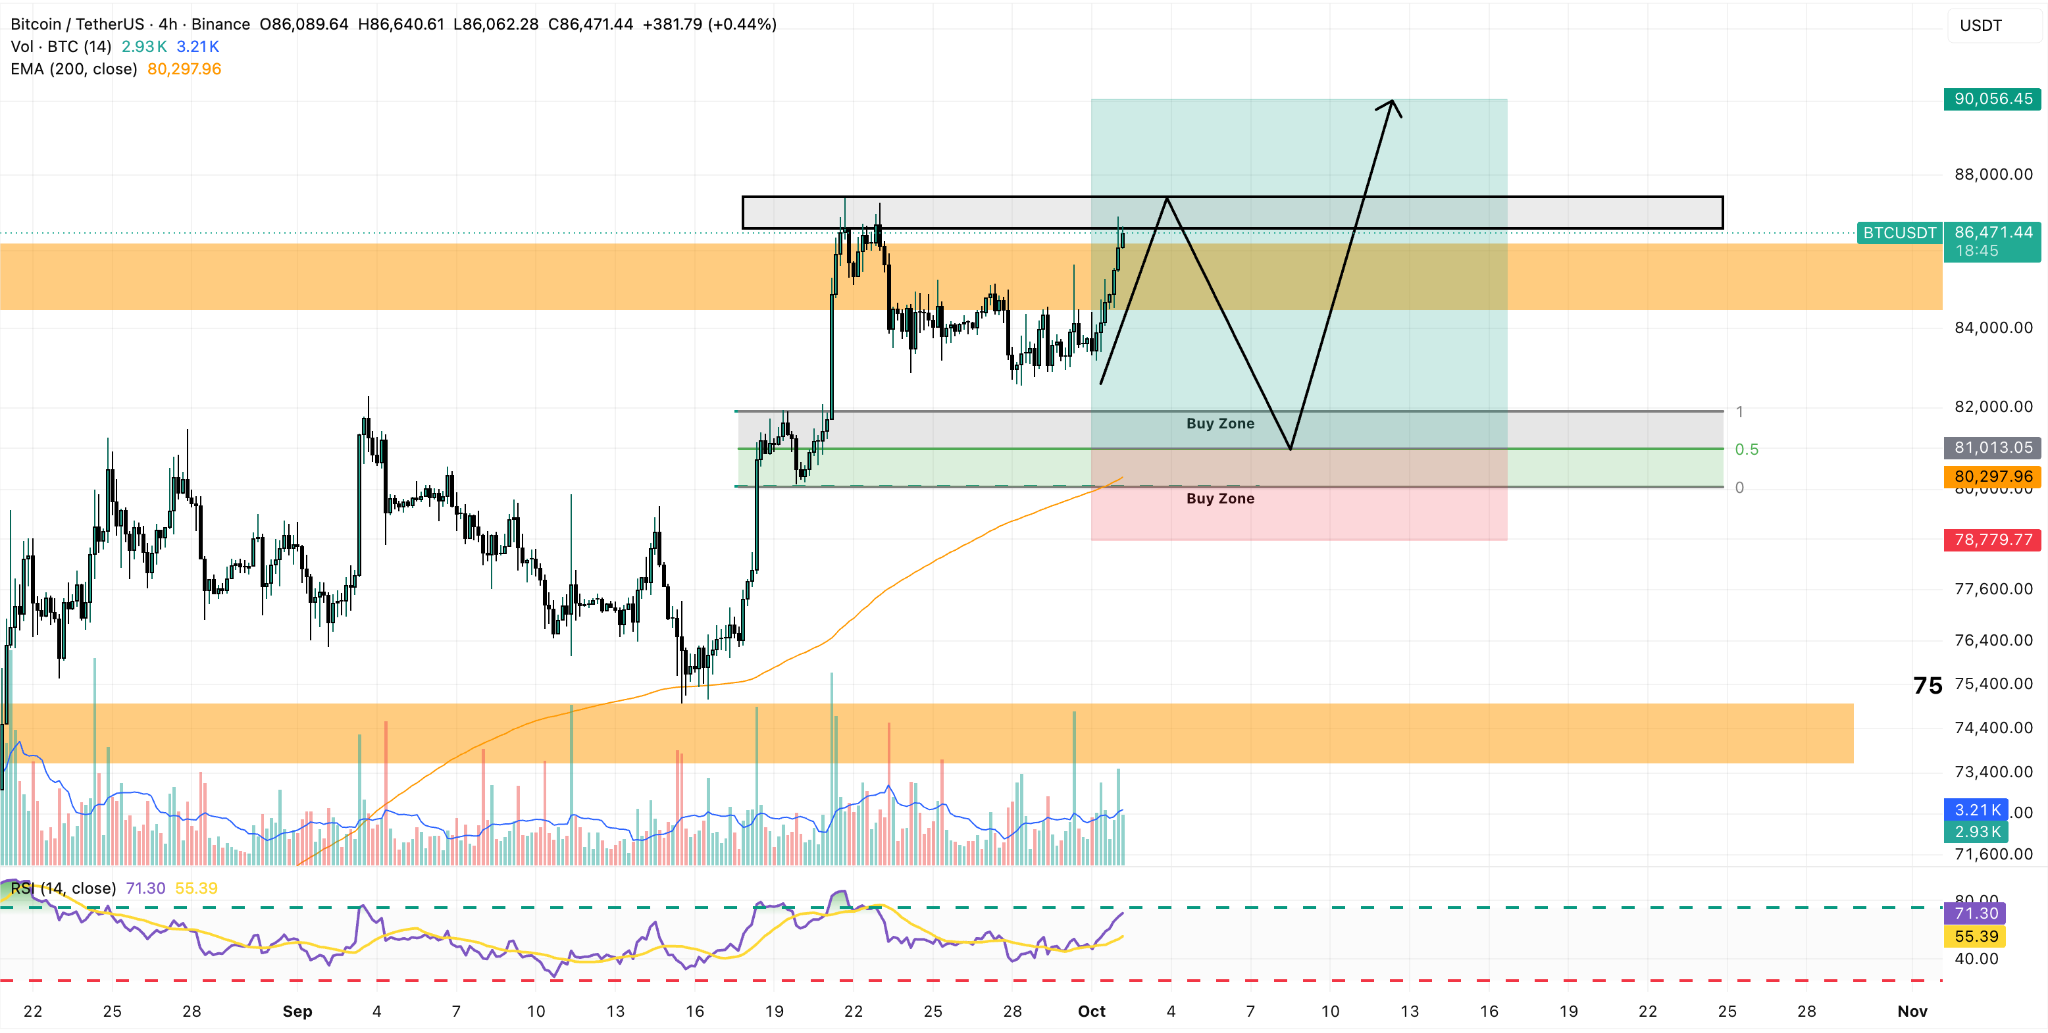
However, if the price pulls back to what we see as the hottest buy zone for BTC, between $80K and $82K, this could be an attractive opportunity for late buyers to enter a BTC long position that offers a 4x risk-reward ratio.