Bitcoin (BTC) continues to consolidate in a range between $60,000 and $66,000, but one bullish pattern has formed lately that could put an end to the top crypto’s stalled price action.
A hawkish Federal Reserve, persistent geopolitical tensions, and the hack of a well-known Bitcoin-only cold wallet named Coldcard contributed to pushing the price of BTC down to $62,000 in the past few days.
However, the selling pressure was limited as buyers continue to accumulate BTC at these low levels with the expectation that the tide may turn once the Clarity Act is passed in the United States.

Bitcoin ETFs Close July in Positive Territory
Bitcoin-linked exchange-traded funds (ETFs) booked their first positive month in the last three with net inflows of $172 million.
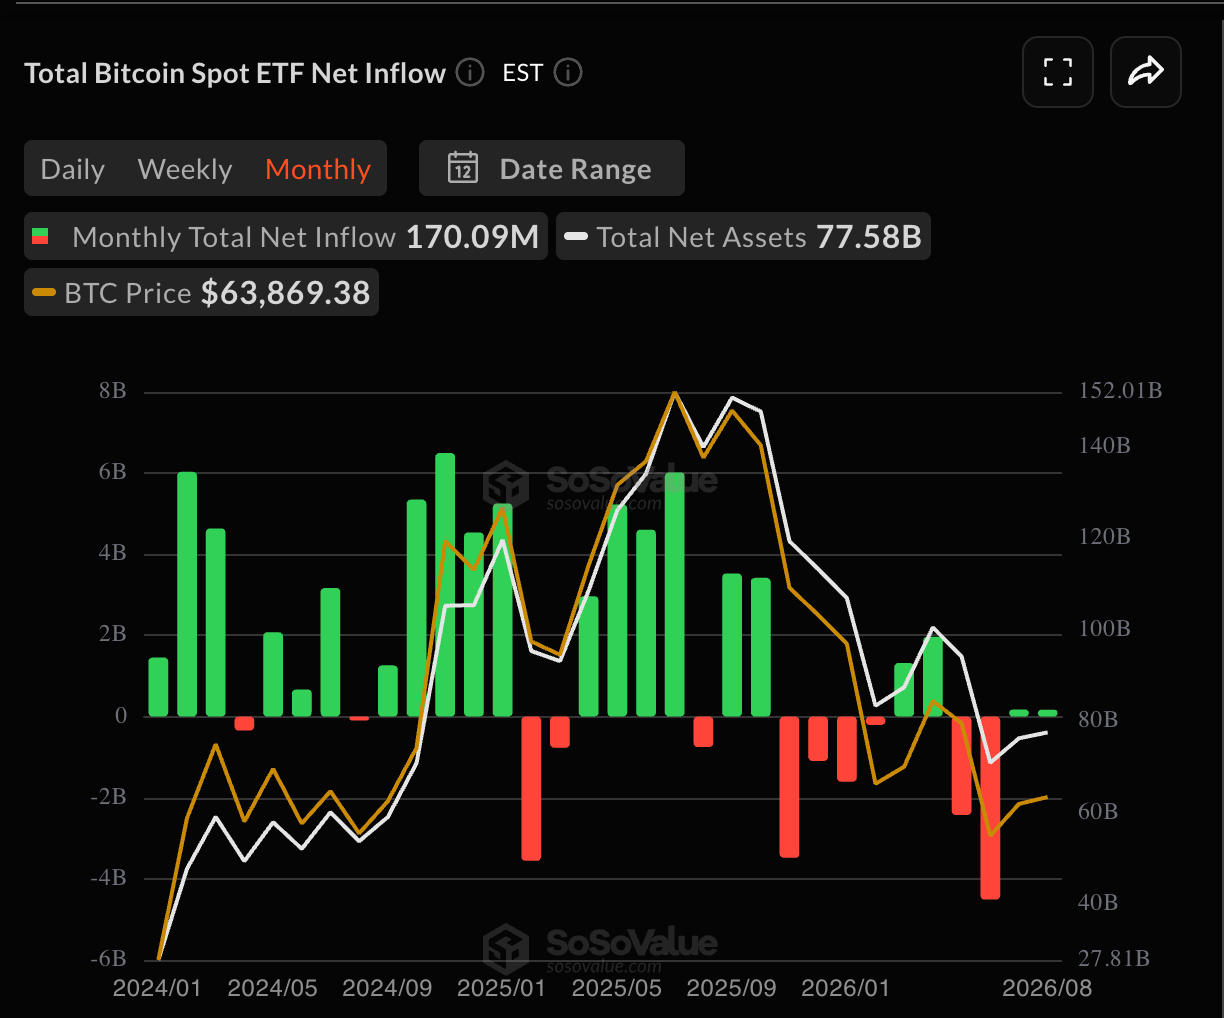
Although a meager figure compared to the total assets under management (AUM) held in these vehicles, this marks a change in the overall trend, as investors took out $4.5 billion from these funds just a month before.
Meanwhile, this week started with a positive single-day inflow of $170 million despite the latest updates regarding the Coldcard hack. To date, the tally has surged to $100 million in losses resulting from this incident, in which hackers managed to exploit a technical weakness that allowed them to recreate valid recovery phrases.
Cold wallets have been touted for years as one of the safest alternatives to store crypto assets. However, this latest incident revealed that the underlying coding that powers these devices could be the weak link that allows criminals to steal users’ funds.
Bitcoin Price Forecast
Every new Bitcoin analysis as it publishes, today's technical signal and key levels, live price — on one page.
See all Bitcoin forecastsWhales Buy 30,000 Bitcoin Worth Over $200M in Three Days
Despite this supposedly bearish event, whales have bought 30,000 BTC tokens during the first three days of August, which explains why the price bounced back.
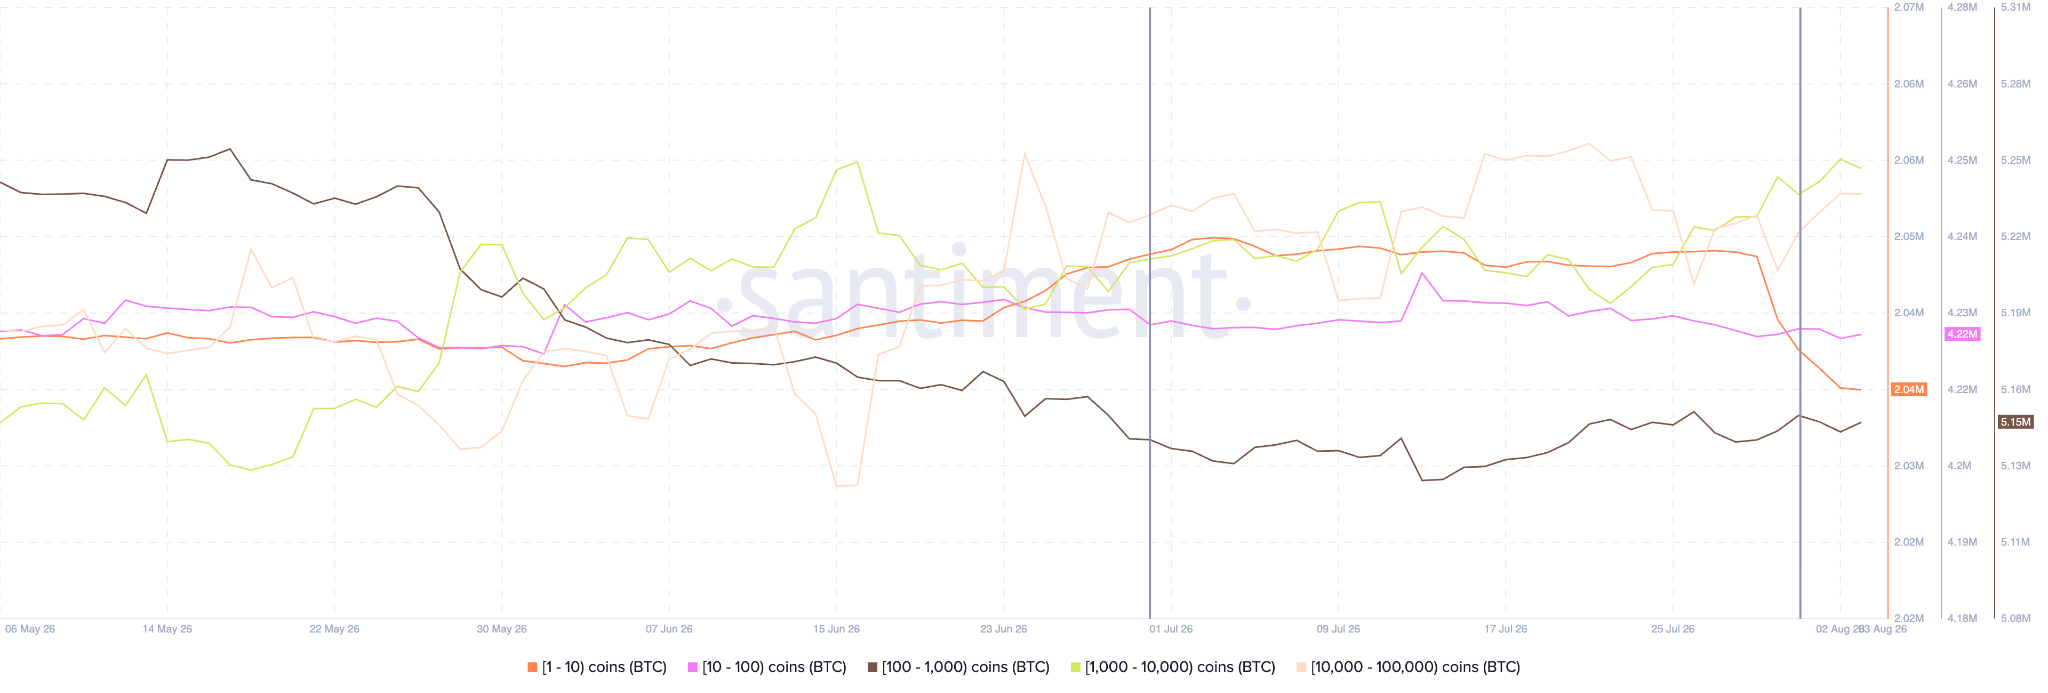
Data from Santiment shows that ultra-wealthy wallets holding between 1,000 and 100,0000 BTC bought 20,000 tokens combined, while smaller whales holding between 10 and 100 tokens bought the remaining 10,000.
None of these wallets sold BTC during this period, indicating an ongoing accumulation phase.
BTC Forms Bullish Pattern That Could Push it to Retest its Long-Term Moving Average
Heading to the daily chart, we can see that a bullish inverse head and shoulders pattern has been forming as a result of the latest price action.
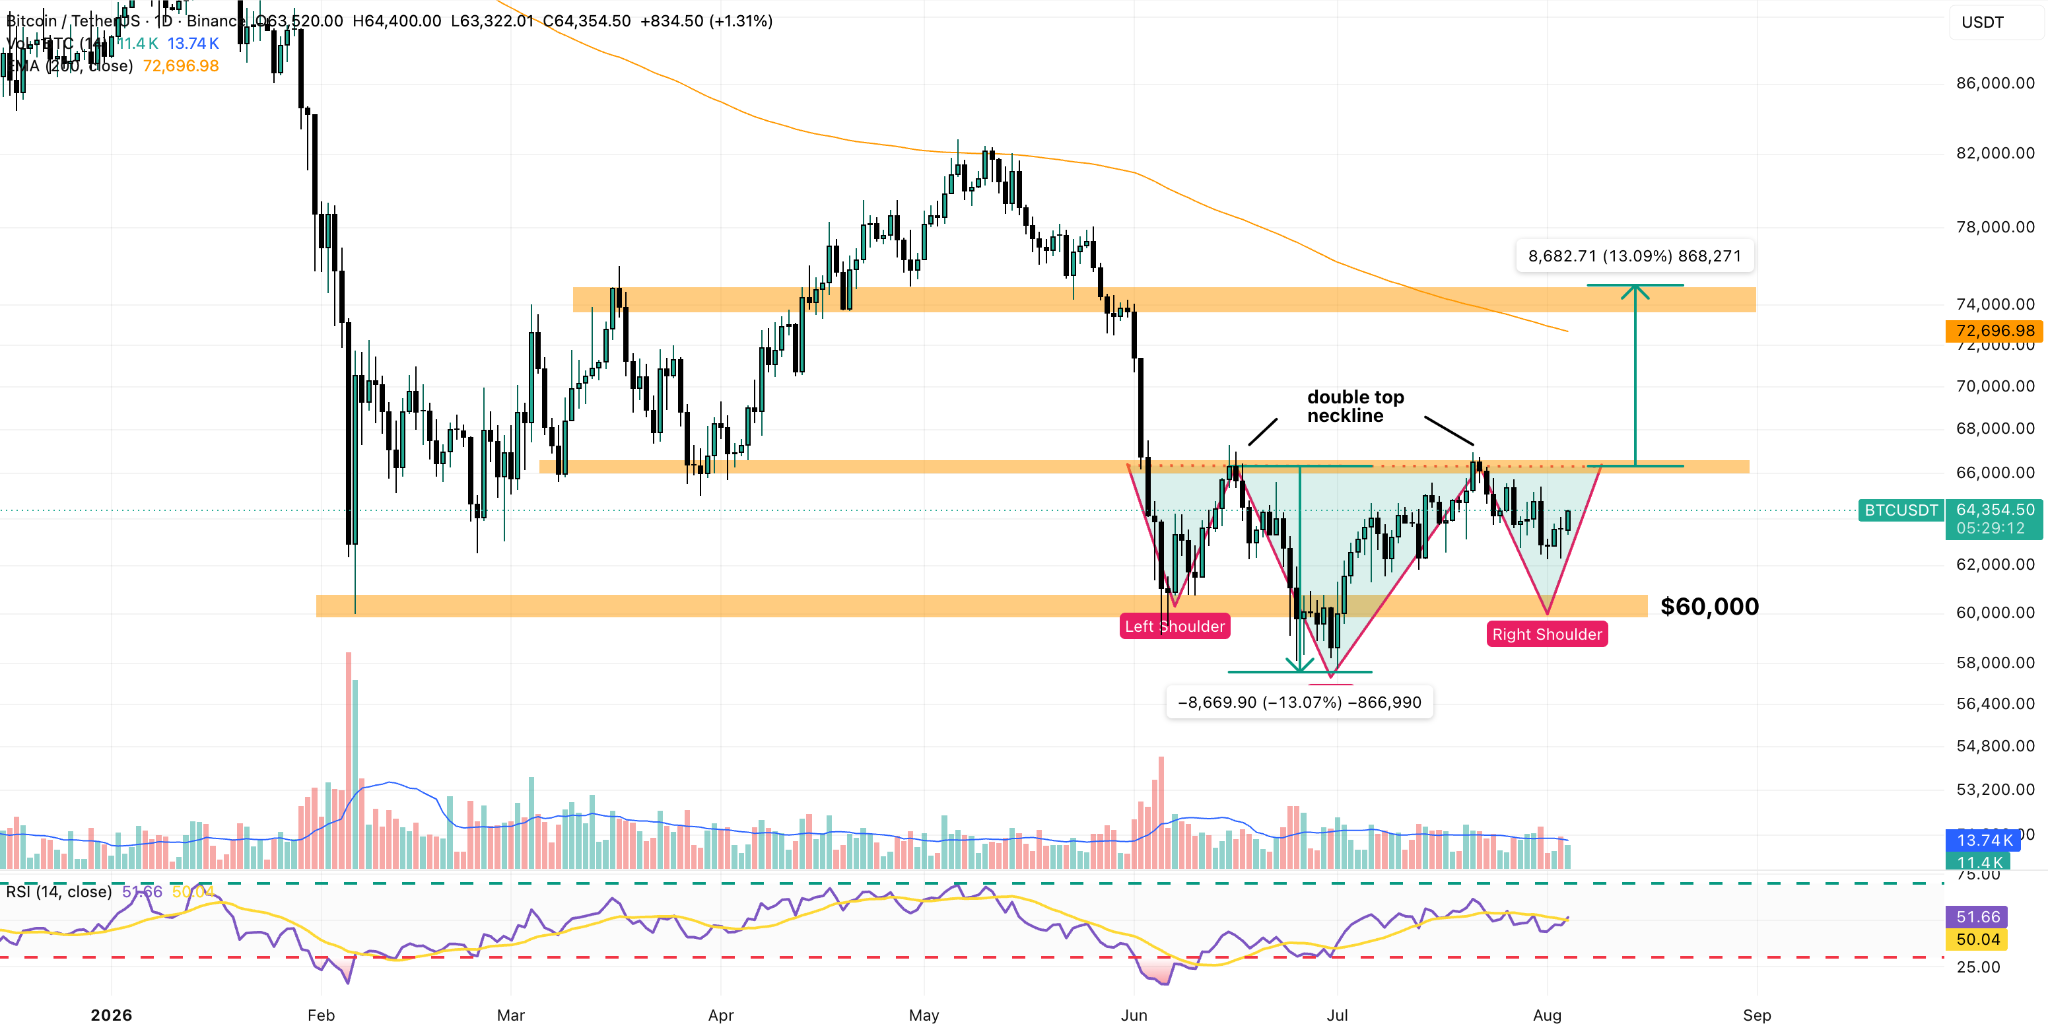
The right shoulder is still not necessarily fully formed, as the price could still plummet to $60,000. However, if we break the neckline of this setup, which currently sits at $66,000, we may see BTC rising retesting and potentially breaking the 200-day exponential moving average (EMA).
This is a relevant long-term average that thousands of traders keep track of. Whenever the price of an asset breaks above this line, it is typically interpreted as the beginning of a bullish cycle.
The last time this technical indicator was hit, Bitcoin retreated strongly off it and dropped from $82,000 to $58,000 in just a few months.
We could still get a replay of that move if market conditions do not improve or a negative catalyst, such as a larger-than-expected rate hike or failing to pass the Clarity Act, kicks in.
However, we have been repeatedly stating that both on-chain data and technical indicators seem to be telling us that we are nearing the end of this bearish cycle, or that it is over already.