Bitcoin (BTC) may face another liquidity headwind as the total stablecoin market capitalization drops sharply from its recent peak, suggesting that capital is no longer simply rotating out of BTC into dollar-pegged tokens.

Bitcoin Loses a Key Source of Crypto “Dry Powder”
As of Friday, Aug. 7, Bitcoin was up 1.18% and was trading above $65,000. Still, it’s down sharply from its highs above $126,000, and 22% from its May local high at around $82,850.
Bitcoin’s decline from May top aligns with a sharp drop in the aggregate stablecoin market cap. It has fallen to roughly $305.99 billion, about $16.46 billion, or 5.11%, below the May peak near $322.4 billion.
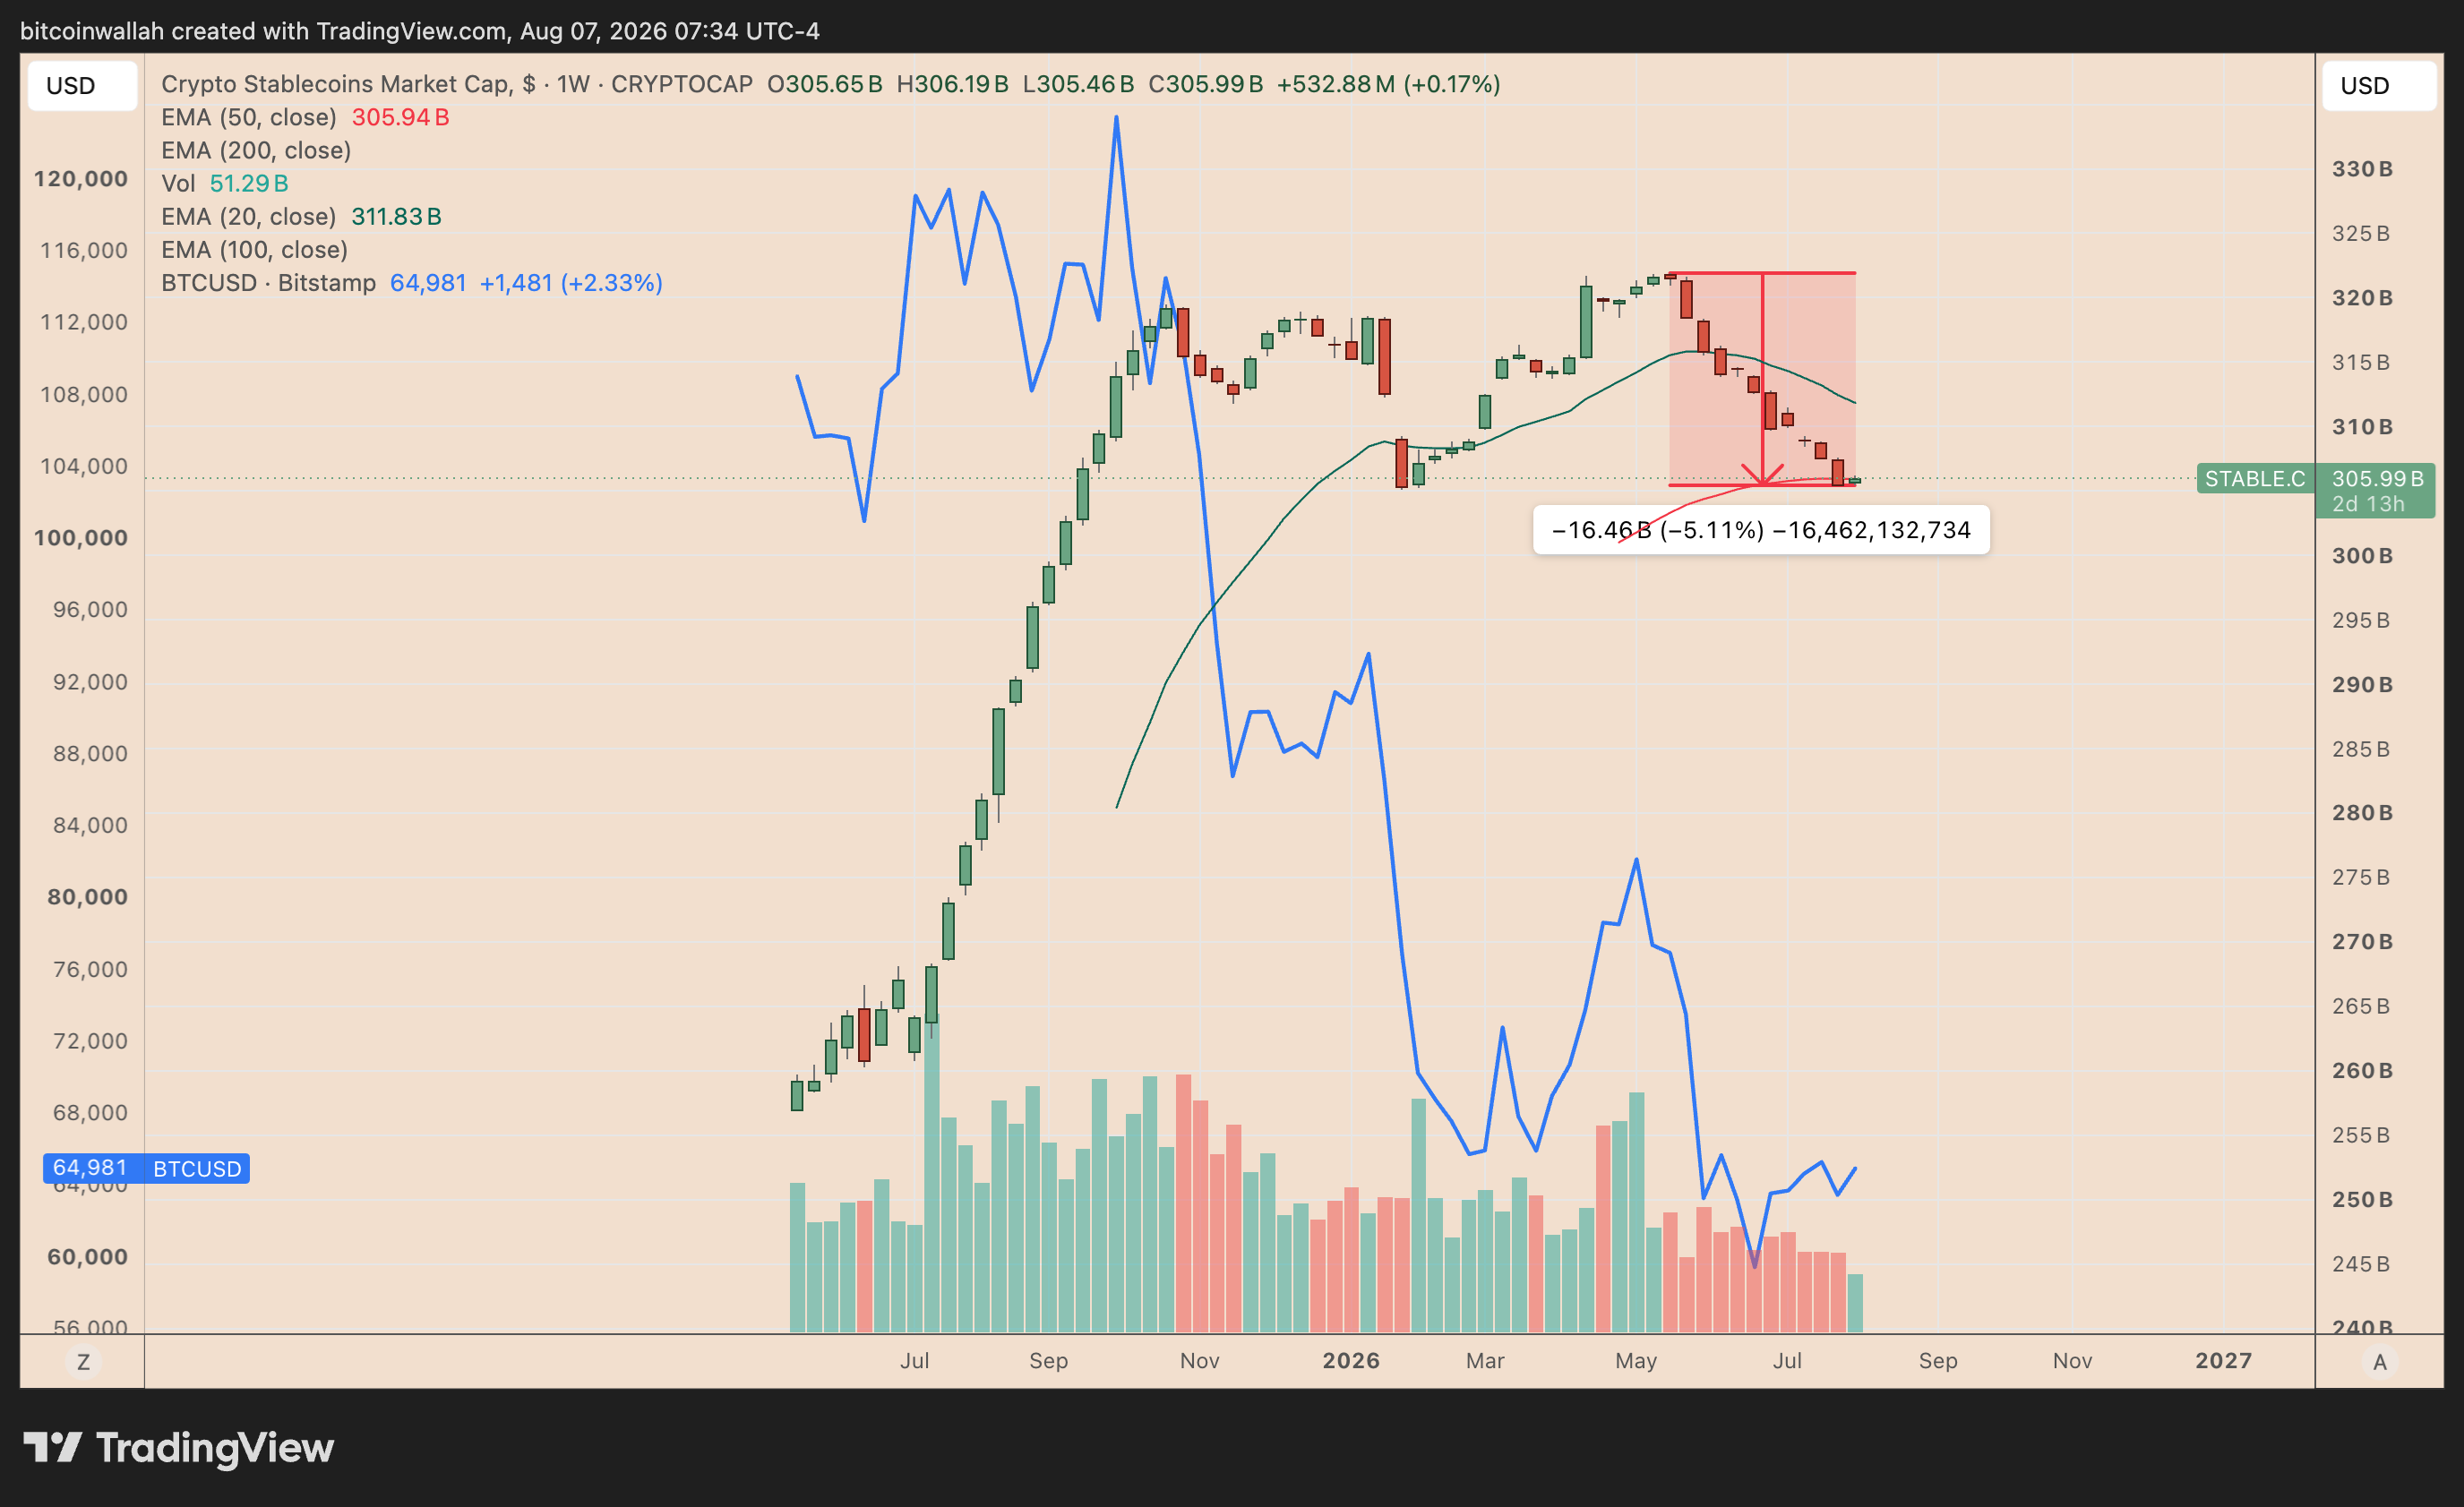
The simultaneous decline raises the possibility that some capital is now leaving the crypto ecosystem altogether, potentially reducing the dry powder available to support a sustained Bitcoin recovery.
During Bitcoin’s initial decline from above $110,000, stablecoin market capitalization continued rising toward $320–$322 billion, suggesting investors were rotating out of BTC while keeping capital within the crypto ecosystem.
That dynamic has now changed. Bitcoin remains near $65,000, while stablecoin market cap has fallen by more than $16 billion from its peak.
The shift from BTC-to-stablecoins toward BTC-to-stablecoins-to-fiat suggests that some capital may be exiting crypto altogether, reducing the pool of sidelined liquidity available to support a Bitcoin recovery.
Bitcoin Price Forecast
Every new Bitcoin analysis as it publishes, today's technical signal and key levels, live price — on one page.
See all Bitcoin forecastsBitcoin Bear Pennant Targets $45,000
Bitcoin’s daily chart is also flashing a bearish continuation setup. BTC has been consolidating inside what appears to be a bear pennant after its sharp June decline, with price now compressed near the pattern’s apex around $65,000.
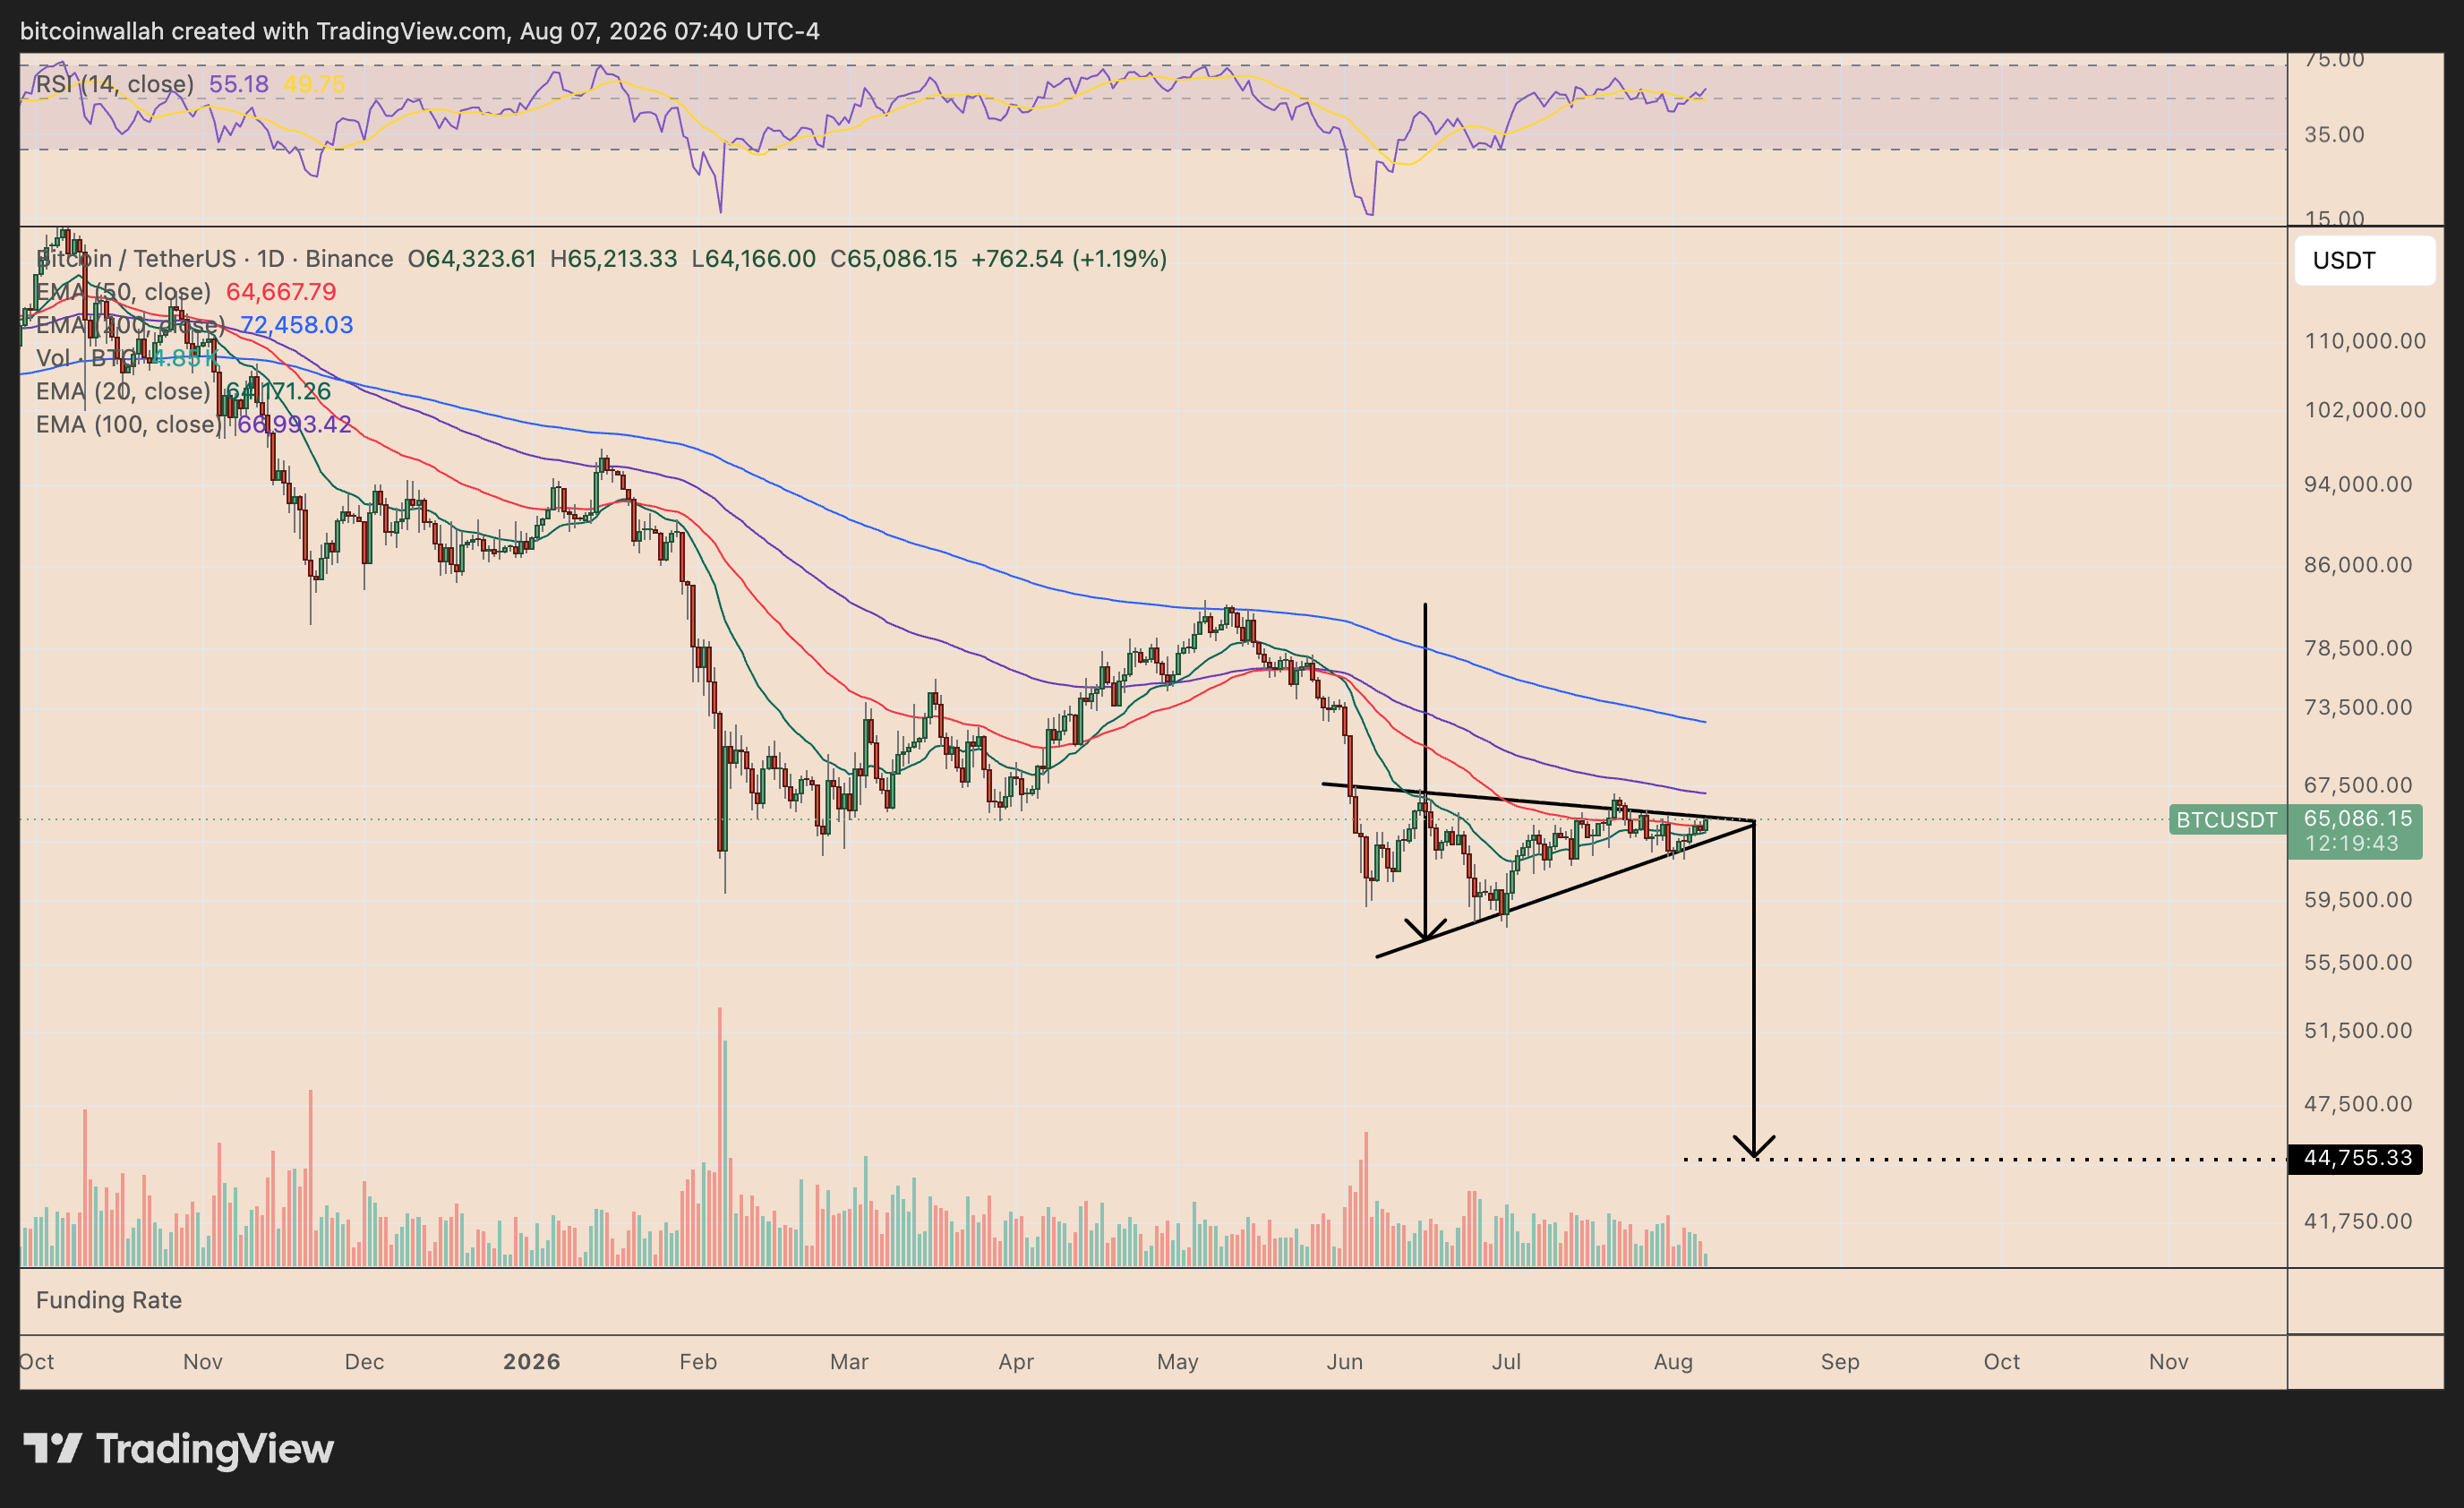
A decisive breakdown below the pennant’s rising support near $62,000–$63,000 could confirm the setup. Applying the height of the preceding sell-off to the breakdown point produces a downside target near $44,750, implying roughly a 30% decline from current levels.
Bitcoin also remains below its 50-, 100-, and 200-day EMAs, keeping the broader trend tilted toward the bearish side.