Key Insights:
- On Monday, bitcoin (BTC) fell by 1.54% to end the day at sub-$21,000 for a second session.
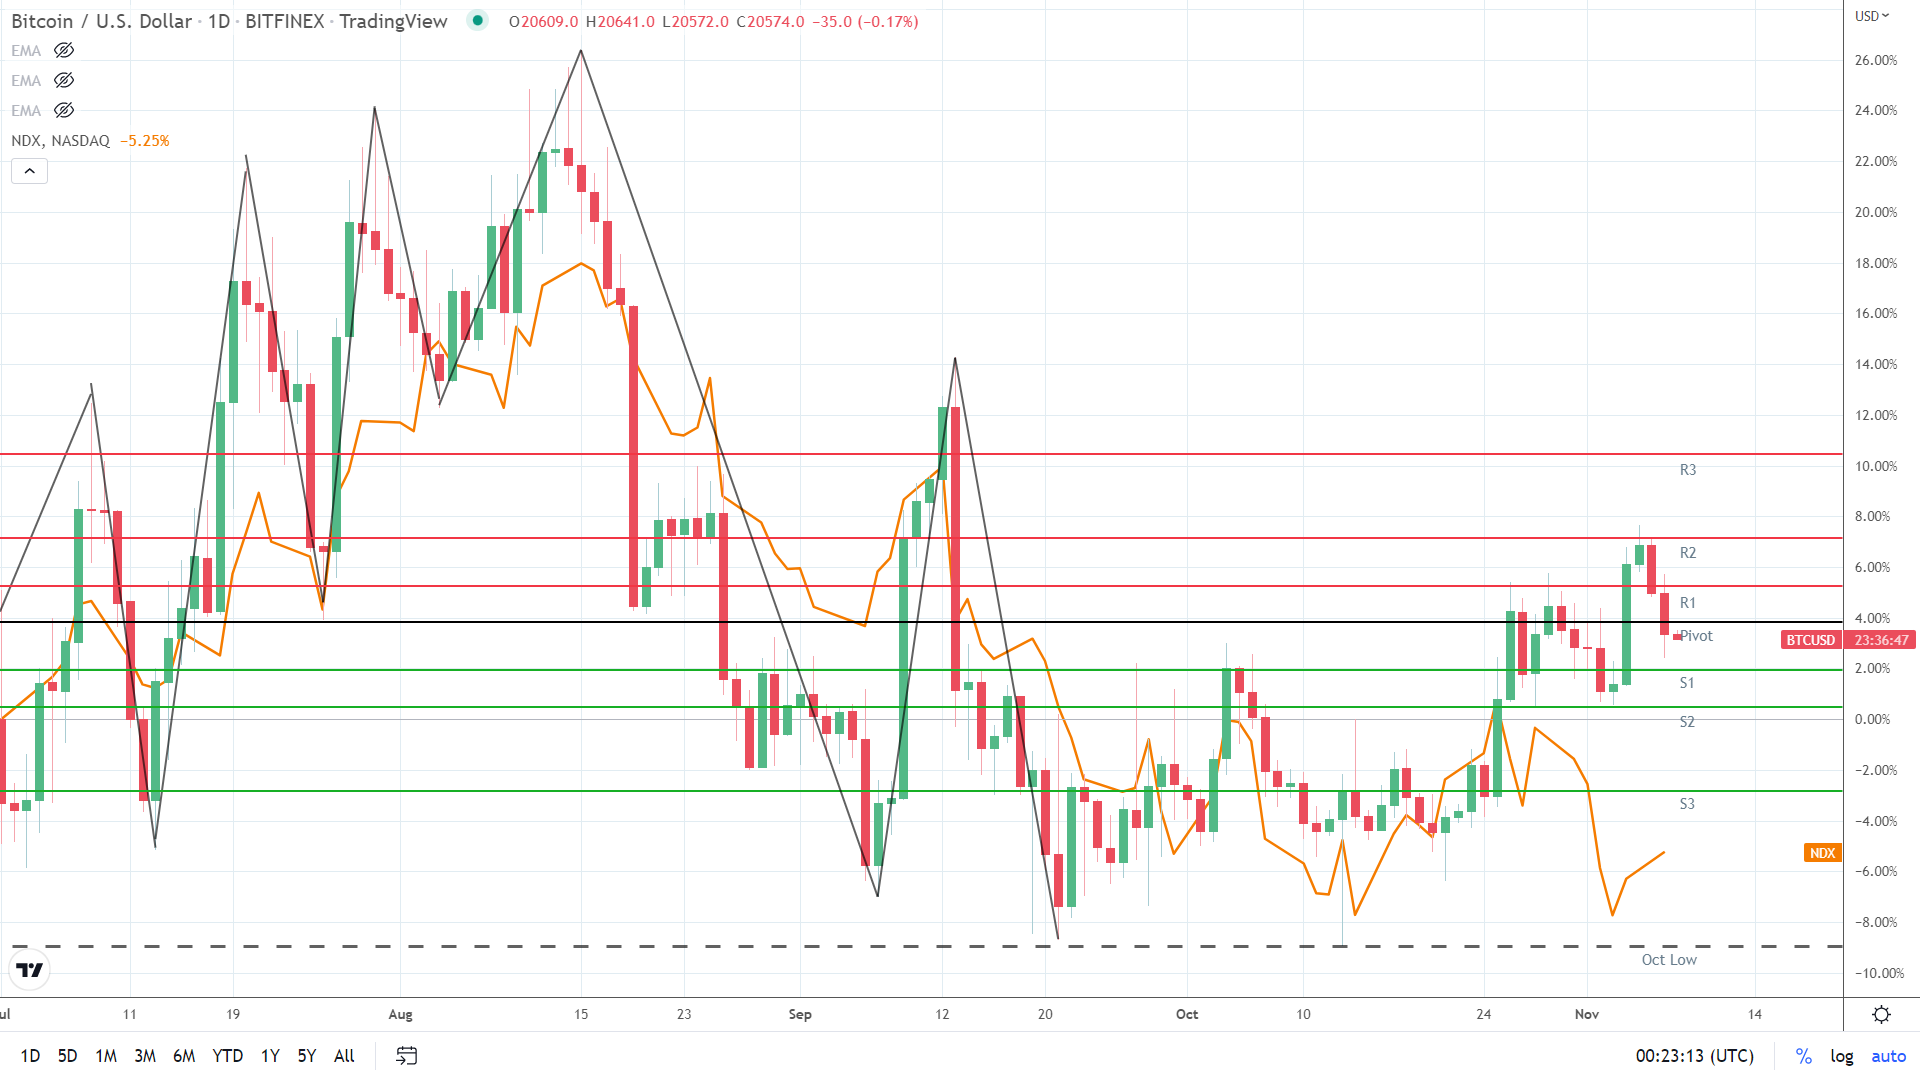
- BTC and the broader market decoupled from the NASDAQ Composite Index, with crypto investors eying this week’s US CPI report.
- The Bitcoin Fear & Greed Index slipped from 33/100 to 31/100, weighed by the bearish BTC session.
On Monday, bitcoin (BTC) fell by 1.54%. Following a 1.79% decline on Sunday, BTC ended the day at $20,609. Notably, BTC ended the day at sub-$21,000 for the second consecutive session.
A mixed start to the day saw BTC rise to an early high of $21,083. Coming up short of the First Major Resistance Level (R1) at $21,240, BTC slid to a late low of $20,421. BTC fell through the First Major Support Level (S1) at $20,762 and the Second Major Support Level (S2) at $20,592 before a partial recovery to $20,609.
A quiet US economic calendar left BTC on the back foot. This week, US inflation, retail sales, and consumer sentiment numbers will influence market sentiment towards the US economy and a December Fed pivot.
However, the NASDAQ Composite Index rose by 0.85% on Monday, with sentiment toward the US Mid-Terms delivering support. Later today, it is another quiet day on the US economic calendar, which will leave investors in limbo as the focus remains on the Mid-Terms. This morning, the NASDAQ mini was up 15.5 points.

The Fear & Greed Index Slips to 31/100 on Another Bearish BTC Session
This morning, the Fear & Greed Index slipped from 33/100 to 31/100. Another bearish BTC session led to the Index down, though the fall was modest as BTC avoided sub-$20,000.
A lack of US economic indicators left Fed monetary policy plans for December to influence. While market bets of a Fed pivot have risen, the FedWatch Tool reflects uncertainty toward the December move.
This morning, the probability of a 75-basis point December rate hike stood at 43.2%, up from 38.5% on Friday.
The Index would need to avoid sub-30/100 to support a return to 40 and a move into the neutral zone. However, a fall to sub-20/100 would signal a BTC slide to sub-$18,000.
Bitcoin Price Forecast
Every new Bitcoin analysis as it publishes, today's technical signal and key levels, live price — on one page.
See all Bitcoin forecasts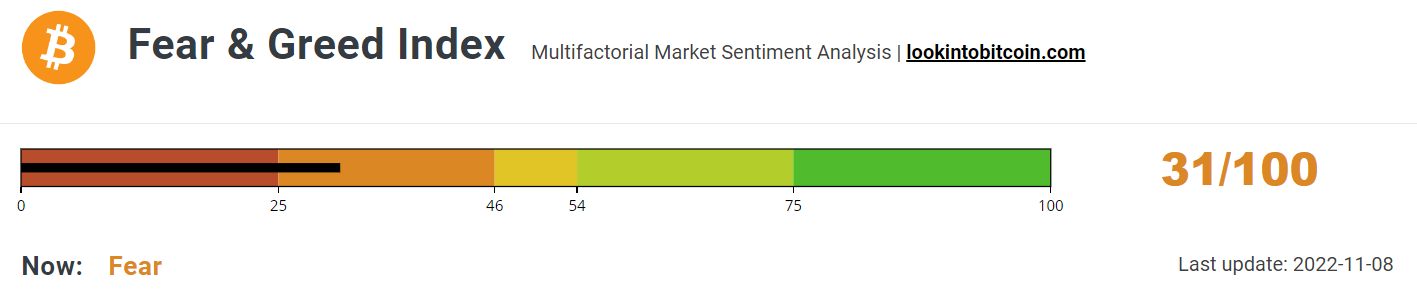
Bitcoin (BTC) Price Action
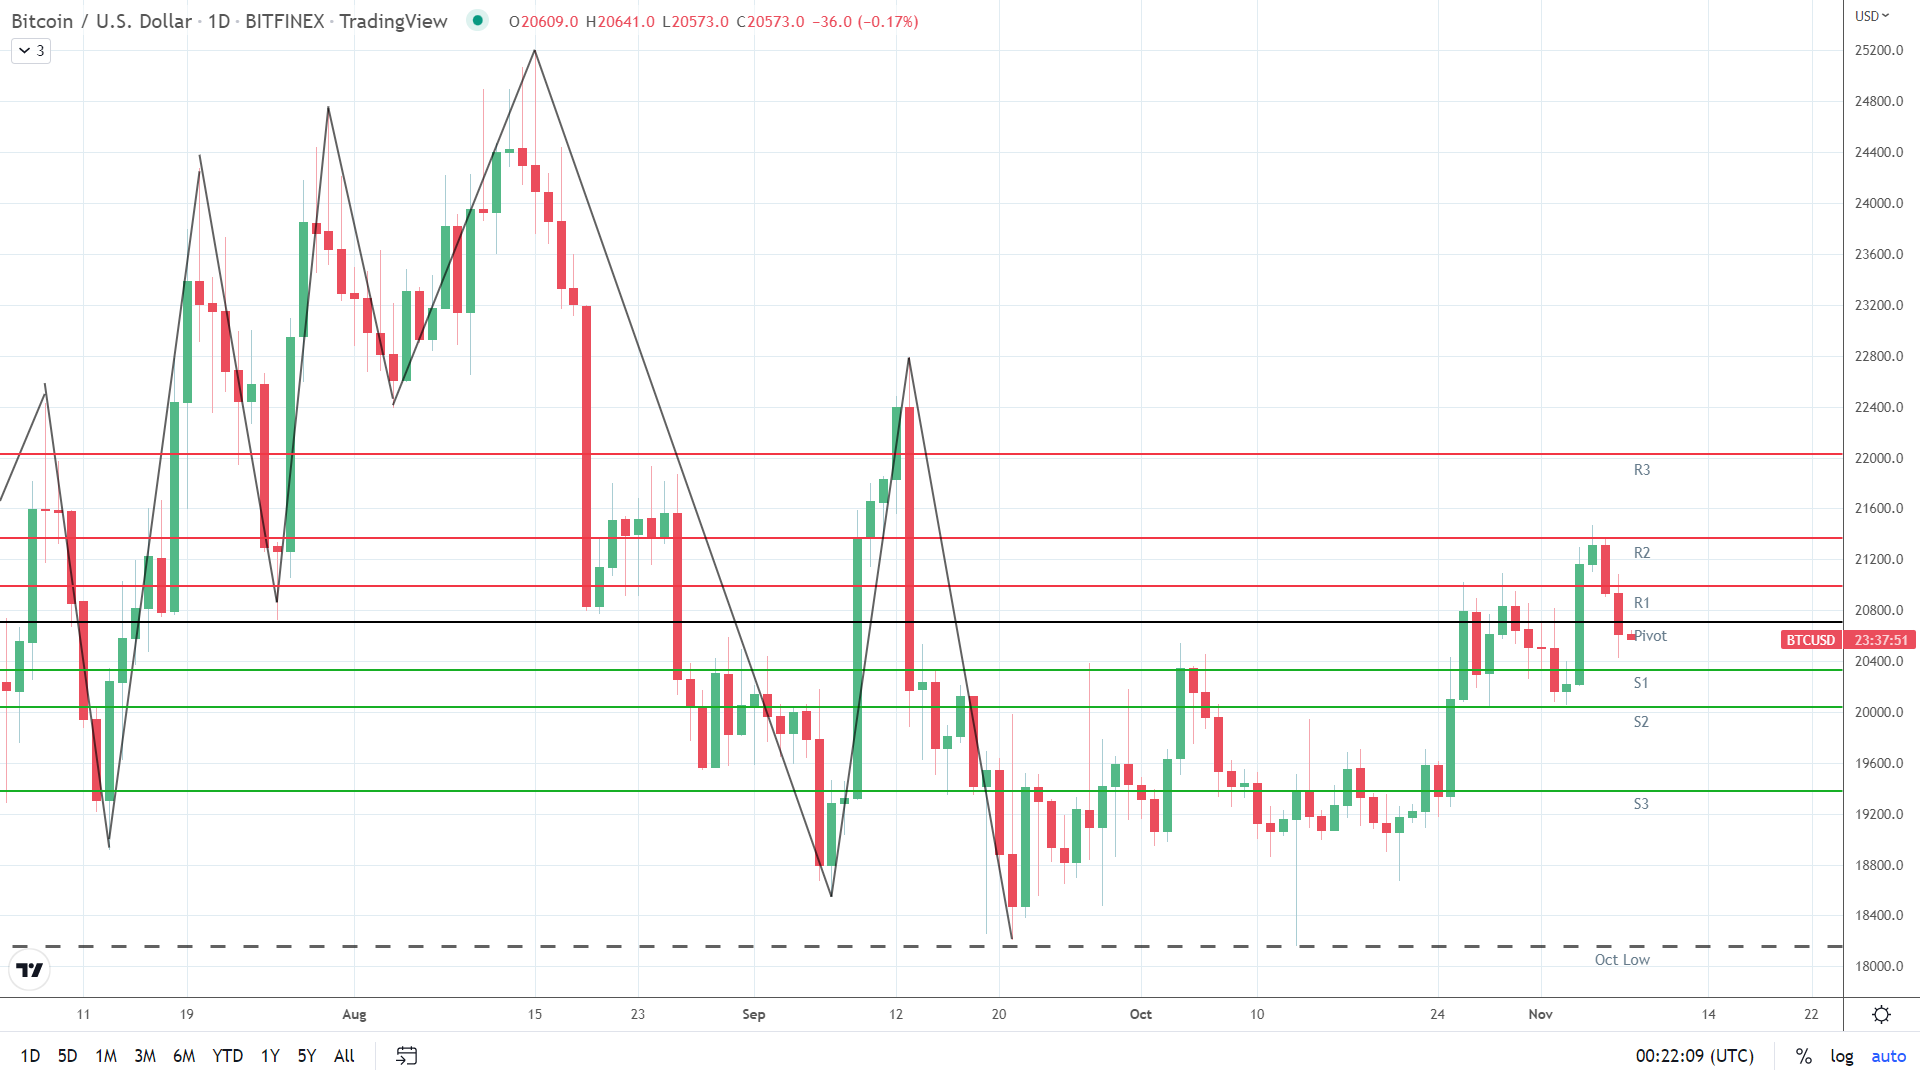
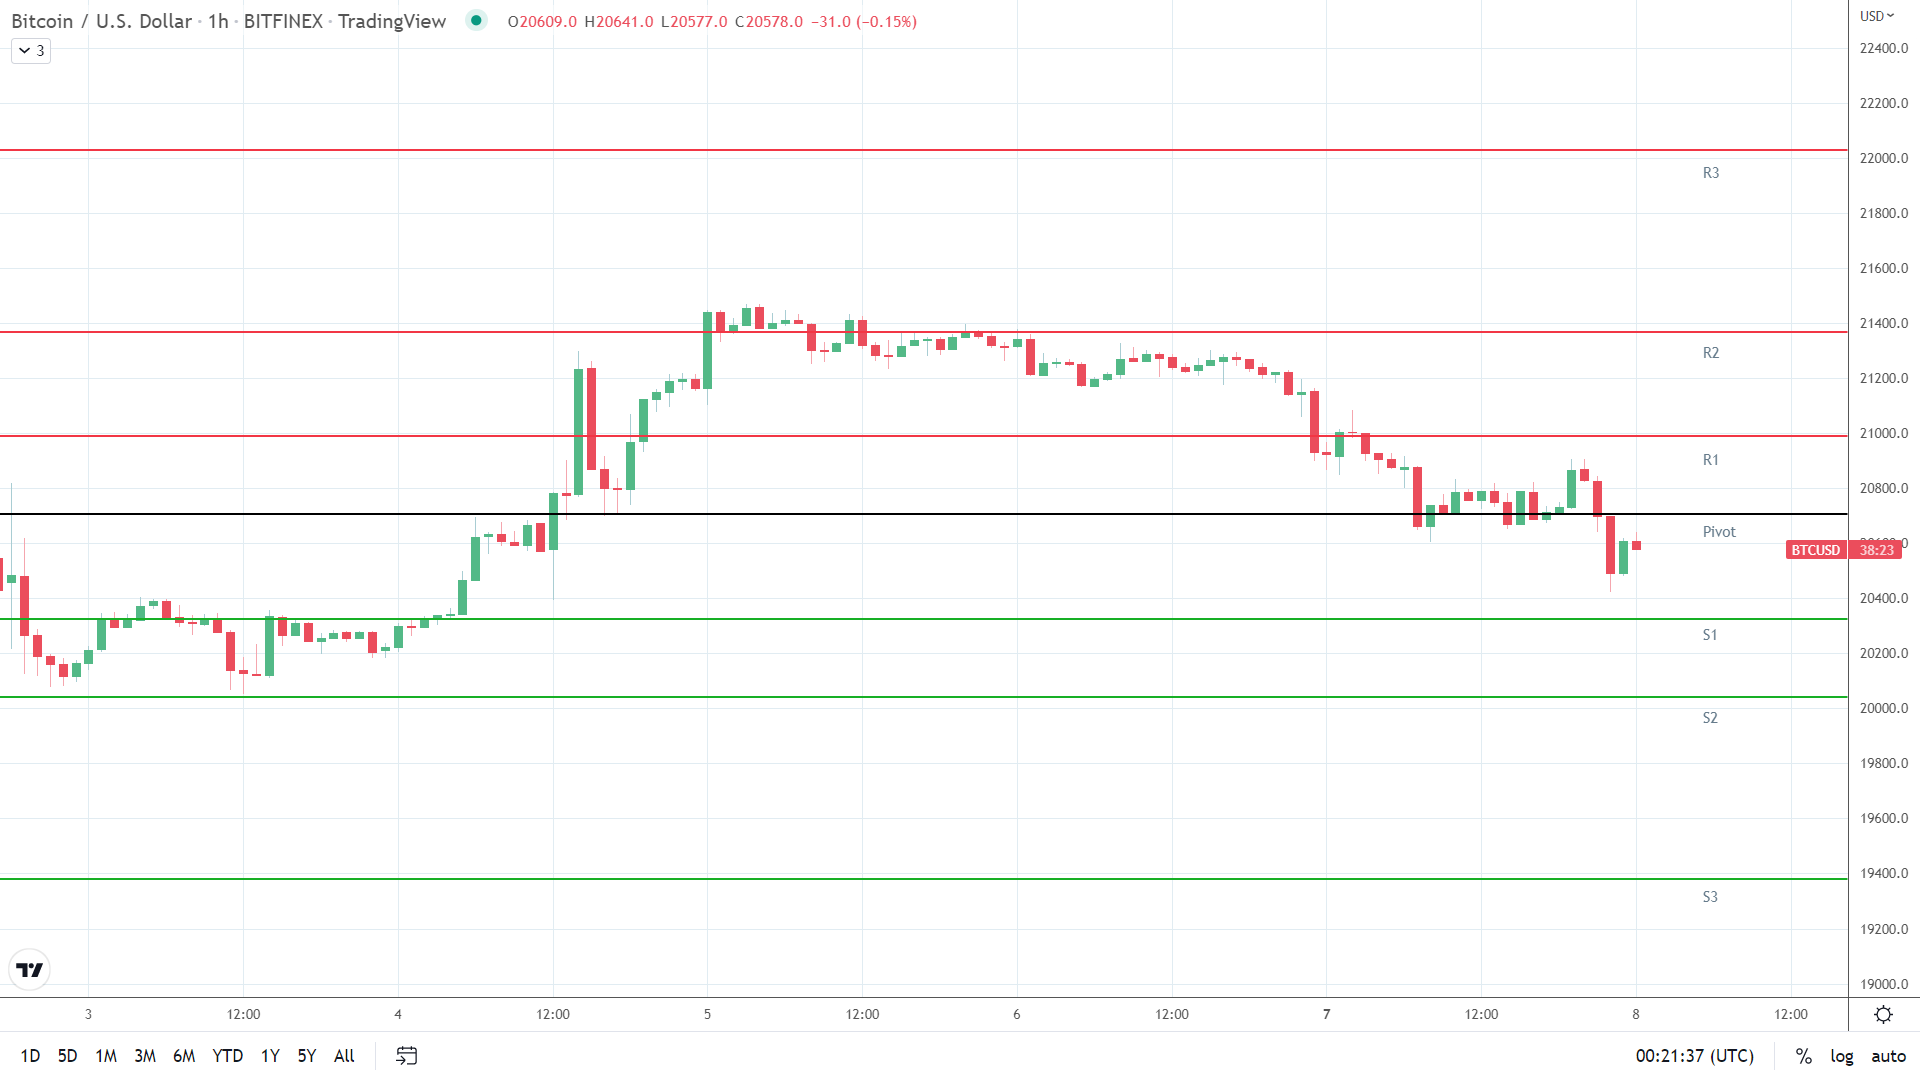
At the time of writing, BTC was down 0.17% to $20,573. A range-bound start to the day saw BTC rise to an early high of $20,641 before falling to a low of $20,573.
Technical Indicators
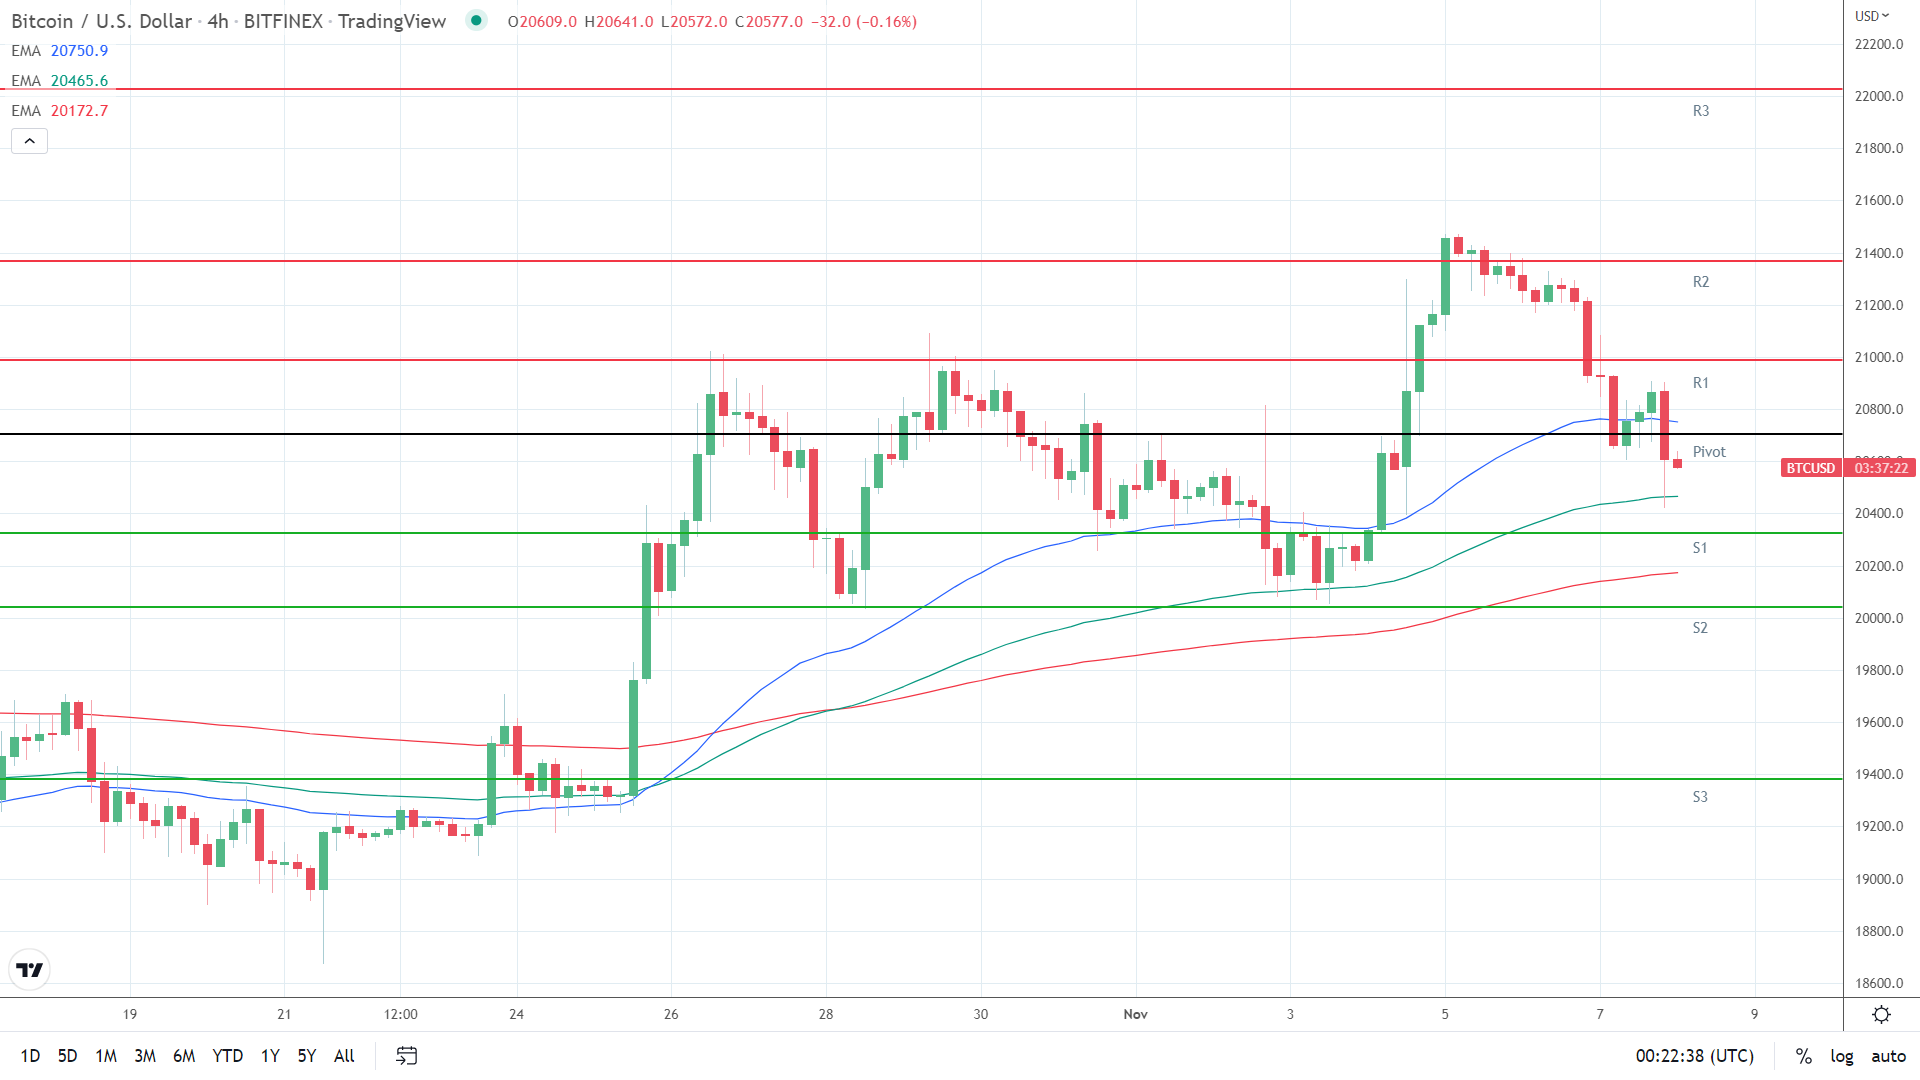
BTC needs to move through the $20,704 pivot to target the First Major Resistance Level (R1) at $20,988 and the Monday high of $21,083. A return to $20,750 would signal a possible breakout session.
In the case of an extended rally, the Second Major Resistance Level (R2) at $21,366 and resistance at $21,500 would likely come into play. The Third Major Resistance Level (R3) sits at $22,028.
Failure to move through the pivot would leave the First Major Support Level (S1) at $20,326 in play. Barring another extended sell-off, BTC should avoid sub-$20,000. The Second Major Support Level (S2) at $20,042 should limit the downside.
The Third Major Support Level (S3) sits at $19,380.
Looking at the EMAs and the 4-hourly candlestick chart (below), it was a bullish signal. This morning, bitcoin sat above the 100-day EMA, currently at $20,466. The 50-day EMA narrowed to the 100-day EMA, while the 100-day EMA widened from the 200-day EMA to deliver mixed signals.
A move through the 50-day EMA ($20,751) would support a breakout from R1 ($20,988) to target R2 ($21,366) and $21,500. However, a fall through the 100-day EMA ($20,466) would bring S1 ($20,326) and the 200-day EMA ($20,173) into view.