Key Insights:
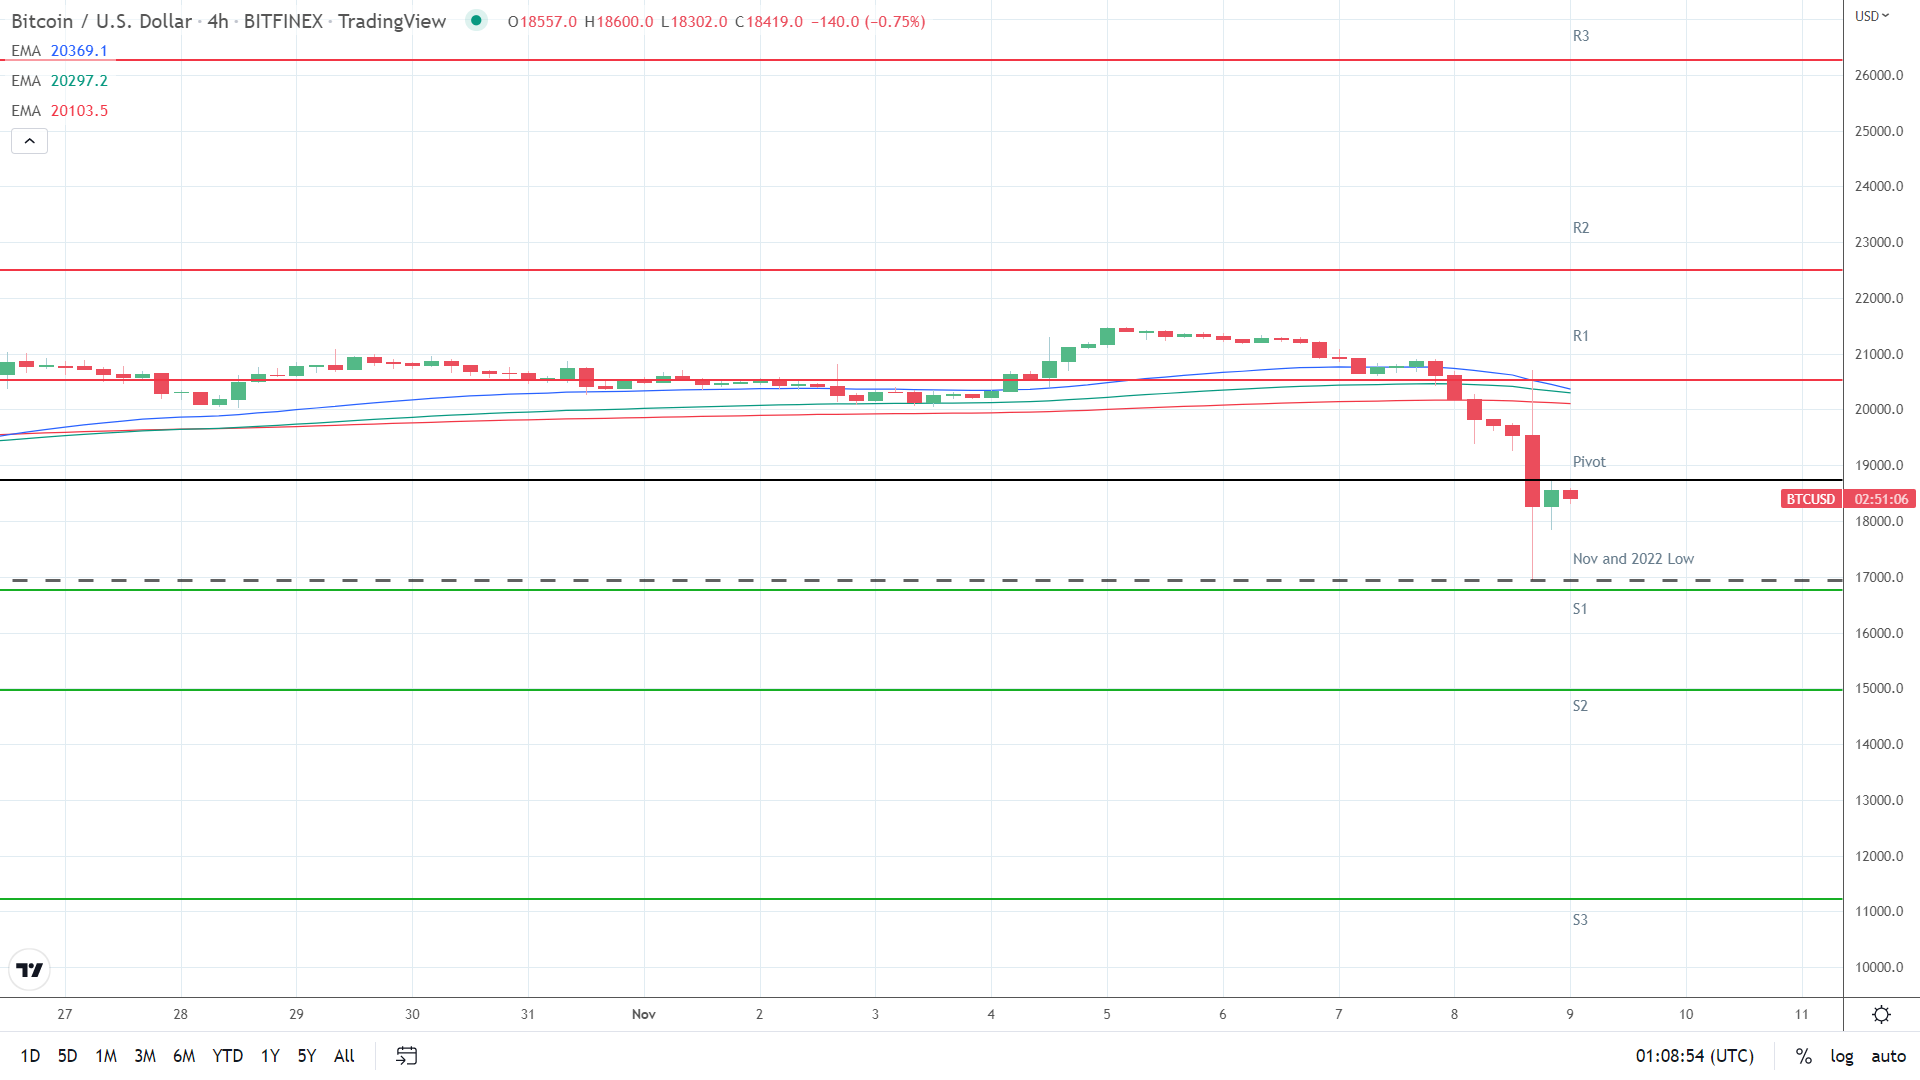
- On Tuesday, bitcoin (BTC) tumbled to its lowest level since November 2020 before a partial recovery to end the day at $18,559.
- News of FTX facing a liquidity challenge and the eventual collapse of FTT and Binance buyout announcement left BTC at sub-$19,000.
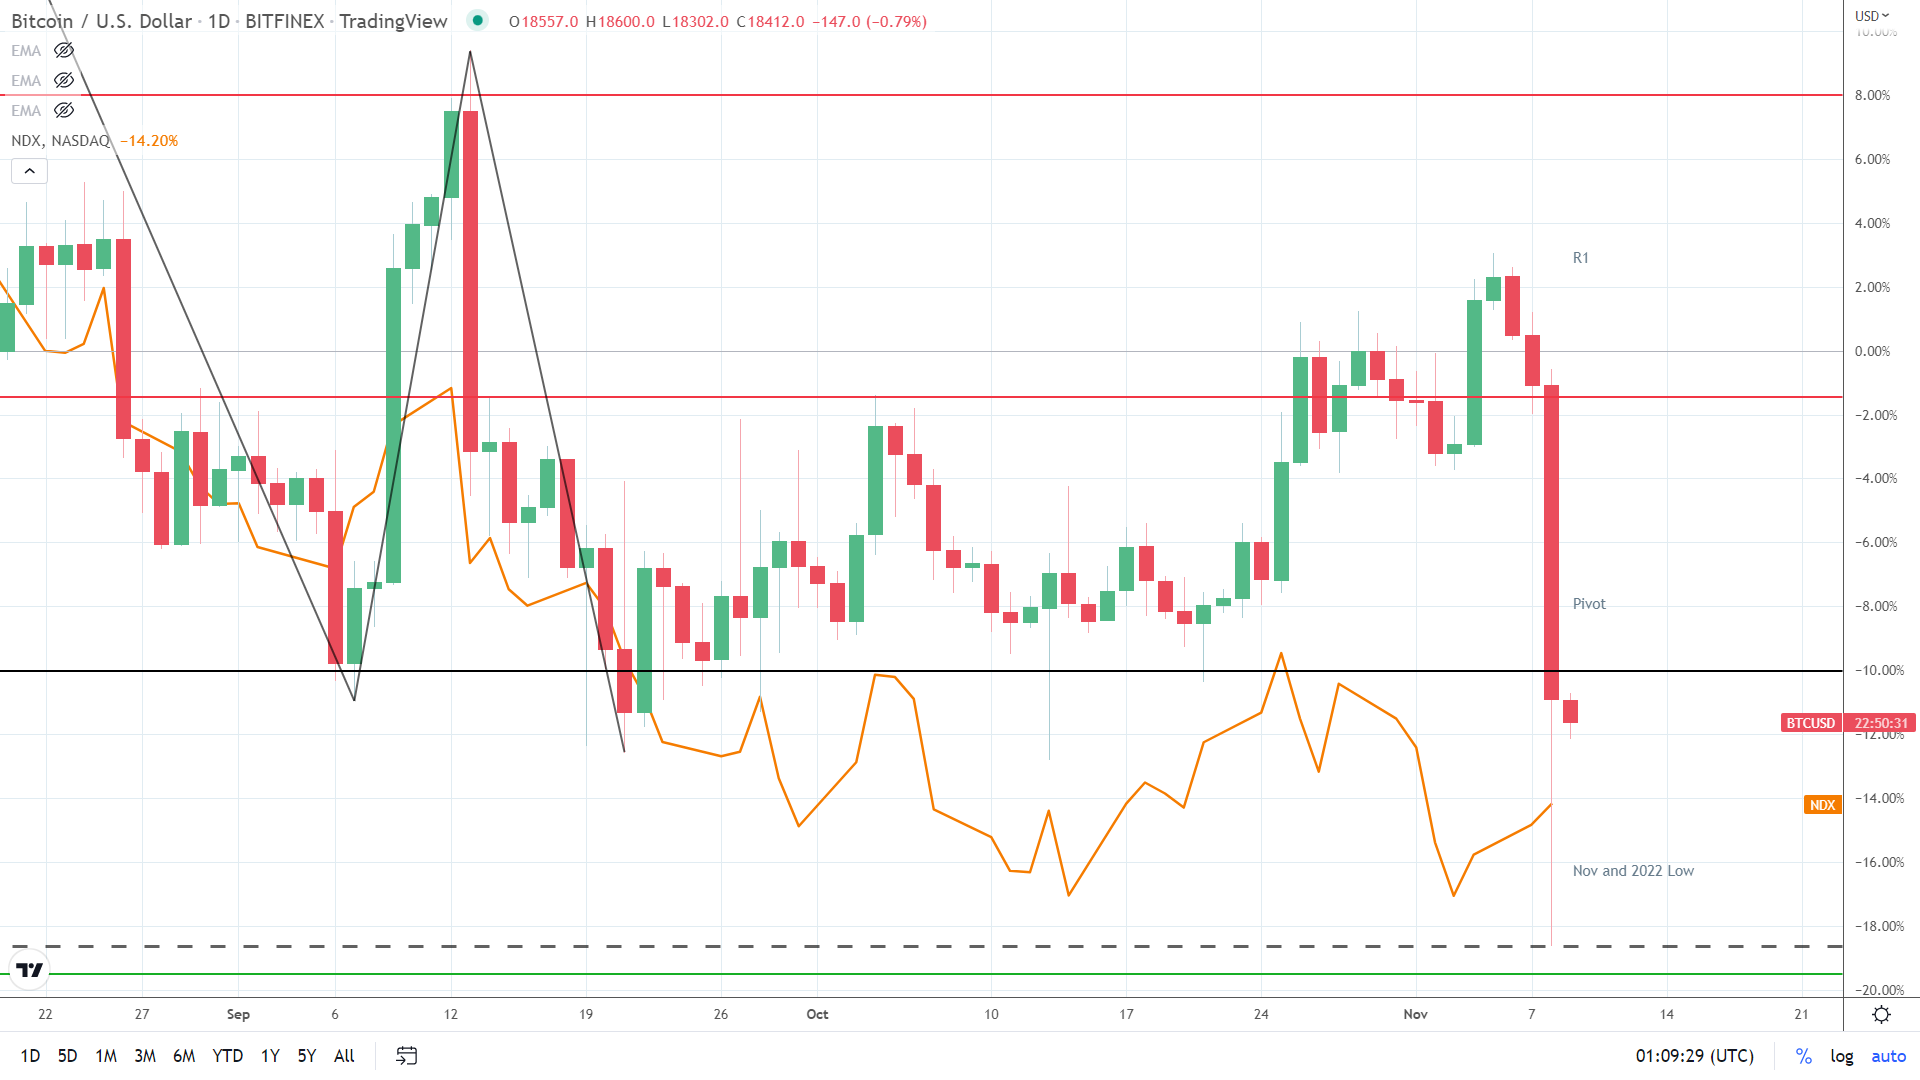
- The Bitcoin Fear & Greed Index slipped from 31/100 to 29/100, weighed by the BTC visit to sub-$17,000.
On Tuesday, bitcoin (BTC) slid by 9.95%. Following a 1.54% loss on Monday, BTC ended the day at $18,559. Notably, BTC extended its losing streak to three sessions and visited sub-$17,000 for the first time since November 2020.
After a bearish morning, BTC rose to a late afternoon high of $20,712. Coming up short of the First Major Resistance Level (R1) at $20,988, BTC tumbled to a late low of $16,950. BTC fell through the day’s Major Support Levels. Despite a partial recovery to end the day at $18,559, BTC failed to move back through the Third Major Support Level (S3) at $19,380.
News updates on the FTX – Binance feud fueled the bearish session. However, market conditions deteriorated on news of FTX facing a liquidity crunch, raising contagion fears. While reports of Binance planning to acquire FTX provided some comfort, contagion fears and the prospects of increased regulatory scrutiny sent BTC deeper into the red.
By contrast, the NASDAQ Composite Index rose by 0.49% on Tuesday, with sentiment toward the US Mid-Terms delivering support. Following the collapse of FTX, BTC will likely remain uncoupled with the NASDAQ until the full extent of the damage is known. This morning, the NASDAQ mini was up 15.5 points.

The Fear & Greed Index Slips to Sub-30/100 on BTC Partial Recovery
This morning, the Fear & Greed Index slipped from 31/100 to 29/100. Another bearish session led to the Index fall, though the downside was modest despite BTC sliding to sub-$17,000.
The collapse of FTX was the primary force behind the market sell-off and the Index return to sub-30. For the day ahead, investors will be looking for any contagion news, which would send BTC and the Index into another reversal.
The Index would need to avoid sub-20/100 to support a return to 40 and a move into the neutral zone. However, a fall to sub-20/100 would signal a BTC return to sub-$17,000.
Bitcoin Price Forecast
Every new Bitcoin analysis as it publishes, today's technical signal and key levels, live price — on one page.
See all Bitcoin forecasts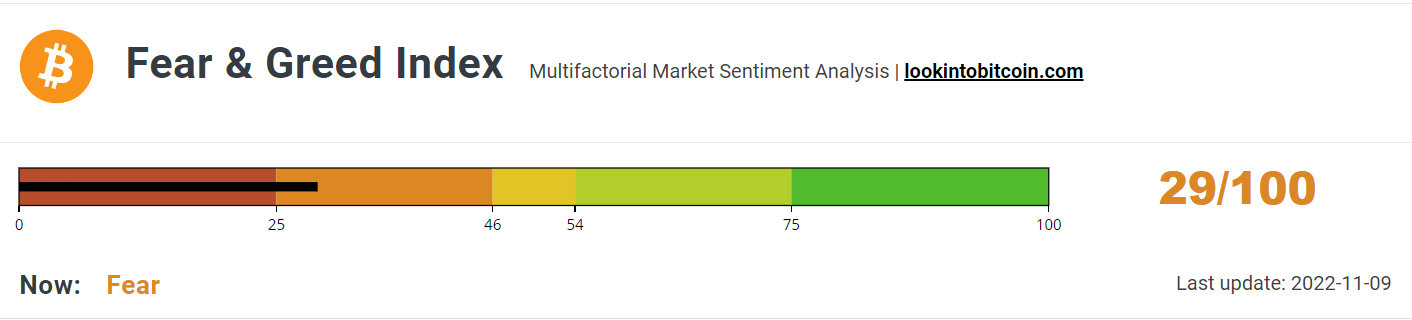
Bitcoin (BTC) Price Action
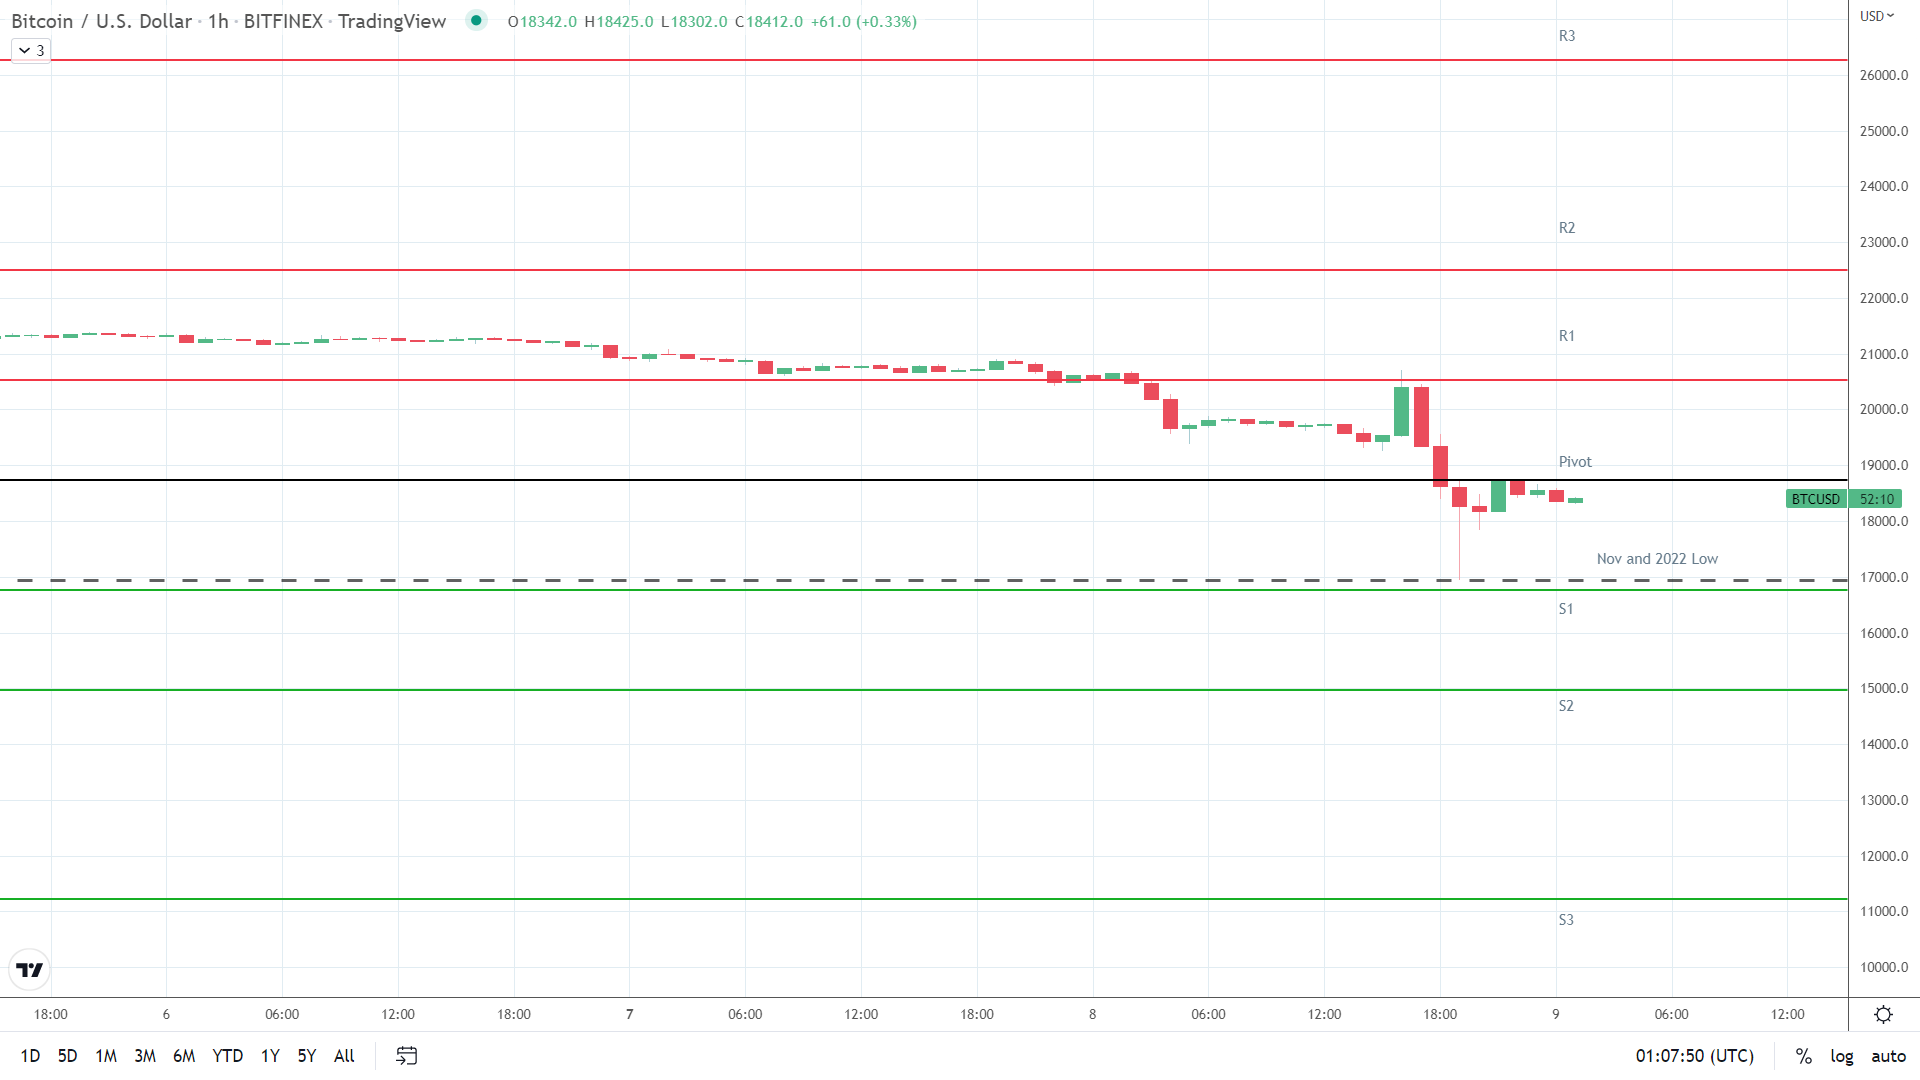
At the time of writing, BTC was down 0.76% to $18,418. A range-bound start to the day saw BTC rise to an early high of $18,600 before falling to a low of $18,302.
Technical Indicators
BTC needs to move through the $18,740 pivot to target the First Major Resistance Level (R1) at $20,531 and the Monday high of $20,712. A return to $19,500 would signal a possible BTC rebound.
In the case of an extended rally, BTC would likely test resistance at $21,000 but fall short of the Second Major Resistance Level (R2) at $22,502.
The Third Major Resistance Level (R3) sits at $26,264.
Failure to move through the pivot would leave the First Major Support Level (S1) at $16,769 in play. Barring another extended sell-off, BTC should avoid sub-$16,000 and the Second Major Support Level (S2) at $14,978.
The Third Major Support Level (S3) sits at $11,216.
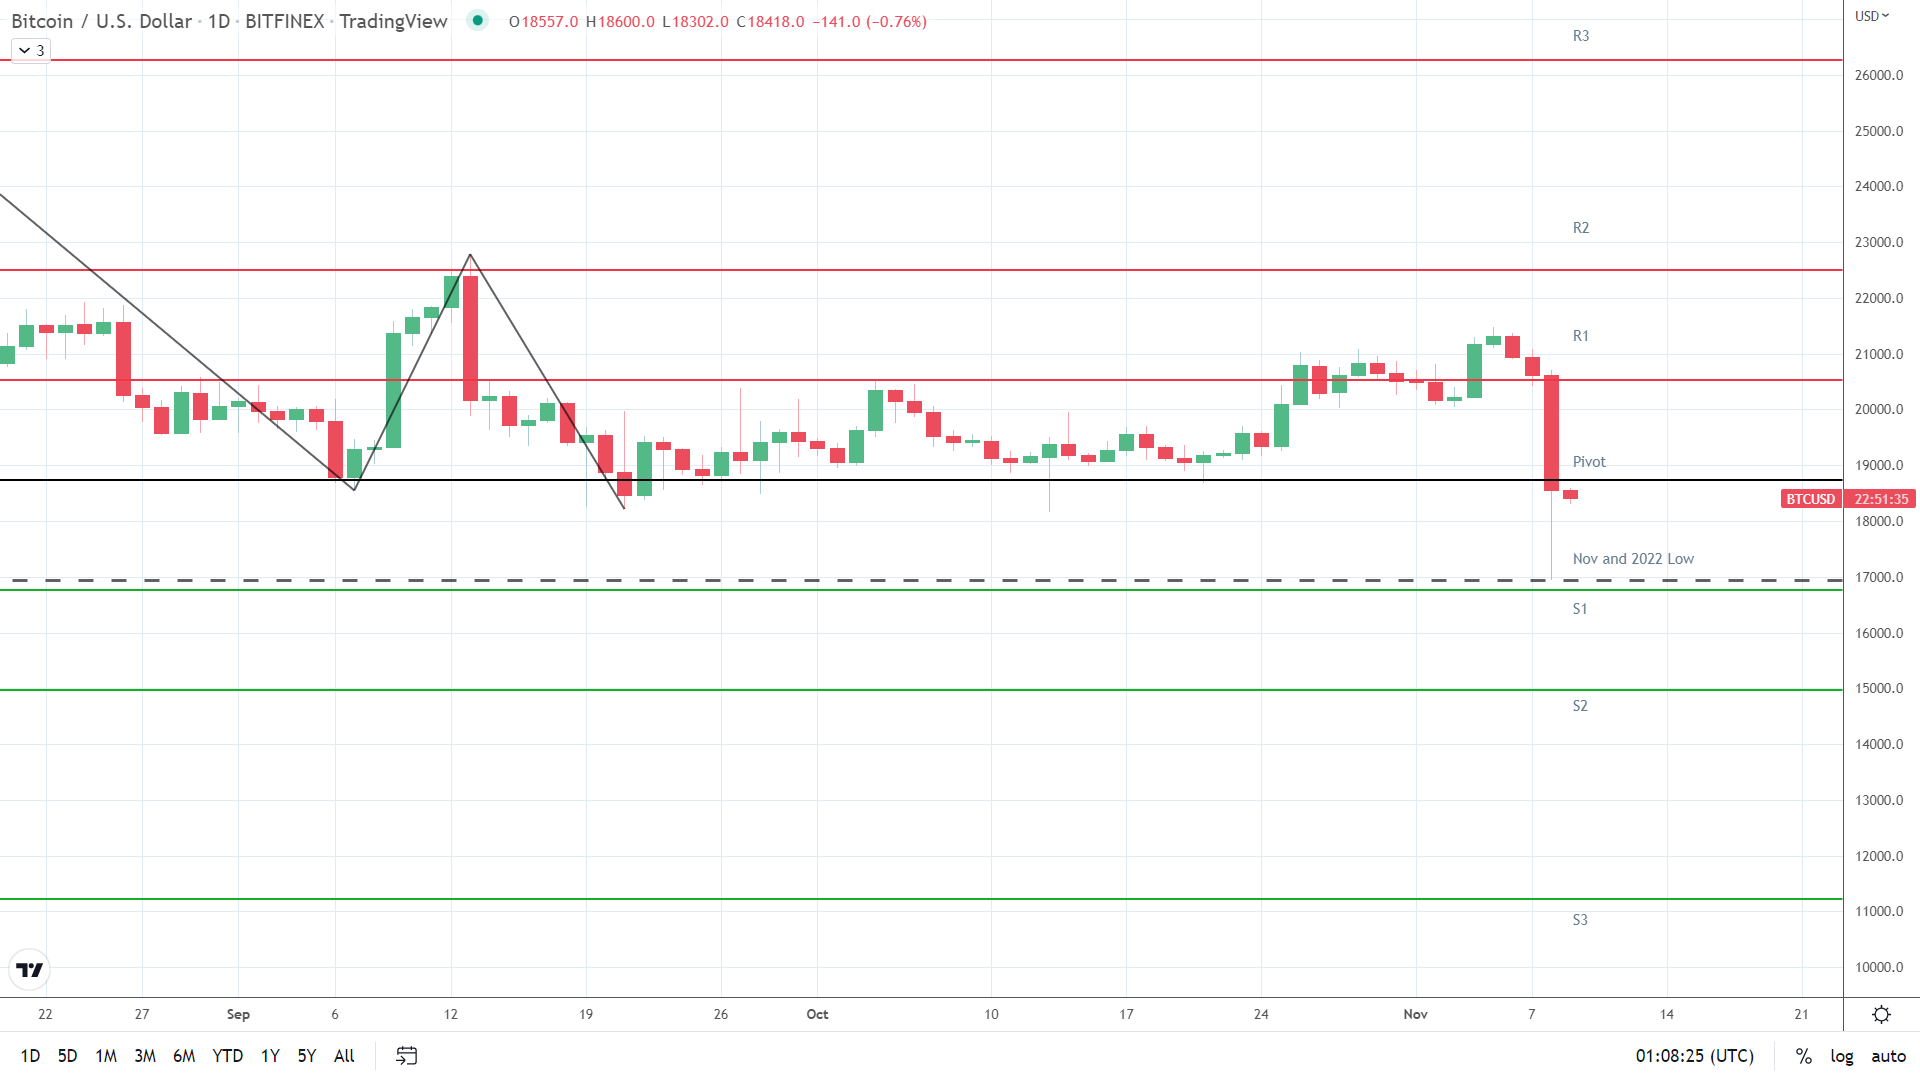
Looking at the EMAs and the 4-hourly candlestick chart (below), it was a bearish signal. This morning, bitcoin sat below the 200-day EMA, currently at $20,104. The 50-day EMA converged on the 100-day EMA, with the 100-day EMA narrowing to the 200-day EMA, delivering bearish signals.
A move through the 200-day EMA ($20,104) would support a breakout from the 100-day and 50-day EMAs to target R1 ($20,531). However, a failure to move through the 200-day EMA ($20,104) would bring the Tuesday low of $16,950 and S1 ($16,769) in view.