


Breakout Attempt Meets Resistance
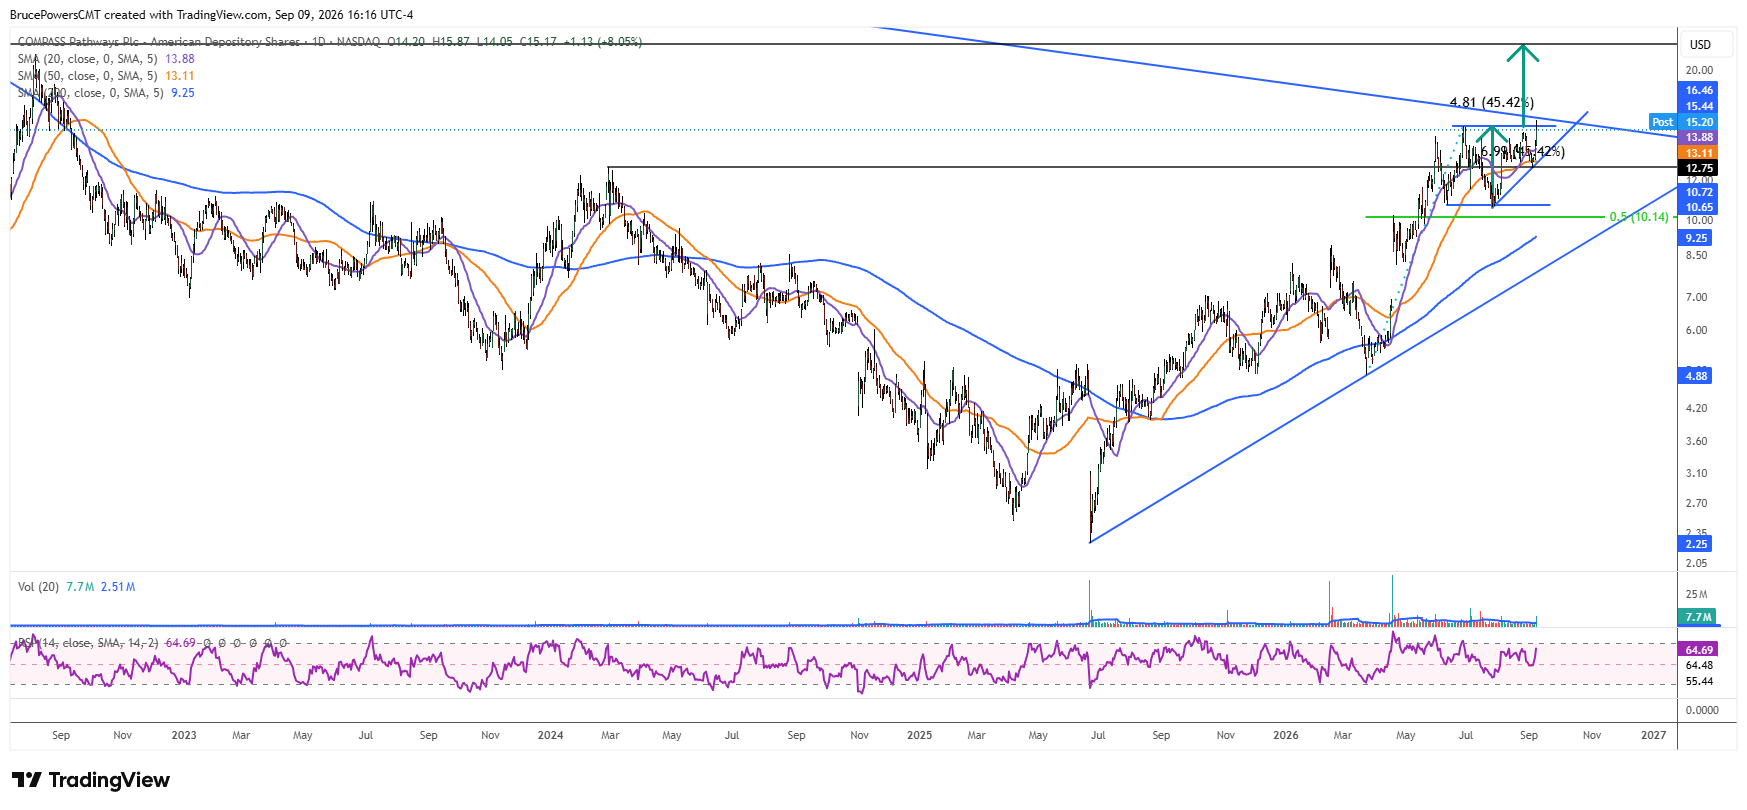
Compass Pathways plc (CMPS), a late-stage psychedelic biotech company, attempted to break out of a three-month basing pattern on Wednesday, with volume spiking to a 23-day high during the advance. The consolidation base followed a constructive advance to a high of $15.40 on June 9. That high was exceeded on Wednesday with CMPS reaching a new trend high of $15.87 before signs of resistance halted the advance.
The breakout has not yet been confirmed, as Wednesday closed back below the prior high at $15.40. A daily close above the recent lower swing high of $15.01 did confirm on Wednesday, as the stock closed above that level at 15.17. The combination of strong volume and a new trend high nevertheless keeps the breakout setup in focus.
Positive Data Supports Upside Momentum
The advance was in response to the company releasing positive 52-week topline data from Part C of its Phase 3 COMP005 trial of COMP360, its synthetic psilocybin treatment for treatment-resistant depression. Commercial launch of the product is estimated for the first half of 2027. The fundamental catalyst has therefore added momentum to a technical setup that was already improving.
Upper Trendline Becomes Key Test
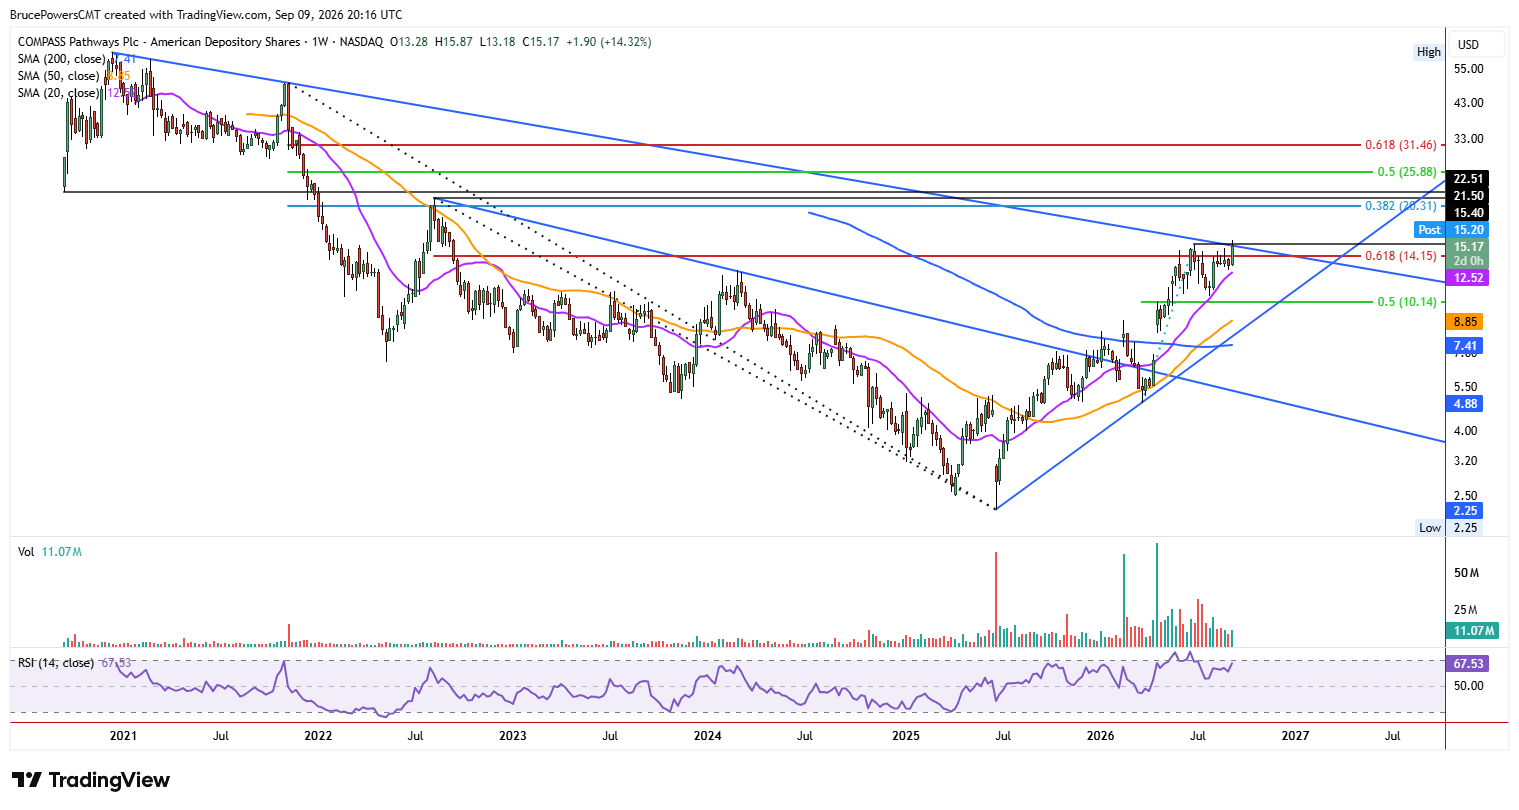
An extension above Wednesday’s high of $15.87 would further indicate an upside breakout for CMPS and a recovery of the long-term falling trendline. The three-month consolidation base formed near resistance from that downtrend line and a lower swing high of $12.75 from February 2024. A bullish reversal signal for the long-term downtrend triggered during an initial rally above $12.75 in early June. A sustained move above the base would strengthen that longer-term reversal signal.
Lower Support Defines Downside Risk
The upside breakout and bullish trend continuation signal has not yet confirmed but it may do so on another breakout attempt. Key near-term support is at the recent higher swing low of $12.73, which also represented a successful test of support at the 50-day moving average, now near $13.10. Holding above this support area would help maintain the bullish short-term structure while CMPS attempts another breakout.
Upper Targets Emerge Above $15.40
If another upside breakout is confirmed with a daily close above $15.40, higher potential targets come into play. A key higher resistance zone is near the $25.51 corrective low from September 2020. That area also approximates a measured move objective derived from recent consolidation, which indicates a potential upside target near $22.51. The combination of these technical objectives creates a broader resistance zone that could become important if CMPS successfully clears $15.40.
If you’d like to know more about technical analysis and how traders use it, please visit our educational area.