


Pullback Tests Dynamic Support
Natural gas spiked down to an eight-day low of $2.80 on Wednesday, as it fell through potential support near $2.83. That level is defined by the recent higher swing low and the 20-day moving average. Subsequently, initial signs of support were found near the uptrend line that defines dynamic support for the current short-term advance. If support continues to hold near that trendline, and it is followed by signs of strength, the current lower dynamic support boundary would remain in place.
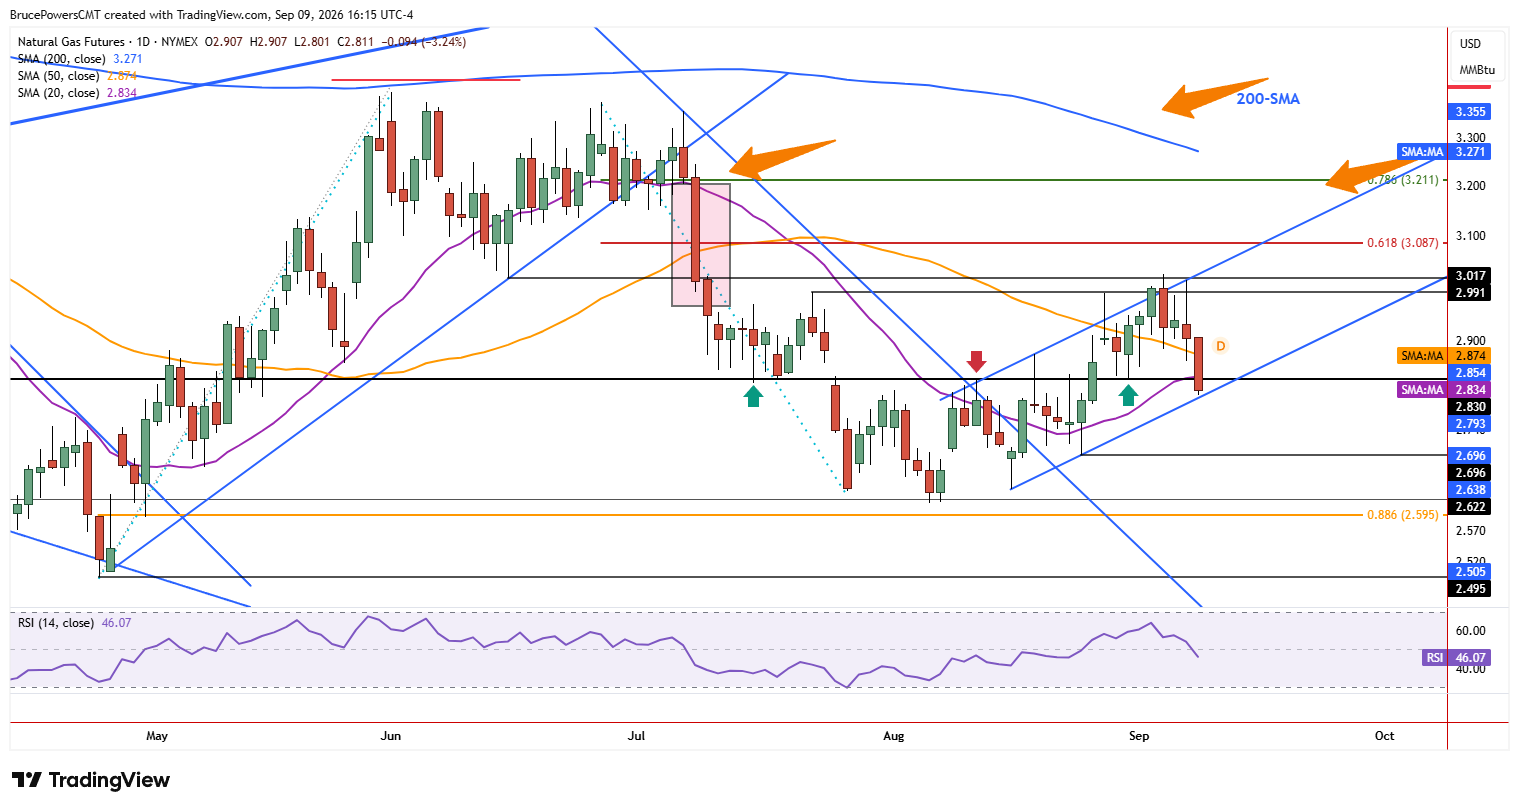
Although support failed at the 20-day moving average on Wednesday, that average had not yet been confirmed previously as support and the pullback low of $2.80 was a relatively minor level. Below the uptrend line is the recent higher swing low of $2.70, which is key support from structure. However, if that lower level is reached, it would indicate lower demand than if the 20-day moving average is quickly reclaimed, followed by signs of strength.
Bearish Flag Emerges
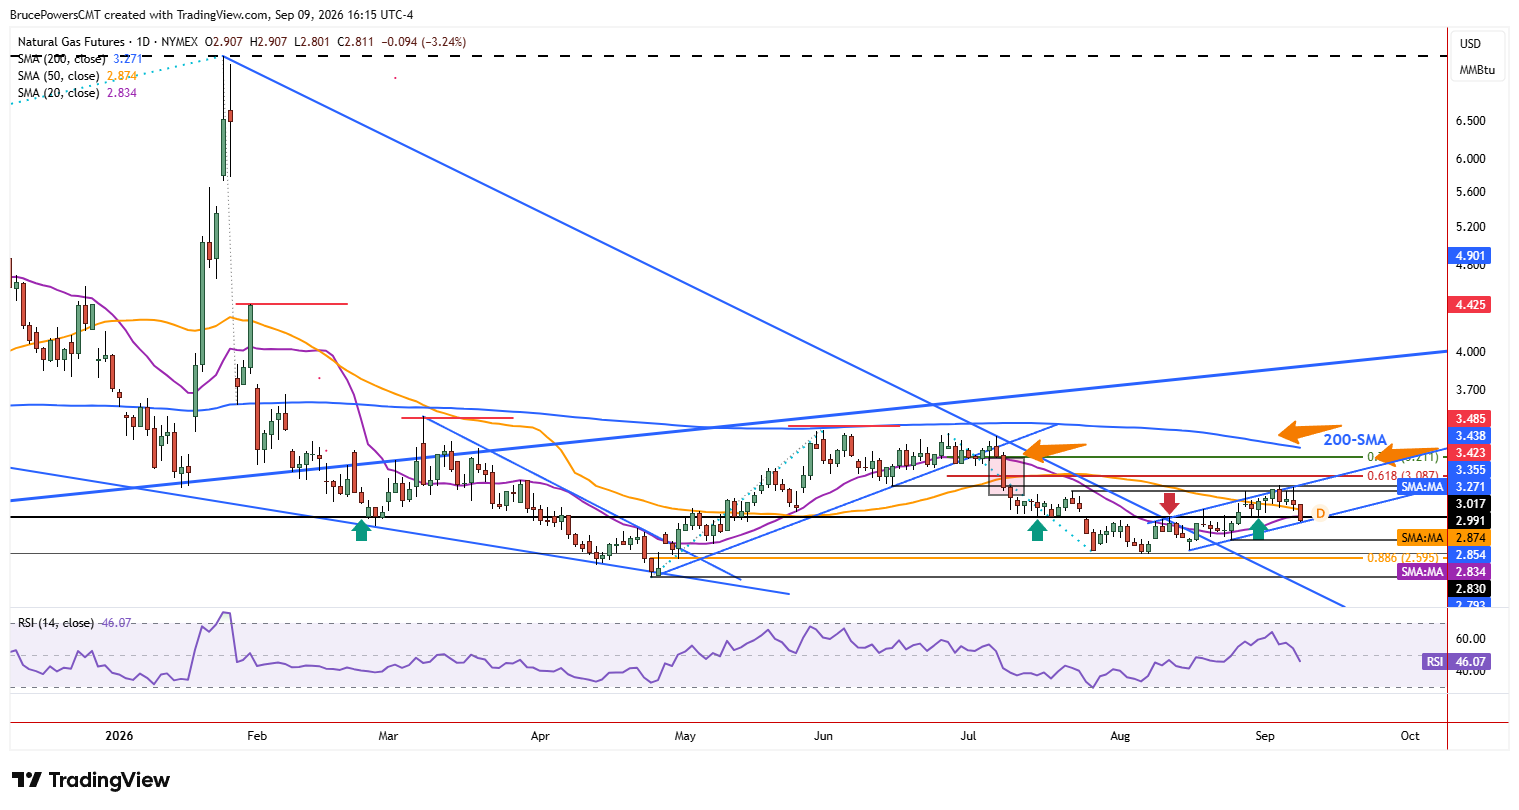
The recent advance formed a small parallel channel that found resistance and established a lower swing high at $3.03 last week, which was near resistance at the lower swing high from July. During the advance, an attempt to reclaim the 50-day moving average has now failed. Since resistance was confirmed on Wednesday once a lower swing high was generated, the channel has similarities to a bearish flag pattern. An initial bearish signal for the pattern would therefore occur on a drop below Wednesday’s low, since it would trigger a drop below the lower channel boundary line.
Recovery Path Remains Possible
Alternatively, support holds at the lower channel boundary, leading to a reclaim above the 20-day moving average and additional signs of strength. Otherwise, key short-term resistance is at Wednesday’s high of $2.91, which is above the 50-day moving average at $2.87. Since there has been only one leg up since a bullish reversal from a bottom consolidation pattern triggered two weeks ago, another leg up would be possible if key dynamic support is retained.
If you’d like to know more about how to trade natural gas, please visit our educational area.