


Coiling Between Key Trendlines
Gold continued its short-term coiling price action on Wednesday, reaching a slightly lower daily low of $4,341. That low was a successful test of support at the lower rising trendline that defines the lower boundary of a new channel. Buyers then took back control following that low and drove prices higher, with gold reaching a lower daily high of $4,434.
Gold Price Forecast
Every new Gold analysis as it publishes, today's technical signal and key levels, live price — on one page.
See all Gold forecastsResistance for the day was found at the downtrend line. Buyers remain in control at the time of writing and gold is on track to close positive for the day and in the upper third of the day’s trading range. With gold now consolidating between nearby support and resistance trendlines, the next breakout could determine the direction of the next short-term move.
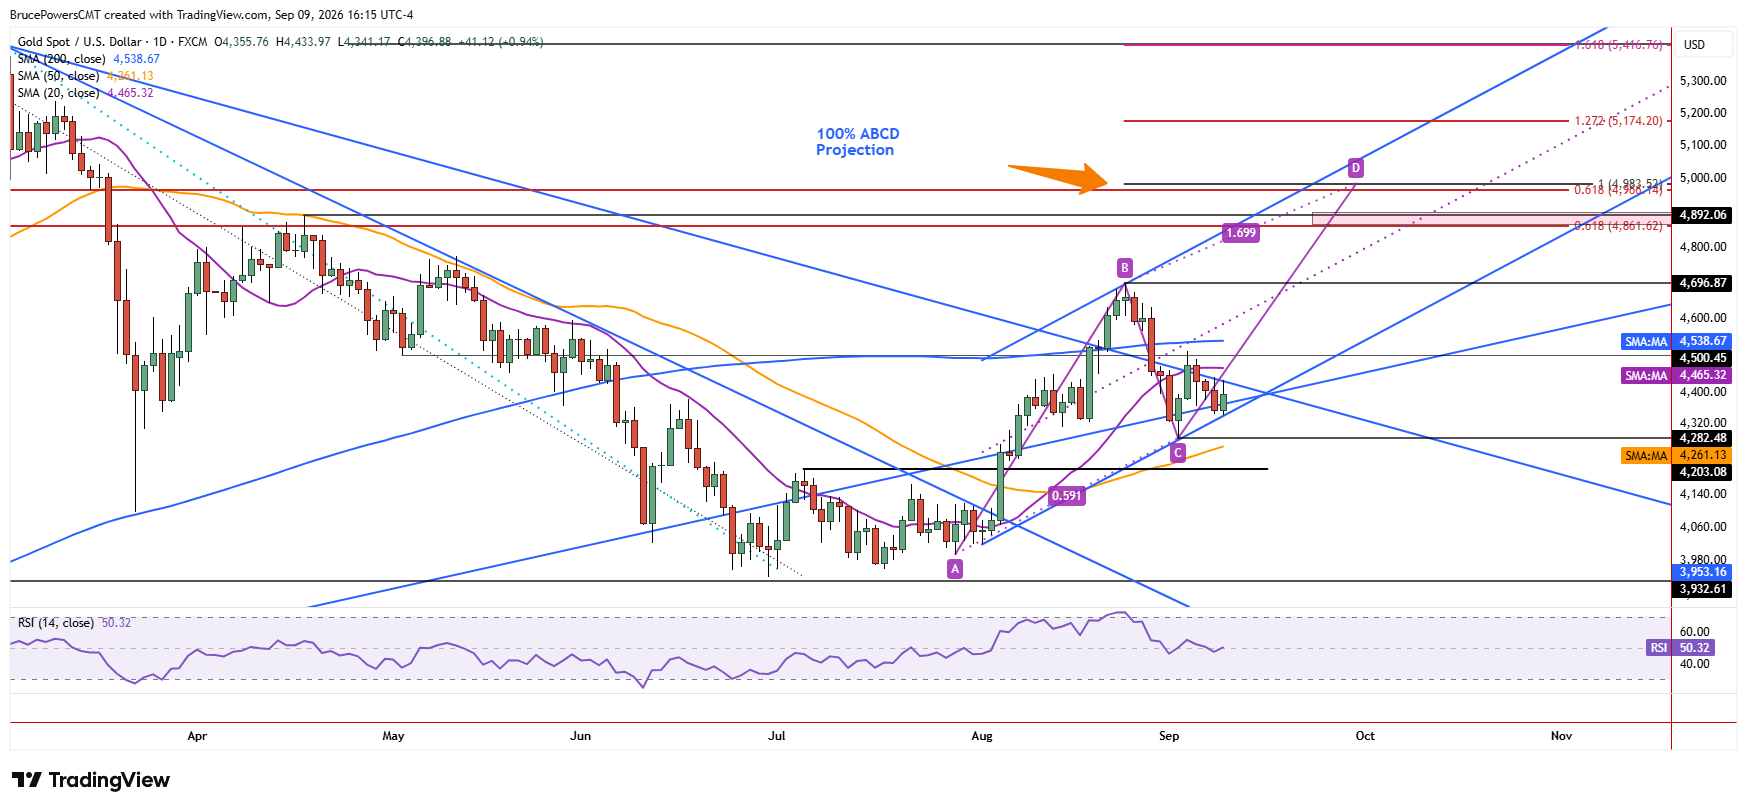
Given the recognition of both support and resistance at nearby trendlines, the high and low of the day become important short-term levels. A decline through Wednesday’s low would have greater significance as a bearish signal since the lower channel boundary would break to the downside. That would expose the recent swing low at $4,282 a lower target along with the 50-day moving average, near $4,262 and rising. Despite the short-term bearish implications of such a decline, the broader bullish outlook would remain intact if gold can stay above the 50-day moving average.
Breakout Levels Come into Focus
A new higher swing low will be established if there is a decisive breakout above Wednesday’s high of $4,434. That would also trigger another breakout above the downtrend line and possibly a reclaim of the 20-day moving average, near $4,460. Last Thursday’s lower swing high of $4,511 provides an initial target from structure. If that level is reached after the downtrend line is recovered and the 20-day moving average, near $4,460, is reclaimed, it would likely be surpassed on the way to a test of resistance at the 200-day moving average near $4,439. However, because the 200-day moving average is below $4,511, it would represent an earlier resistance level on the advance.
Rising ABCD Pattern Extends Upside Potential
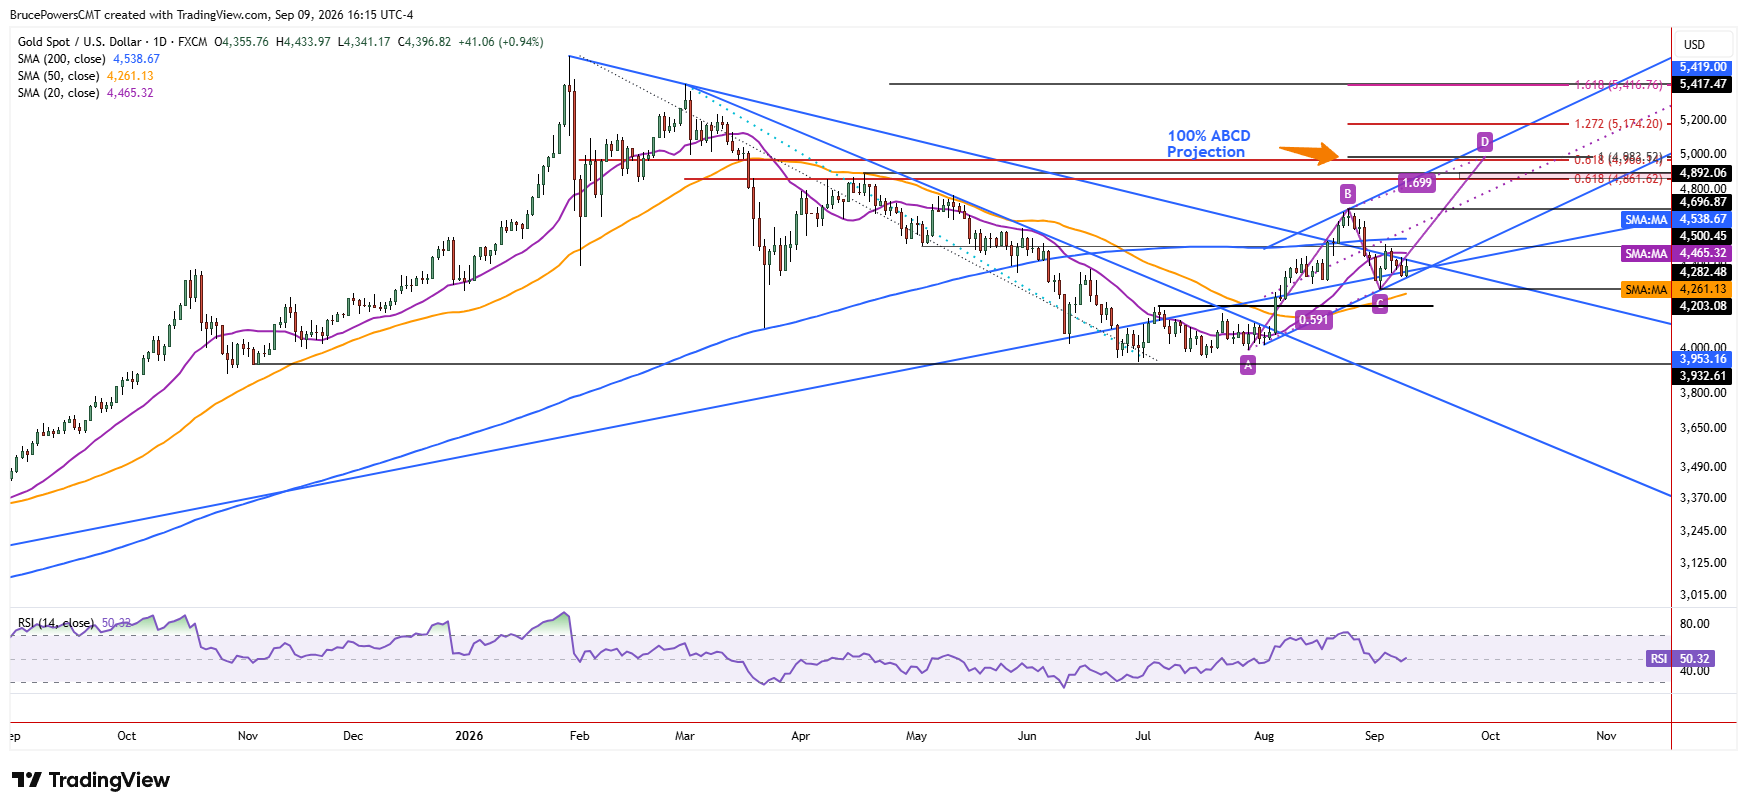
Since gold has been consolidating in a small range near key trend support and resistance indicators, the potential for a sharp move out of consolidation exists. This keeps the nearby $4,341 low and $4,434 high particularly important in the short-term. The larger short-term pattern unfolding is of a rising ABCD pattern. An initial 100% projection from the pattern suggests a minimum upside target around $4,984.
That level correlates with the 61.8% Fibonacci retracement of the full recent bearish correction, at $4,966, adding further significance as both a target and potential resistance zone. Therefore, while a break below support could trigger a deeper pullback, a decisive breakout above nearby resistance would reinforce the bullish structure and keep the larger upside target in focus.
If you’d like to know more about how to trade gold and silver, please visit our educational area.