


Resistance Break Comes Into Focus
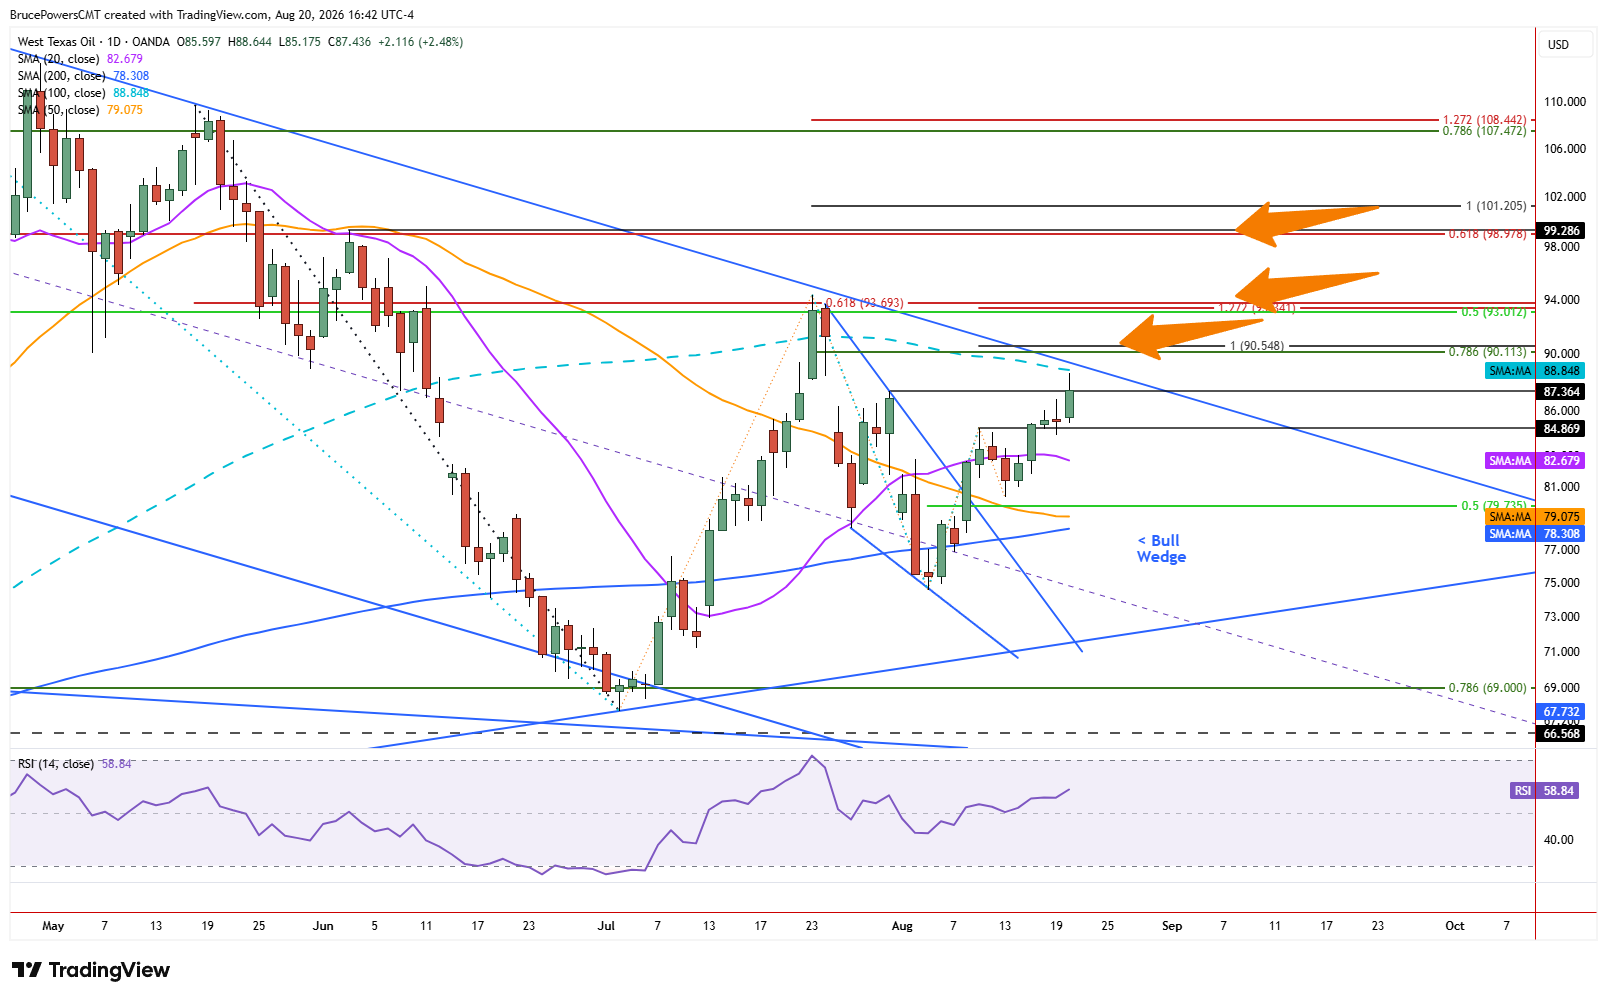
WTI crude oil extended gains to a new high of $88.64 on Thursday, as it tested resistance near the 100-day moving average at $88.85 and a downtrend line. That line defines the upper boundary for a falling trend channel, reflecting symmetry in the trend structure. A bullish reversal signal triggered during the advance with a rise above the lower swing high of $87.36 from late July, but it needs to be confirmed by a daily close above that level. Nonetheless, the implications are that underlying demand is improving and may continue to strengthen. The ability to push higher despite nearby resistance suggests buyers are becoming increasingly willing to challenge the broader downtrend.

Momentum Builds Against Channel Resistance
The 100-day moving average was confirmed as resistance during the advance in July and could continue to be so. However, there are signs of improving bullish momentum since the corrective low of $67.73 was established at the beginning of July. The top channel boundary was touched for the fourth time, adding to the significance of the line as a key pivot zone that could continue to reflect resistance or result in an upside breakout of the channel. A decisive break above the channel would therefore provide an important early indication that a recovery is developing into a broader bullish move.
$94.34 Marks a Bigger Trend Test
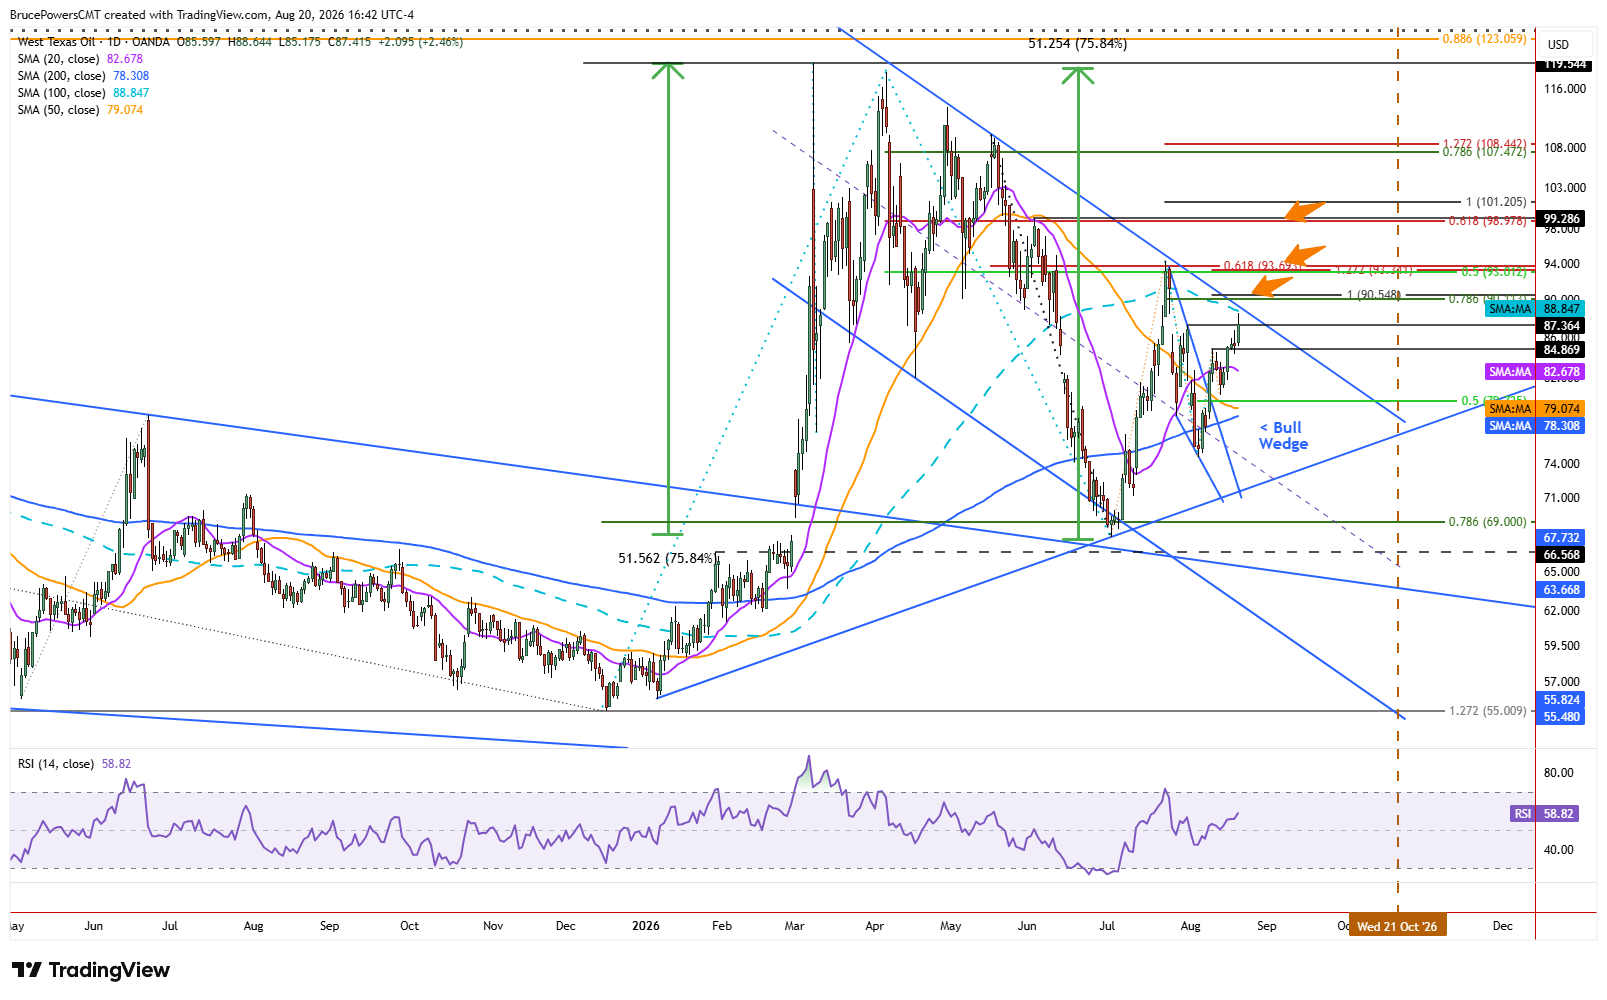
There are two other initial resistance zones that could stop or stall an advance if WTI can get above both the downtrend line and 100-day moving average. The first is near the 78.6% Fibonacci retracement of a prior decline at $90.11, and the second is near the lower swing high of $94.34, which is part of the declining trend structure. However, a decisive advance above the $94.34 level would provide a strong confirming bullish signal for the recovery. If that occurs, the next upside resistance zone is near the interim lower swing high of $99.29 from early June. These levels represent progressively stronger tests of the recovery, with a move through $94.34 having particular significance for the larger trend.
Potential Second Leg Takes Shape
There has only been one leg up since the long-term bullish breakout of a falling wedge triggered in early March. This suggests the possibility of another decisive advance if there is a sustained breakout of the falling channel. The sharp rally following the July low may be the beginning of that second leg up. For now, the key test is whether WTI can convert the current resistance zone into support. A sustained breakout would strengthen the evidence that the July low marked more than a temporary correction and that the next leg of the recovery is underway.



