Bullish Momentum Holds
Gold extended gains to a slightly new high of $4,541 on Thursday and a higher daily low of $4,451. Wednesday’s advance had already carried gold into a key resistance zone defined by the 200-day moving average near $4,314 and a downtrend line. Signs of underlying strength remain, with gold continuing to trade near highs of the day’s range and poised to close the session in a similar position. This may establish a hammer candlestick pattern that reflects continued bullish momentum rather than signaling a bearish reversal, which is consistent with the current price behavior.
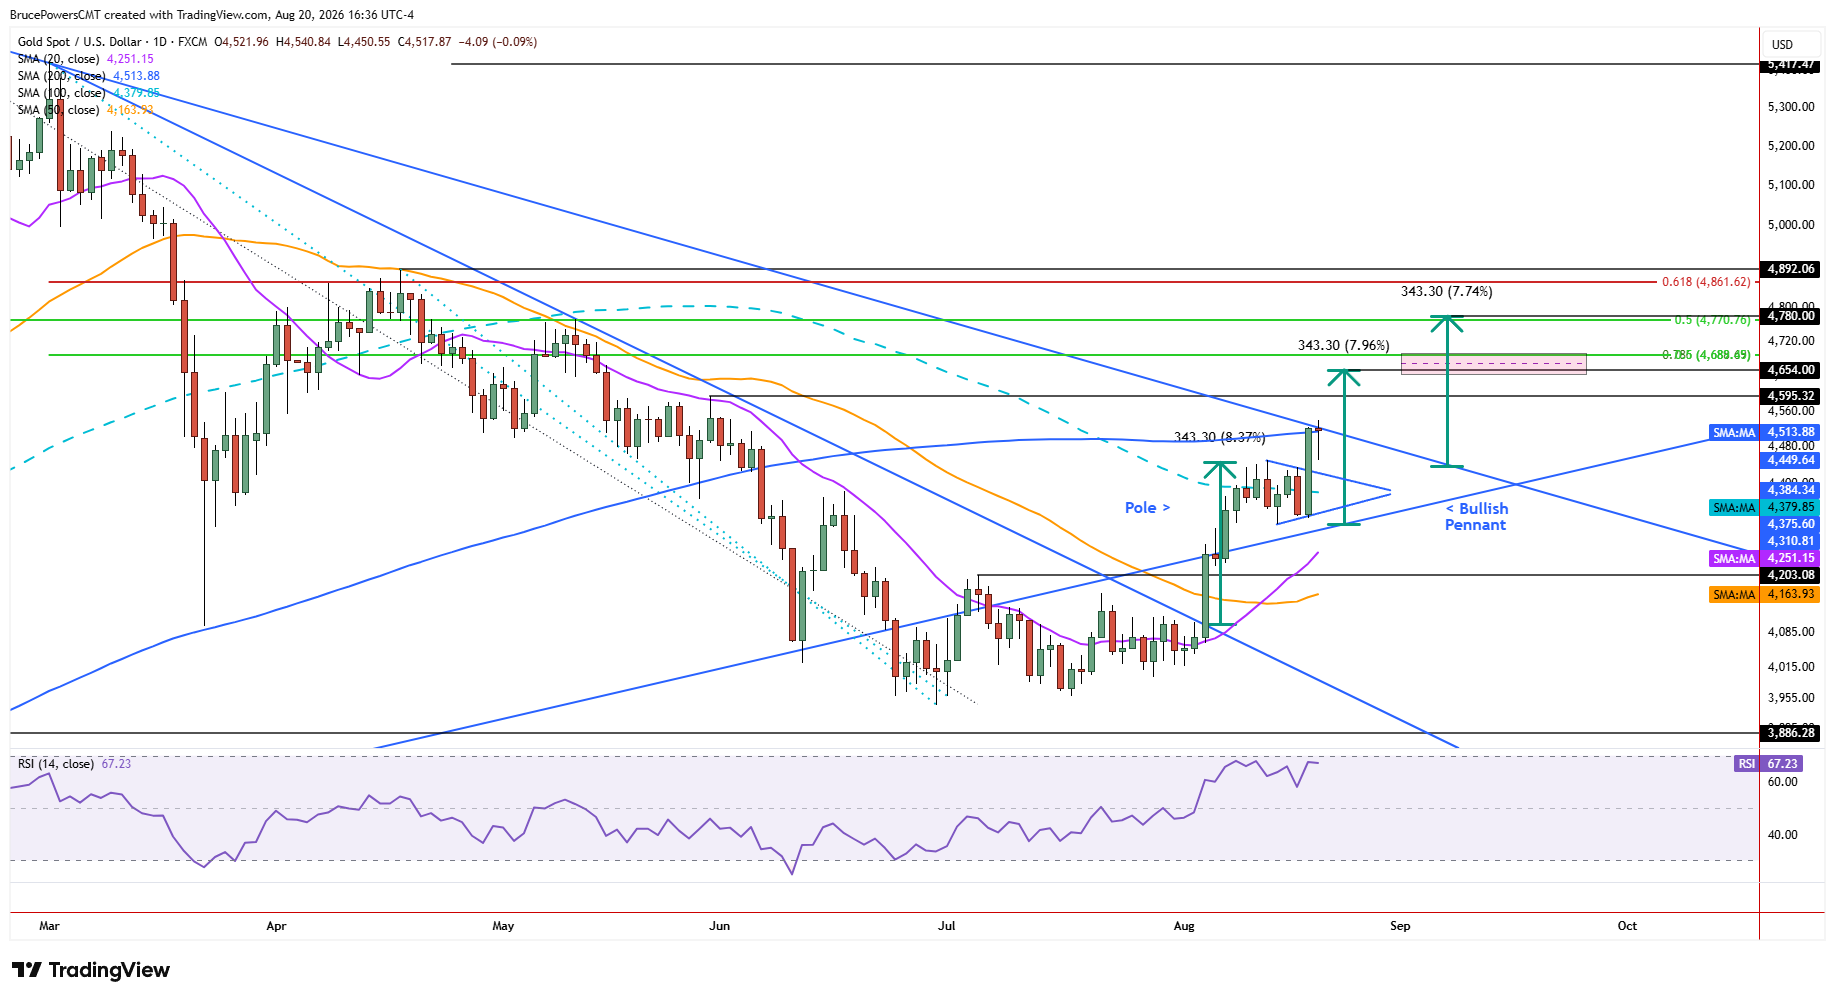
The closing price on Wednesday was near the 200-day moving average and Thursday is also set to end near that average, reflecting persistent upward pressure on prices. Notably, Thursday’s low was a successful test of support at the prior resistance level of $4,451, following the initial breakout above that level. That is bullish behavior given the sharp intraday advance that followed the session’s low, as buyers quickly responded to the pullback and pushed prices back toward the day’s highs.

Pennant Breakout Gains Traction
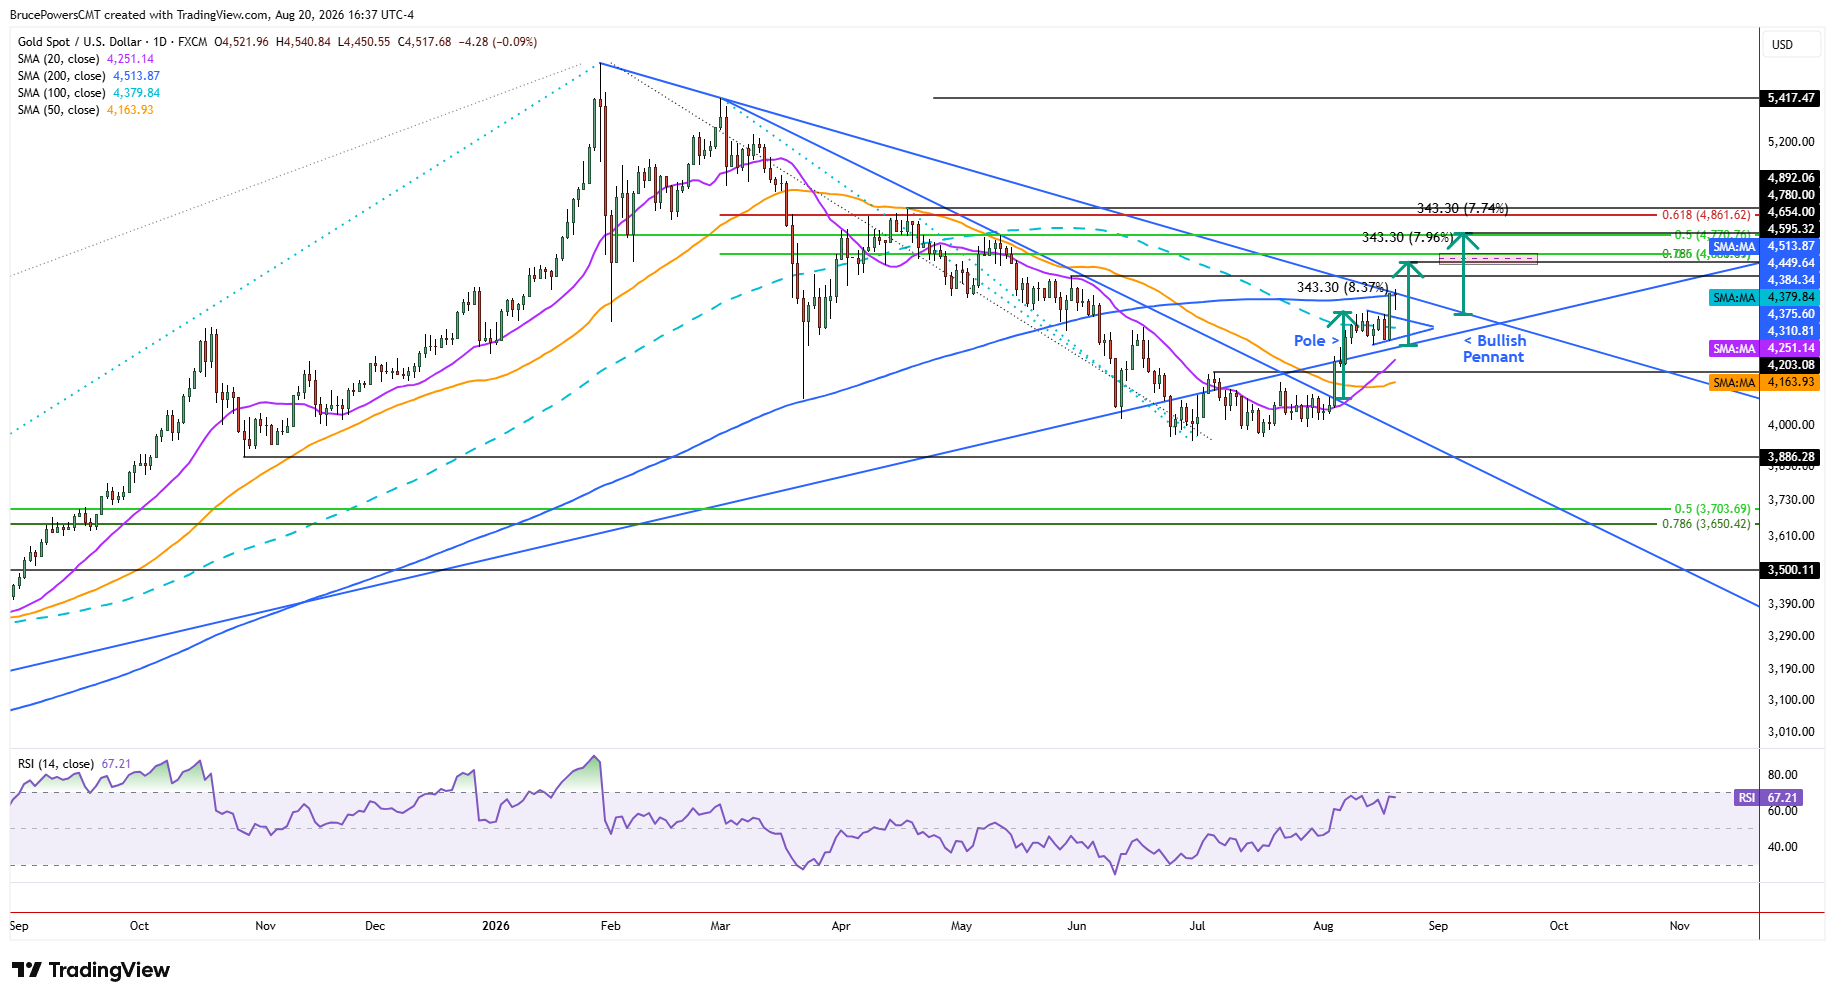
Continued signs of strength follow the breakout of a bullish pennant pattern on Wednesday. The breakout ended with buyers in control, as gold closed near the top of the session’s range. Although this bullish pattern is contained within a larger downtrend structure, the sharp advance that preceded the short consolidation pattern suggests that momentum may be sufficient to challenge the broader bearish structure. If demand remains strong, gold could recover the downtrend line and continue toward higher initial targets.
Upside Targets Take Shape
A simple measured move objective from the pattern shows a possible conservative target near $4,654. In addition, there is a confluence of two Fibonacci retracement levels at $4,689. Together, these levels establish a potential resistance zone from $4,654 to $4,689. The standard measuring objective, however, points to $4,779 as a potential upside target, providing a higher target if bullish momentum continues to strengthen following the breakout.
Gold Price Forecast
Every new Gold analysis as it publishes, today's technical signal and key levels, live price — on one page.
See all Gold forecastsLong-Term Confirmation Still Needed
Despite the potential for upside, additional signs of strength are needed. Most importantly, a sustained reclaim of the 200-day moving average would signal a meaningful change in character and provide further confirmation that buyers are gaining control. Gold has traded below the 200-day moving average since June 5, making the current test particularly significant. A decisive move above the average would strengthen the bullish case and support continued gains toward the pattern’s higher price targets.