


WTI Weekly Technical Analysis
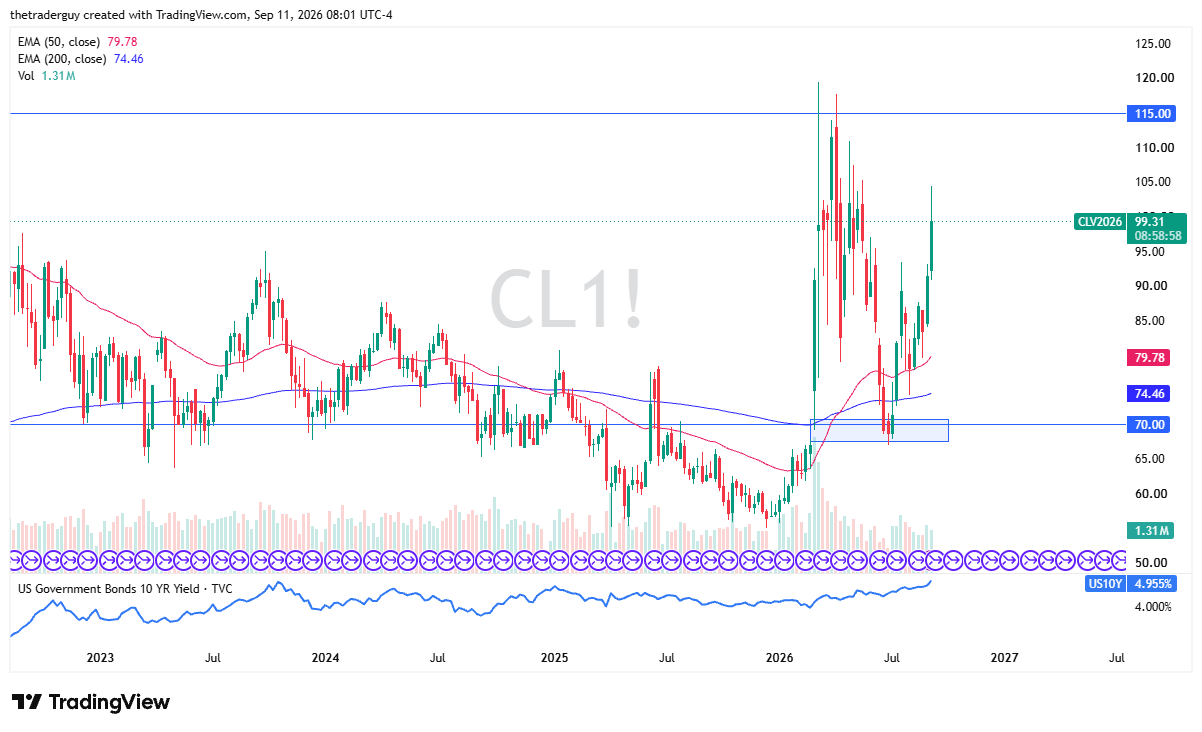
The light sweet crude oil market has been very strong during the week, breaking above $100 at one point. Although Friday has seen some profit-taking, it is more of the same story. It’s the never-ending conflict in the Middle East threatening to disrupt supply around the world, and this is, of course, reflected on the charts.
The market recently had formed an ascending triangle, perhaps seen a little easier on the daily chart, and we have broken out of that. So, it will be interesting to see how this plays out. But clearly, the situation in the Middle East continues to be a major problem with oil, and as a result, short-term pullbacks continue to seem to offer buying opportunities for those who are willing to step in and take advantage of it. That being said, we’re still in the same range we’ve been in all year.
Brent Weekly Technical Analysis
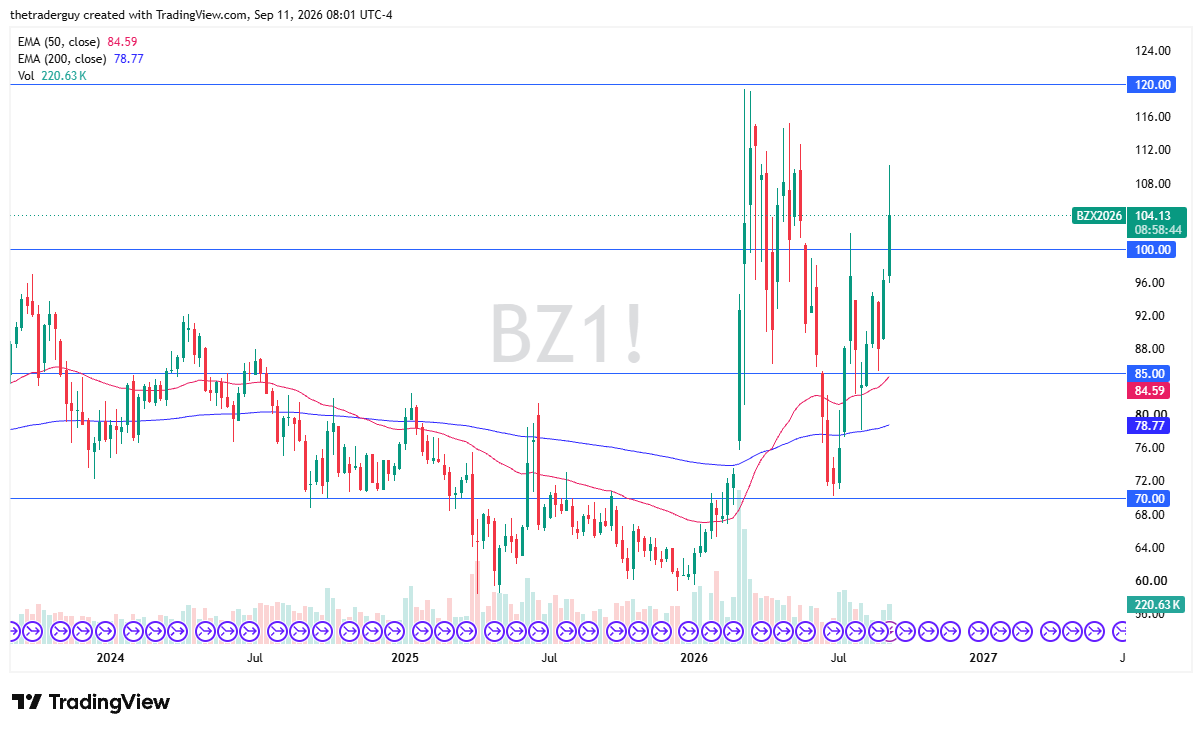
Brent markets look very much the same, breaking well above the $100 level; in fact, almost breaking $110 on Friday. This is a market that looks very bullish as well. It could be a little bit more sensitive to the Middle Eastern conflict, and as a result, it makes a certain amount of sense that we see some bullish pressure here.
Pullbacks continue to attract attention, and quite frankly, it’s a market that, sooner or later, we almost have to believe there’s bad news coming for supply anytime it looks like it has cooled off. The market has been extraordinarily volatile over the last several months, and unfortunately, it does not look like that is changing anytime soon.
If you’d like to know more about how to trade natural gas, please visit our educational area.