Advertisement
Advertisement
DOGE and SHIB Track the Broader Crypto Market into the Red
By:
Finding early support this morning, a move through the day's pivot levels and Friday's highs would support a breakout day ahead.
Key Insights:
- It was a bearish session for DOGE and SHIB on Friday.
- Broader crypto market sentiment weighed on the pair going into the weekend.
- Key technical indicators remain bullish, with DOGE and SHIB holding above their 200-day EMAs.
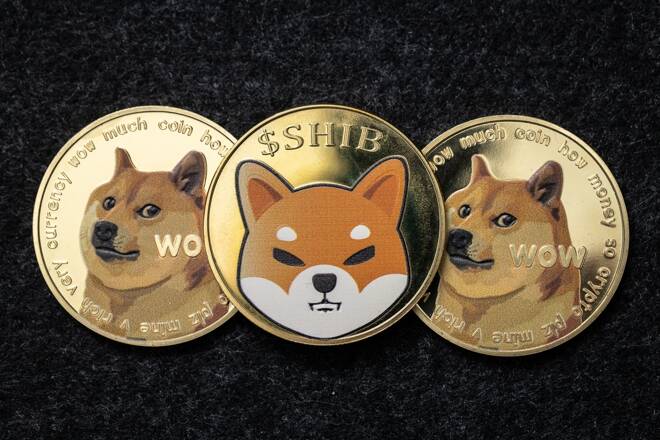
It was a bearish day for DOGE and SHIB on Friday. Bearish sentiment across the broader crypto market weighed.
Partially reversing a 5.31% rally from Thursday, DOGE slid by 4.31% to end the day at $0.1309. SHIB reversed a 1.19% gain from Thursday, with a 2.27% loss to end the day at $0.00002412.
Elsewhere, AVAX slid by 4.58%, with ADA (-3.01%), LUNA (-3.53%), SOL (-3.69%), and XRP (-2.11%) also struggling. BNB (-0.89%) and ETH (-0.27%) saw modest losses.
Crypto Market Risk Sentiment Weighs
For DOGE, it was the first loss in five sessions. Mid-week, news of Bitcoin of America adding Dogecoin to its Bitcoin ATMs (BTMs) provided support.
With technical indicators to continuing to send bullish signals, Friday’s loss likely stemmed from profit-taking.
Market sentiment towards inflation and Fed monetary policy remains a factor to consider, however. In recent months, we have seen a crypto correlation with the NASDAQ 100 and FED monetary policy. A more aggressive Fed rate path could test investor resilience in the coming months.
With the prospect of a sharp rise in U.S interest rates, profit-taking could cap the upside for the crypto majors in the near term.
DOGE Price Action
At the time of writing, DOGE was up 0.53% to $0.1316.
Technical Indicators
DOGE will need to move through the day’s $0.1322 pivot to make a run on the First Major Resistance Level at $0.1364. DOGE would need the broader crypto market to support a breakout from $0.1350.
An extended rally would test the Second Major Resistance Level at $0.1418. The Third Major Resistance Level sits at $0.1514.
Failure to move through the pivot would test the First Major Support Level at $0.1268. Barring an extended sell-off, DOGE should steer clear of sub-$0.1250 levels. The Second Major Support Level sits at $0.1226.
Looking at the EMAs and the 4-hourly candlestick chart (below), it is a bullish signal. DOGE sits above the 200-day EMA, currently at $0.1263. The 50-day EMA converged on the 200-day EMA. The 100-day EMA also closed in on the 200-day EMA; DOGE positive.
A bullish cross of the 50-day EMA through the 200-day EMA would support a return to $0.14.
SHIB Price Action
At the time of writing, SHIB was up by 0.79% to $0.00002431.
Technical Indicators
SHIB will need to move through the day’s $0.0000244 pivot to make a run on the First Major Resistance Level at $0.0000252. SHIB would need the broader crypto market to move through to $0.0000250 levels.
An extended rally would test the Second Major Resistance Level at $0.0000262. The Third Major Resistance Level sits at $0.0000280.
Failure to move through the pivot would bring the First Major Support Level at $0.0000233 into play. Barring an extended sell-off, SHIB should steer clear of sub-$0.000023 levels. The Second Major Support Level sits at $0.0000225.
Looking at the EMAs and the 4-hourly candlestick chart (below), it is a bullish signal. SHIB sits above the 200-day EMA at $0.0000240. This morning, the 50-day EMA narrowed to the 200-day EMA. The 100-day EMA also closed in on the 200-day EMA.
A bullish cross of the 50-day EMA through the 200-day EMA would bring $0.000026 levels into play.
About the Author
Bob Masonauthor
With over 28 years of experience in the financial industry, Bob has worked with various global rating agencies and multinational banks. Currently he is covering currencies, commodities, alternative asset classes and global equities, focusing mostly on European and Asian markets.
Advertisement
