
Reports of Nvidia planning H200 shipments to China lifted sentiment in early trading on Tuesday, December 23. The latest developments in the US-China trade reboot highlighted easing trade tensions, lifting risk sentiment.
The Nvidia news coincided with rising bets on a March Fed rate cut, boosting demand for high-capex tech stocks. US stock futures were steady during the Asian session, consolidating overnight gains.
Meanwhile, 10-year Japanese Government Bond (JGB) and US Treasury yields pulled back, bolstering demand for risk assets. However, the yen was on intervention watch. USD/JPY dropped 0.46% to 156.301, capping gains for the Nikkei 225.
Improving US-China trade relations and rising bets on a Fed rate cut support a constructive bias for US equity futures.
Below, I’ll outline the key market drivers, the medium-term outlook, and the key technical levels traders should watch.

Nvidia H200 Chip Shipments to China Set to Resume
A shift in US trade policy lifted risk sentiment on Tuesday, December 23, as reports circulated of the Trump administration allowing Nvidia to resume H200 shipments to China. CN Wire reported:
“Nvidia has told Chinese clients it plans to ship H200 AI chips to China before the mid-February Lunar New Year, sources said. […] It follows a Trump administration policy shift allowing H200 sales to China with a 25% fee, reversing an earlier ban.”
The latest trade developments followed upward revisions to China’s GDP growth projections. Goldman Sachs raised China’s 2025 GDP growth forecast from 4.5% to 5.0%, matching Beijing’s GDP growth target.
Dow Jones Price Forecast
Every new Dow Jones analysis as it publishes, today's technical signal and key levels, live price — on one page.
See all Dow Jones forecastsMarch Fed Rate Cut Bets Hold Above 50%
Positive trade developments coincided with renewed hopes for a March Fed rate cut. Lower borrowing costs would increase company earnings and share prices. Cooling US inflation and a softer labor market have fueled speculation about a more dovish Fed rate path.
US unemployment rose from 4.4% in October to 4.6% in November, while headline inflation unexpectedly dropped from 3.0% in September to 2.7% in November. (There was no October CPI report because of the government shutdown.)
According to the CME FedWatch Tool, the chances of a March cut increased from 51% on December 15 to 52.9% on December 22.
Crucially, expectations of a more dovish incoming Fed Chair have raised expectations of further Fed policy easing, in contrast with the Dot Plot’s one-rate cut projection.
US GDP and Labor Market in Focus
US futures were steady during the Asian morning session on Tuesday, December 23. The Nasdaq 100 E-mini and the S&P 500 E-mini advanced 28 points and 5 points, respectively, while the Dow Jones E-mini was flat.
Later on Tuesday, US economic data will influence demand for US stock futures, with GDP and labor market figures in focus.
According to first-estimate data, the US economy expanded by 3.2% quarter-on-quarter (Q3) in Q3, cooling from 3.8% GDP growth in Q2. A lower GDP reading would likely raise expectations of a March Fed rate cut, reinforcing the bullish short- to medium-term outlook for US equity futures.
Meanwhile, the ADP will report weekly employment figures, following last week’s jobs report. The Kobeissi Letter commented on a weakening US labor market, stating:
“The US economy lost 983,000 full-time jobs in October and November, bringing the total down to 134.2 million, the lowest since December 2021. As a result, just 78.2% of the labor force is now employed full-time, the lowest since June 2021. This percentage has now declined 2.5 points since the June 2023 peak. In the past, such a trend has usually been seen during recessions. […] The labor market needs more rate cuts.”
Key Technical Levels for Dow Jones, Nasdaq 100, and S&P 500
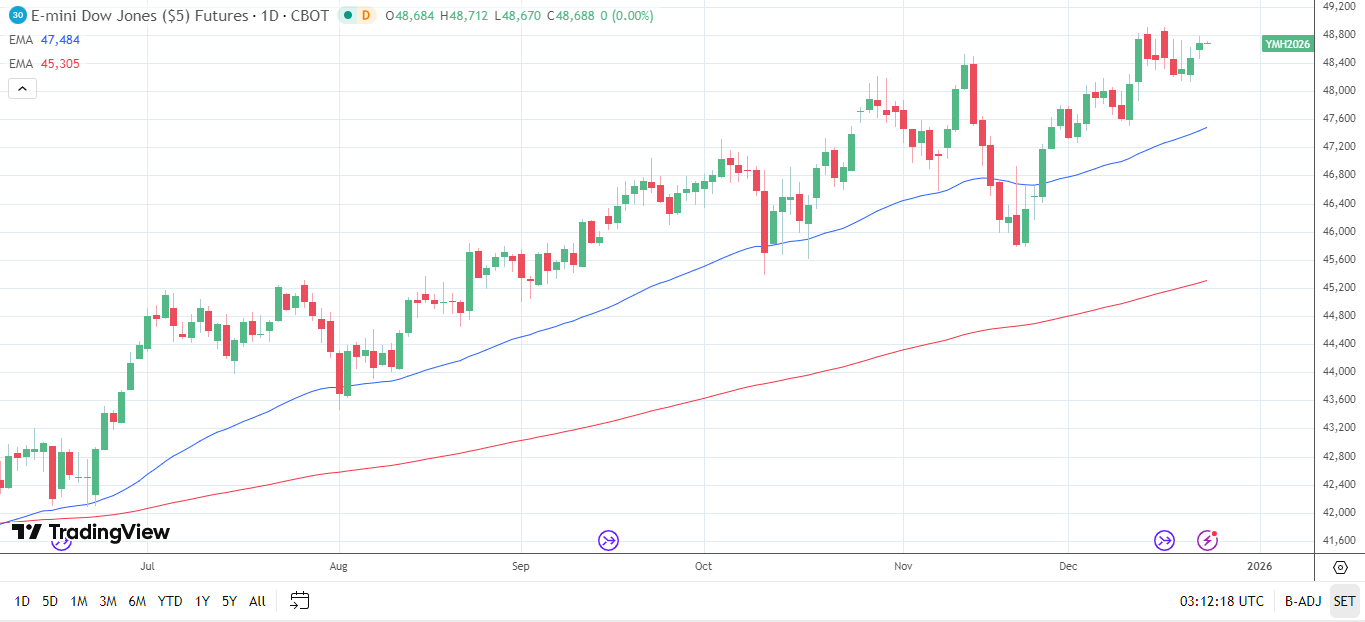
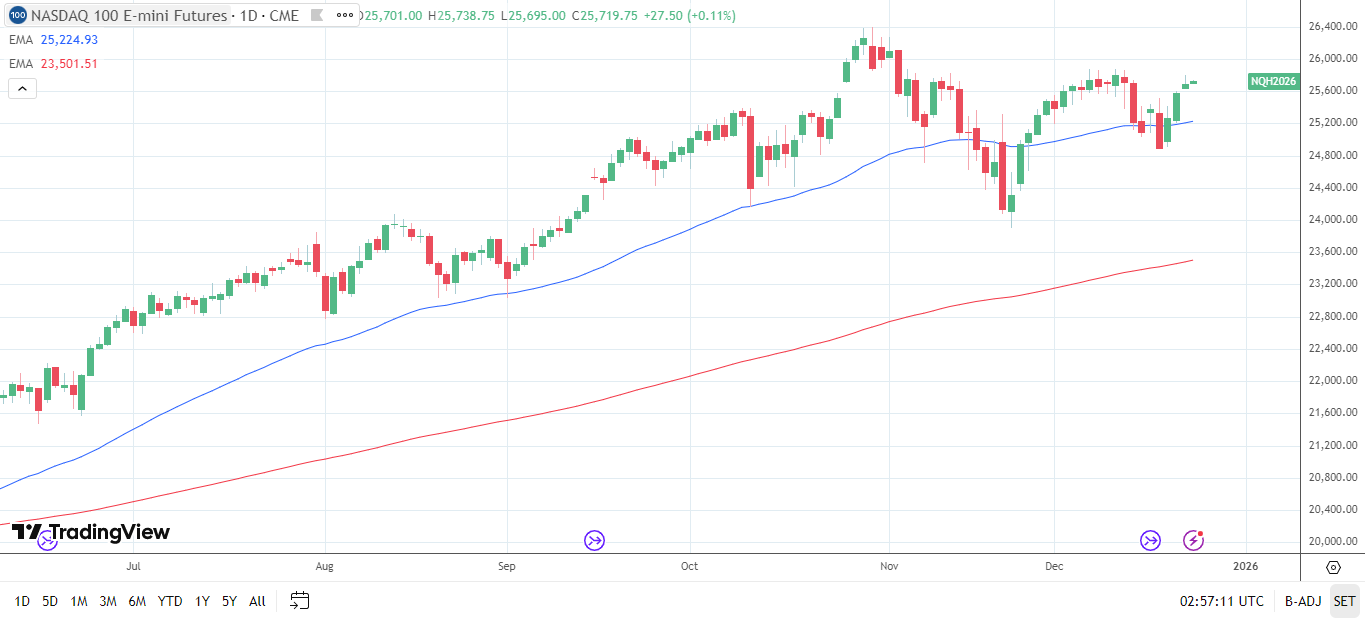
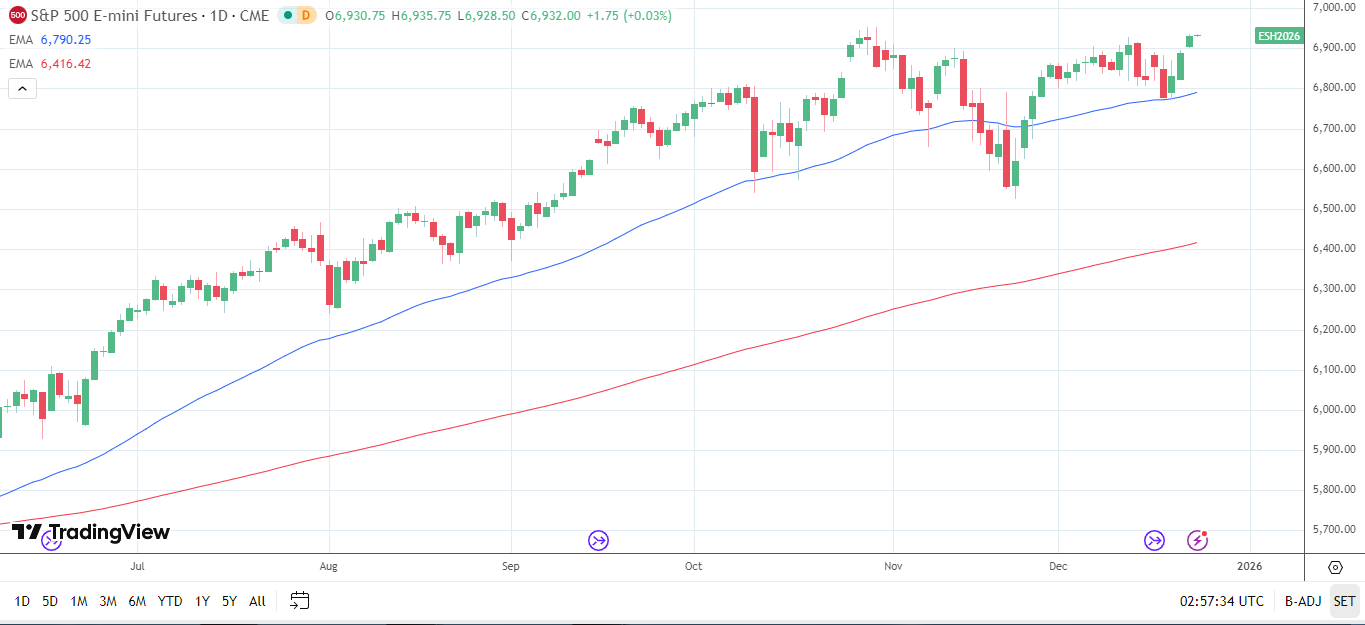
Despite a steady Asian-session performance on Tuesday morning, the Dow Jones E-mini, the Nasdaq 100 E-mini, and the S&P 500 E-mini remained above their 50-day and 200-day EMAs. The EMAs indicated a positive medium-term bias.
Near-term trends will hinge on US data, Fed rhetoric, and Bank of Japan chatter. Key levels to monitor include:
Dow Jones
- Resistance: The December 12 record high of 48,917, and then 49,000.
- Support: 48,500 and then the 50-day EMA (47,484).
Nasdaq 100
- Resistance: 26,000 and then the October 30 record high of 26,399.
- Support: the 50-day EMA (25,225) and then 24,500.
S&P 500
- Resistance: the October 30 record high of 6,954, and then 7,000.
- Support: the 50-day EMA (6,790) and then 6,500.
Bullish Medium-Term Outlook Hinges on US Data and the Fed
In my opinion, the short-term outlook remains bullish given the alignment of technical indicators and fundamentals. Higher expectations of a March Fed rate cut reinforce the positive medium-term outlook.
Nevertheless, several scenarios may invalidate the constructive medium-term outlook, including:
- Bank of Japan signals a neutral interest rate of between 1.5 and 2%, triggering a yen carry trade unwind.
- Better-than-expected US data dampen bets on a Fed rate cut.
Conclusion: Outlook Bullish
In summary, recent US economic data and a dovish BoJ rate hike support a bullish short- to medium-term outlook for US stock futures.
However, over the next 72 hours, traders should monitor USD/JPY trends, intervention warnings, and the Nikkei 225. A BoJ threat to raise interest rates to strengthen the yen could weigh on sentiment.
Key levels include a USD/JPY drop below 150 and 10-year JGBs sustainably at the December 22 high of 2.2%, an important level to watch. These levels would likely send Nikkei 225 sharply lower, weighing on broader risk sentiment.
Follow our live coverage and consult the economic calendar for real-time market updates.