Rising Yields Took Back Tuesday’s Rally
Stocks are lower Wednesday because the bond market did not stay quiet for long. Treasury yields are moving higher again, crude is back above $90 and buyers who chased Tuesday’s records are taking some money off the table.
The S&P 500 Index and Nasdaq Composite Index made fresh highs Tuesday when yields eased and oil slipped. That was enough to bring the Dow into the rally. Wednesday reversed both parts of that trade. The 10-year Treasury yield is back at a 24-year high. The Dow is taking the hardest hit.
At 14:37 GMT, the Dow Jones Industrial Average is trading at 50,888.24, down 533.04 or -1.03%. The S&P 500 Index is at 7,775.38, down 43.55 or -0.56%, while the Nasdaq Composite Index is trading at 27,388.21, down 211.58 or -0.77%.

The Long End Put the Pressure Back on Stocks
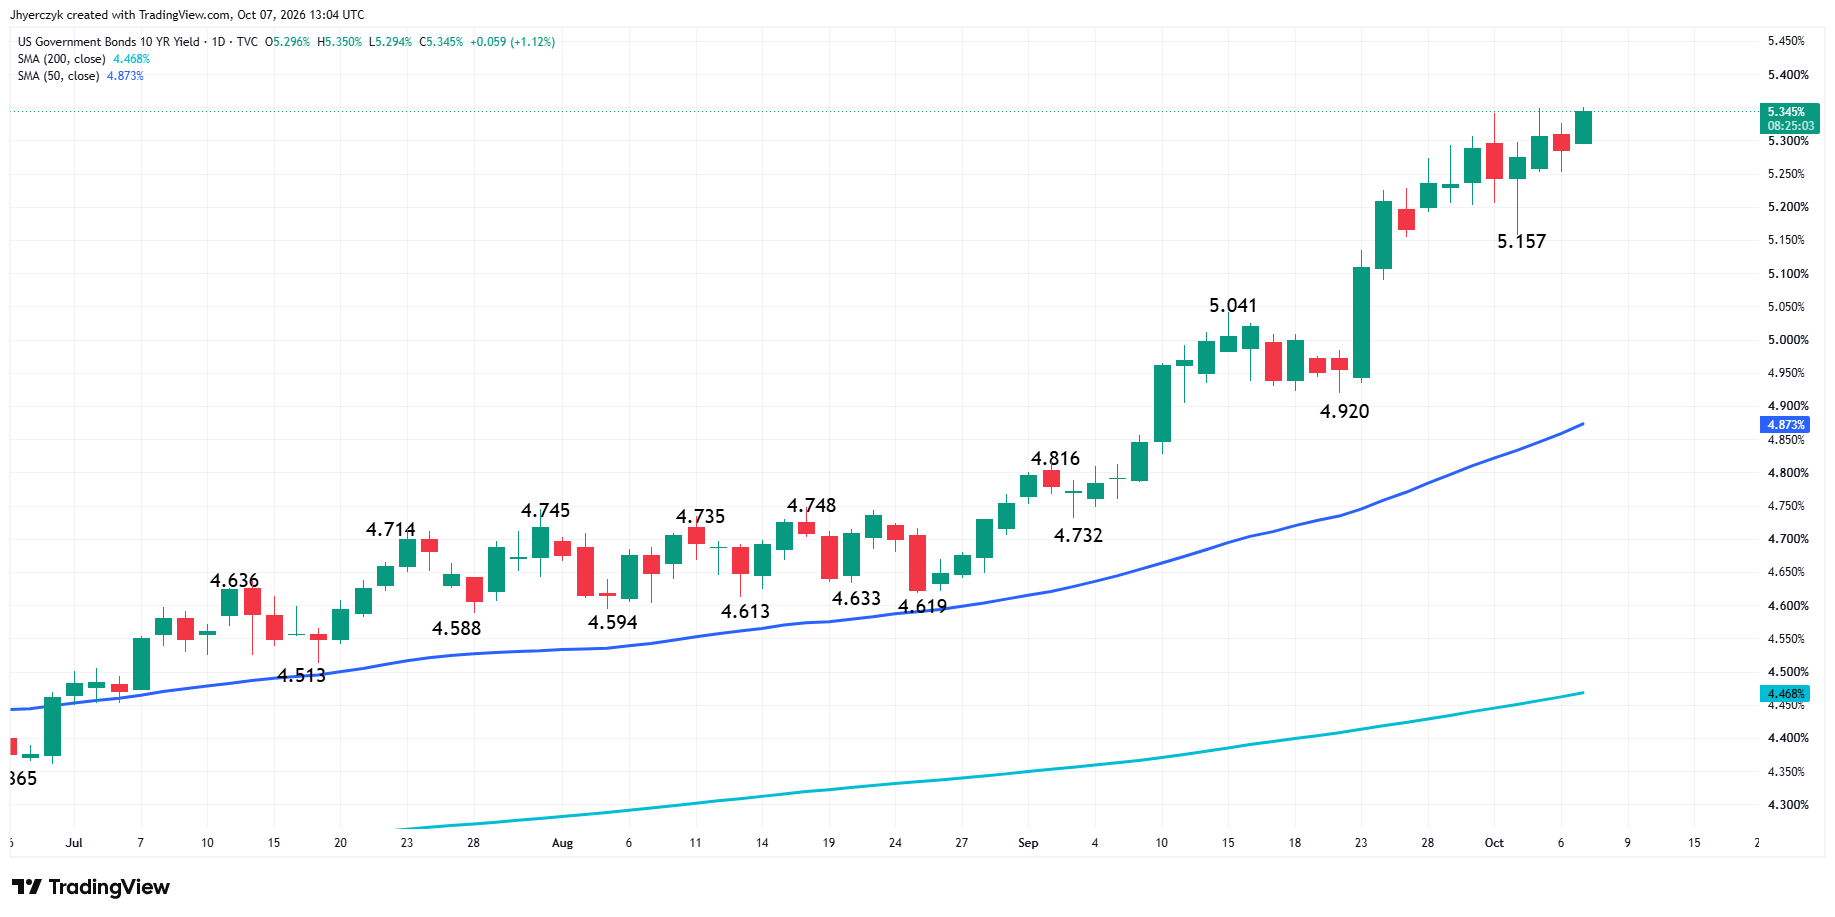
The 10-year Treasury yield reached 5.356% Wednesday, up more than 8 basis points and above Monday’s high. The 30-year yield climbed to 5.725%. That’s enough to take the bid out of growth stocks and give index traders a reason to lighten up after Tuesday’s record session.
The short end is not driving this. Last week’s payrolls report cooled the October Fed trade without bringing buyers into long-dated Treasuries. Inflation concerns and heavy government borrowing are still keeping bond sellers active.
Oil added to the problem. U.S. crude moved above $90 a barrel and Brent traded near $102. That puts the inflation trade back on the table just as yields are pushing higher again.
Tuesday’s stock rally worked because both oil and yields moved lower. Wednesday’s decline is the reaction when they turn back up together.
Dow Jones Price Forecast
Every new Dow Jones analysis as it publishes, today's technical signal and key levels, live price — on one page.
See all Dow Jones forecastsThe 10-Year Auction Is the First Test
The Treasury sells $39 billion of 10-year notes Wednesday. That is the immediate test for a bond market that has been asking for more yield for weeks.
The tape is already saying yields have to move higher before buyers will step in. The auction shows whether real money agrees.
Fed minutes follow at 18:00 GMT. Traders know officials raised rates by 25 basis points in September. The minutes will show how much support that decision had and how officials were looking at the jump in long-term yields.
The market still has a December hike priced in. Stocks can live with that as long as bond yields stop running higher. They haven’t done that yet.
The AI Trade Is Still There, but Rates Came First
Wednesday is not an earnings collapse. It’s a rates day.
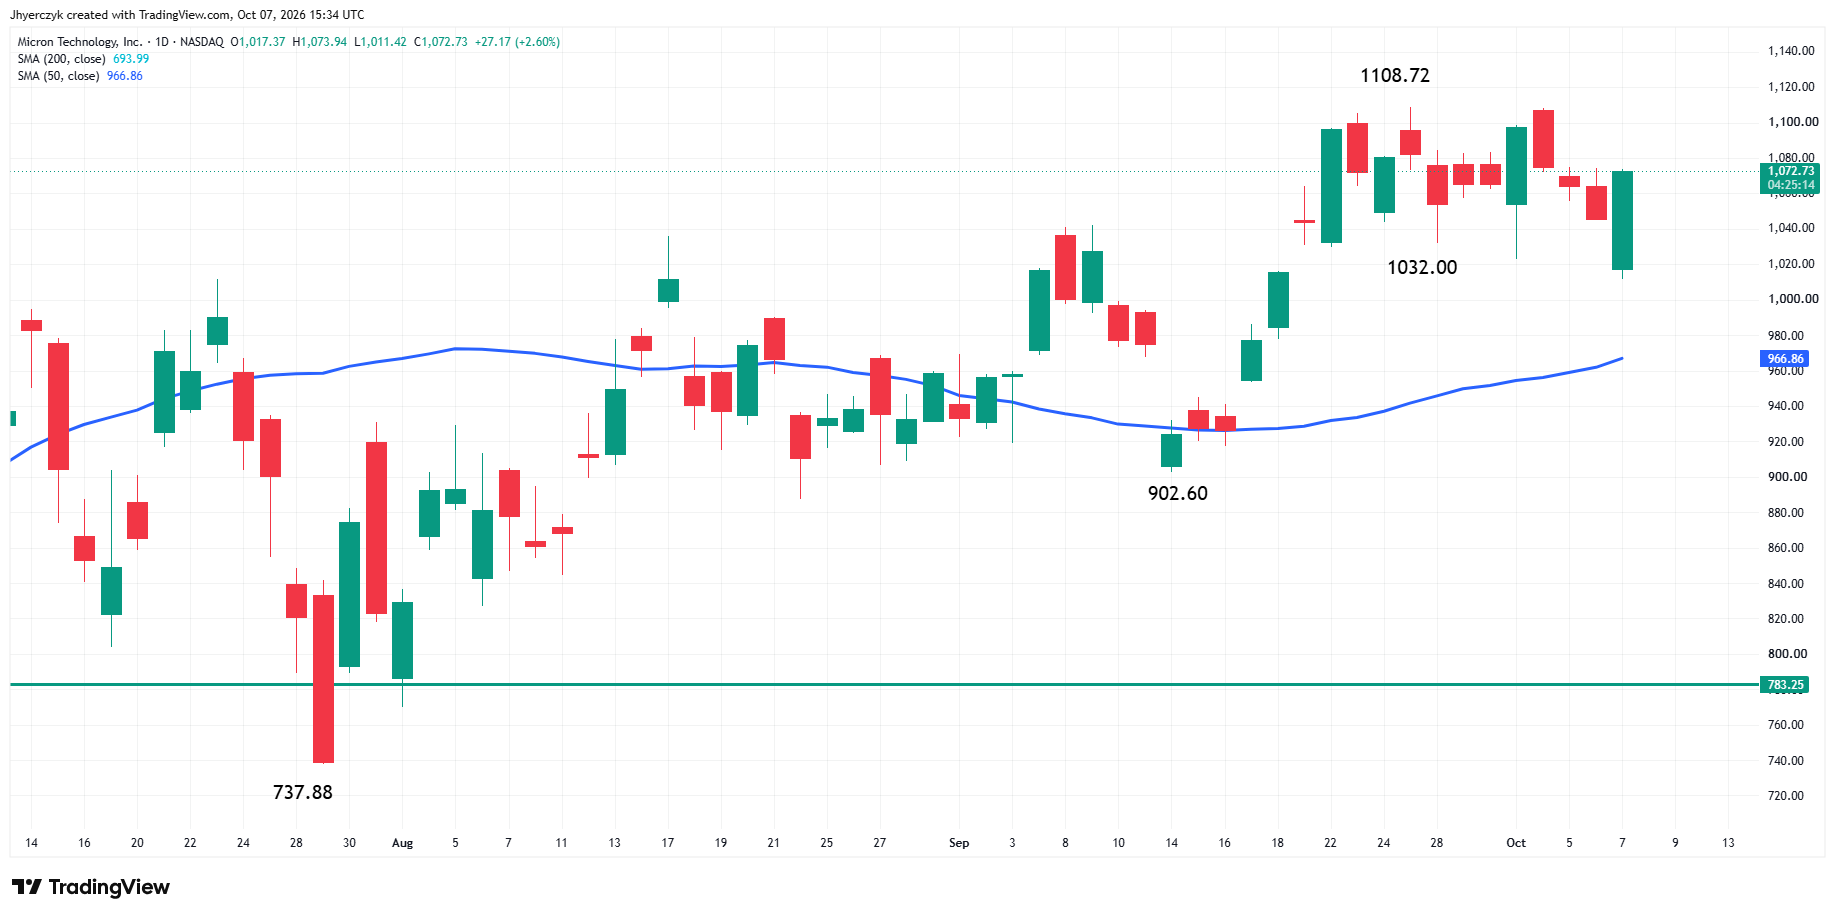
Micron was lower as the semiconductor group pulled back, with a labor dispute at its Taiwan operations giving traders another reason to sell the stock. The chip group had done a lot of work getting the Nasdaq to Tuesday’s record. It doesn’t have to fall apart for the index to correct when yields jump.
There are still buyers in stocks with a specific reason to move. Neogen climbed after raising its fiscal-year guidance. Penguin Solutions gained after fourth-quarter results came in above expectations. Flutter moved higher after a Citi upgrade.
Those trades are working because they have company-specific catalysts. The index trade is different. It needs buyers willing to own the broad market while the 10-year yield is making new highs.
Daily Index Technical Analysis
Wednesday’s selling has opened potential retracement targets. It has not changed the broader trend structure.
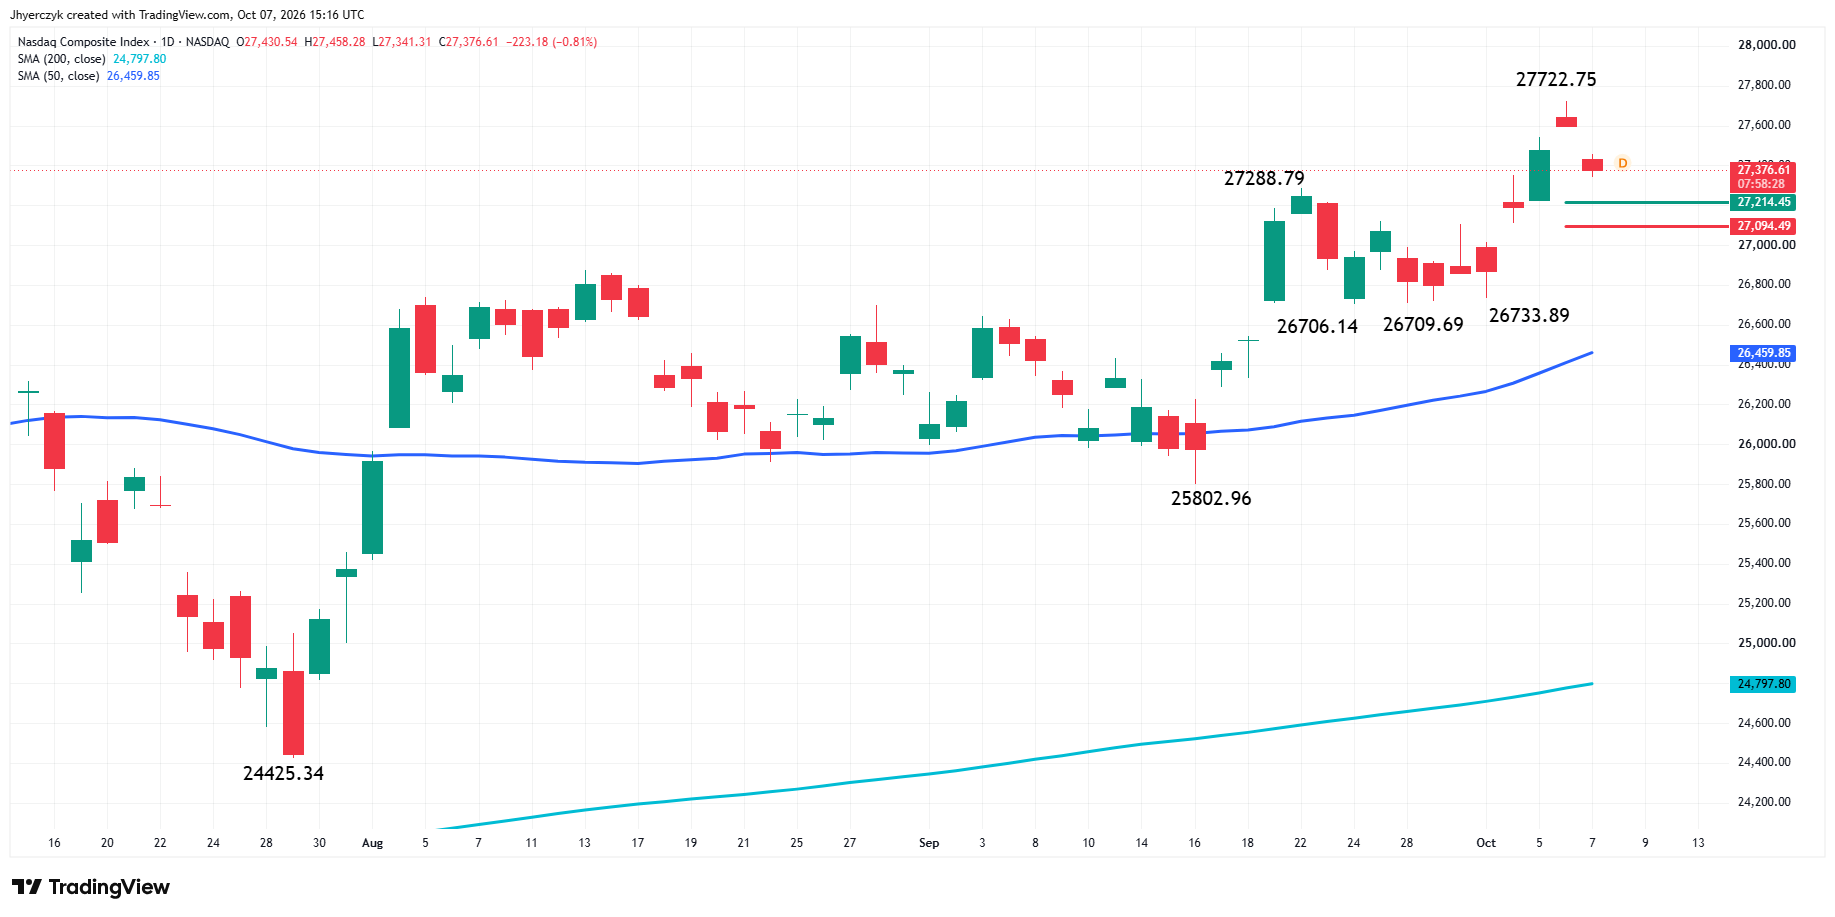
The Nasdaq Composite Index is lower shortly after the opening on Wednesday. The main trend is up. A trade through 27,722.75 will resume the uptrend. The main trend will change to down if the swing bottom at 26,706.14 fails as support.
The minor trend is also up, but a new minor top has formed at 27,722.75. Minor bottoms include 26,733.89, 26,709.69 and 26,706.14. The 50-day moving average is the next support at 26,459.99. It is also providing momentum for the uptrend.
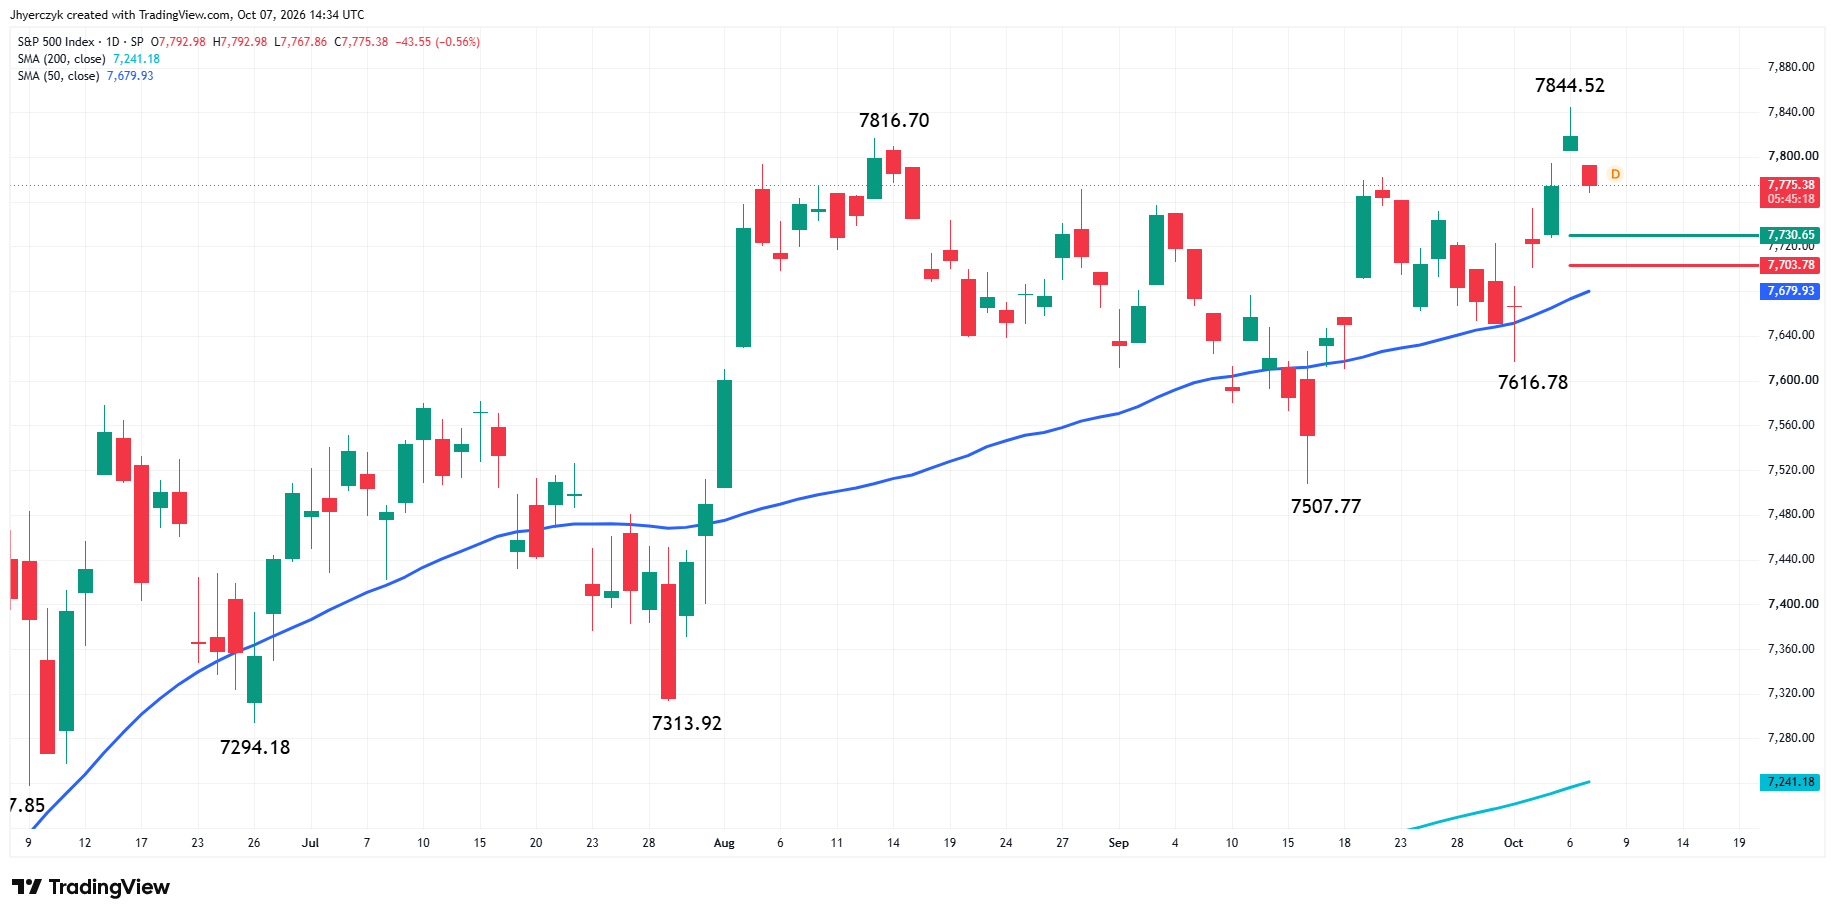
The S&P 500 Index pulled back from Tuesday’s 7,844.52 record high. The main trend is up according to the daily swing chart. A trade through 7,844.52 will signal a resumption of the uptrend. The main trend will change to down on a break through the last swing bottom at 7,616.78.
The minor trend is also up, but a new minor top has formed at 7,844.52.
The minor swing is 7,616.78 to 7,844.52. Its retracement zone at 7,730.65 to 7,703.78 is a potential downside target. This is followed by the 50-day moving average at 7,679.77, which is controlling the trend’s momentum while providing support.
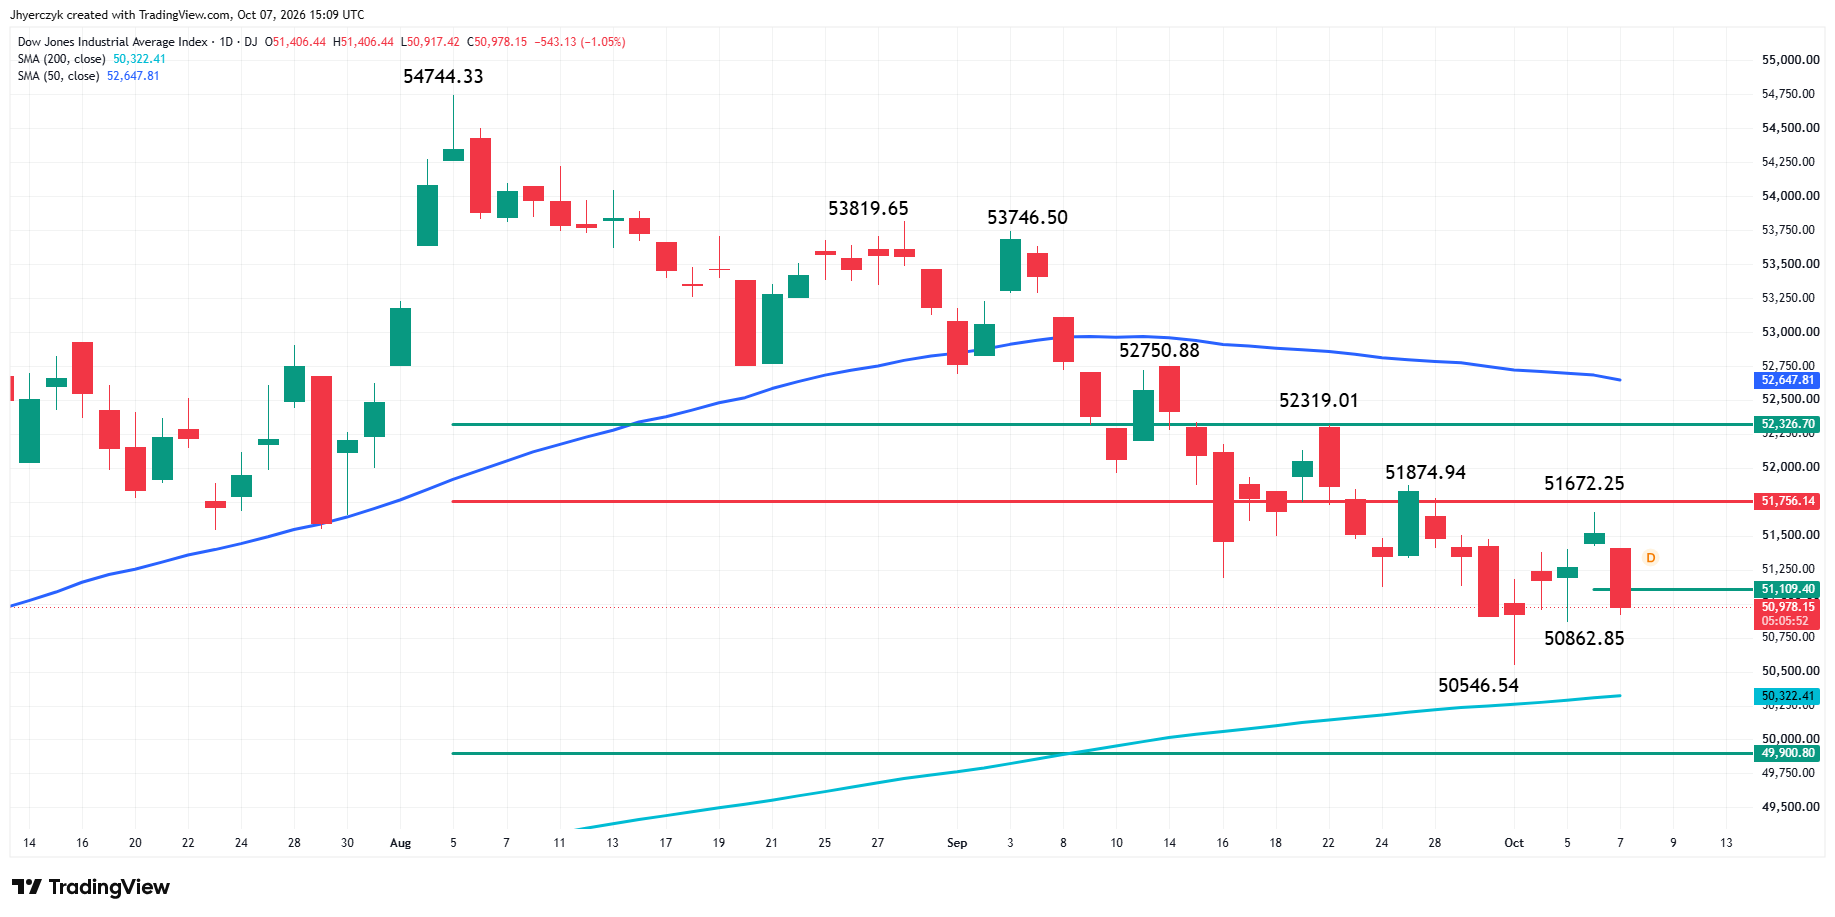
The Dow Jones Industrial Average is under pressure early Wednesday after crossing to the weak side of a minor pivot at 51,109.40. The main trend is down, but the minor trend is up, helping to produce the choppy trade.
A trade through the main bottom at 50,546.54 will reaffirm the downtrend. The main trend will change to up on a move through the 52,750.88 main top.
A new minor top has formed at 51,672.25. The minor trend will change to down on a break through Monday’s minor bottom at 50,862.85.
The minor range is 50,546.54 to 51,672.25. Its pivot at 51,109.40 could control the direction of the Dow into the close.
What to Watch
The 10-year auction comes first, followed by the Fed minutes. The Dow has already crossed under its minor pivot, while the Nasdaq and S&P 500 are pulling back from record highs with their main and minor trends still up.
The Nasdaq’s main uptrend still has 26,706.14 underneath, with the 50-day moving average as its first support. The S&P 500 has the 7,730.65 to 7,703.78 retracement zone underneath. The Dow is the weaker index, sitting just above Monday’s 50,862.85 minor bottom.
Wednesday’s selling is a yield reaction. The next move in bonds is the one stocks are waiting on.
More Information in our Economic Calendar.