Gold (XAU) prices rose to a three-month high as the weakness in the US dollar increased demand for the precious metal. Spot gold gained over 5% last week to near $4,640. Treasury plans to increase purchases of the long term bonds have pressured the dollar. Investors may also view higher bond yields as a sign of fiscal stress and policy uncertainty. These concerns, along with the prospect of stricter U.S. sanctions against Iran, are driving demand for gold as safe haven.
Gold and silver (XAG) are now approaching their short term resistance and the next move will depend on the July PCE inflation data and Fed Chair Kevin Warsh’s Jackson Hole speech. Softer inflation or more cautious tone from Warsh could weaken the US dollar and support further gains in gold and silver prices. But strong inflation data or a hawkish Fed tone could lift yields and pressure gold and silver prices.

Gold Price Forecast: $5,000 Resistance Comes into Focus
The spot gold price gained 5.17% last week and produced a strong weekly bullish candle. The rebound from the ascending trend line that stretches from the October 2023 lows signals constructive bullish price action. This constructive bullish price action on the weekly chart points to the target of $4,850 and $5,000.
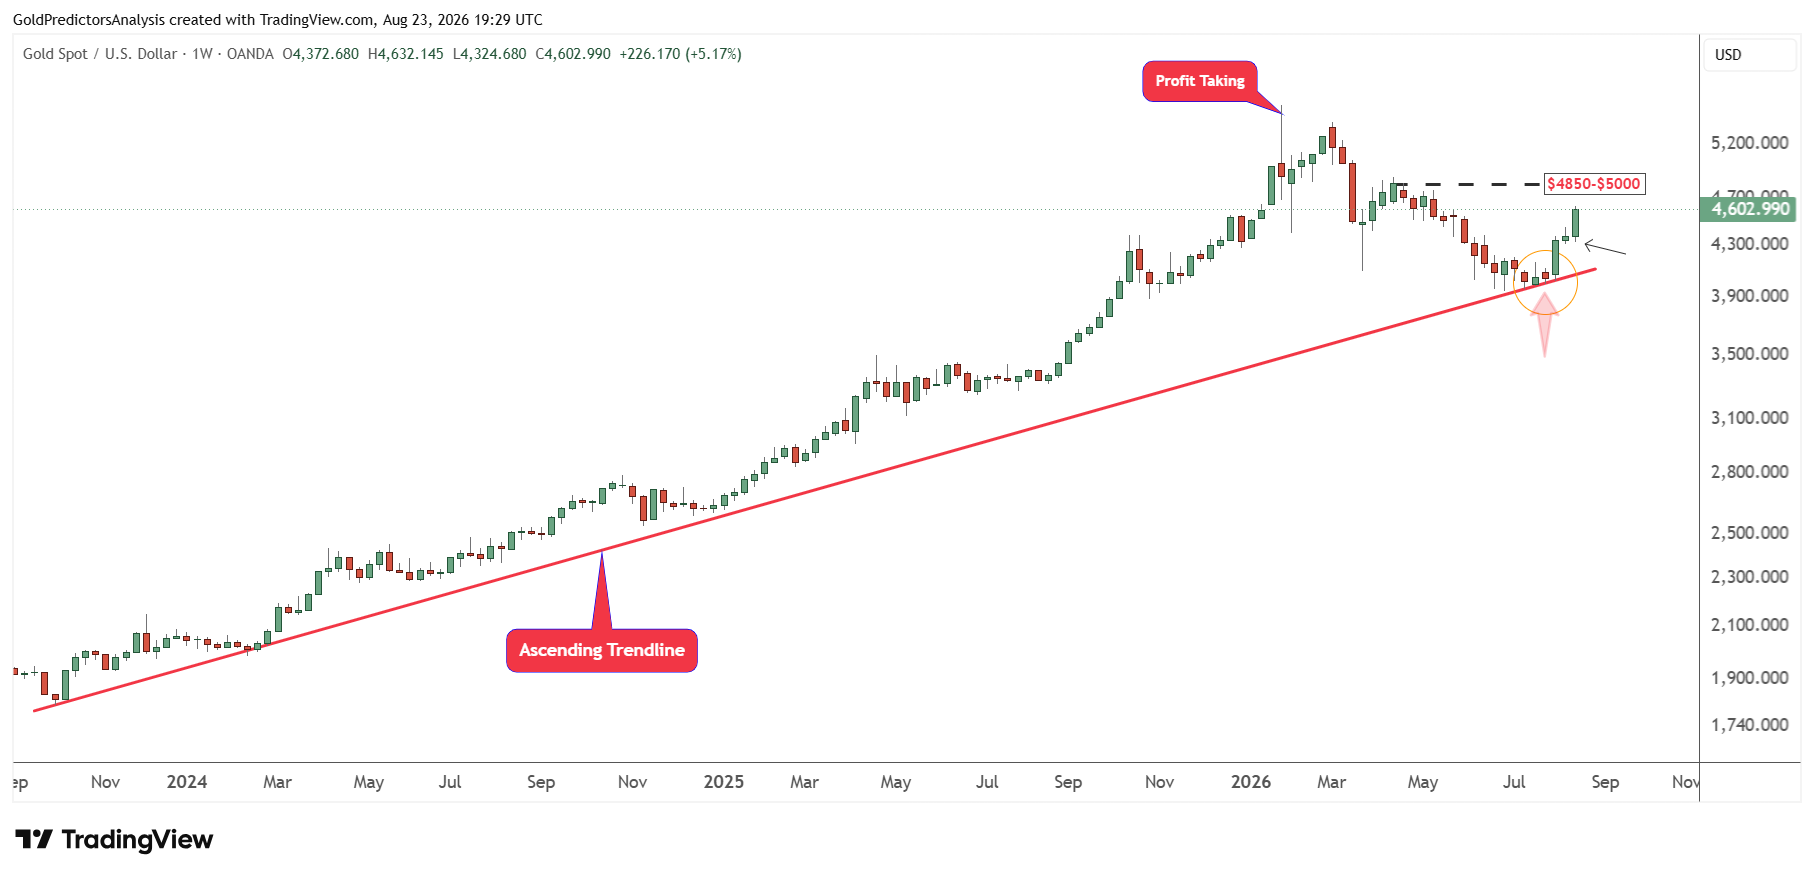
A break above the $5,000 area will open the door for a strong surge in the gold market towards record highs.
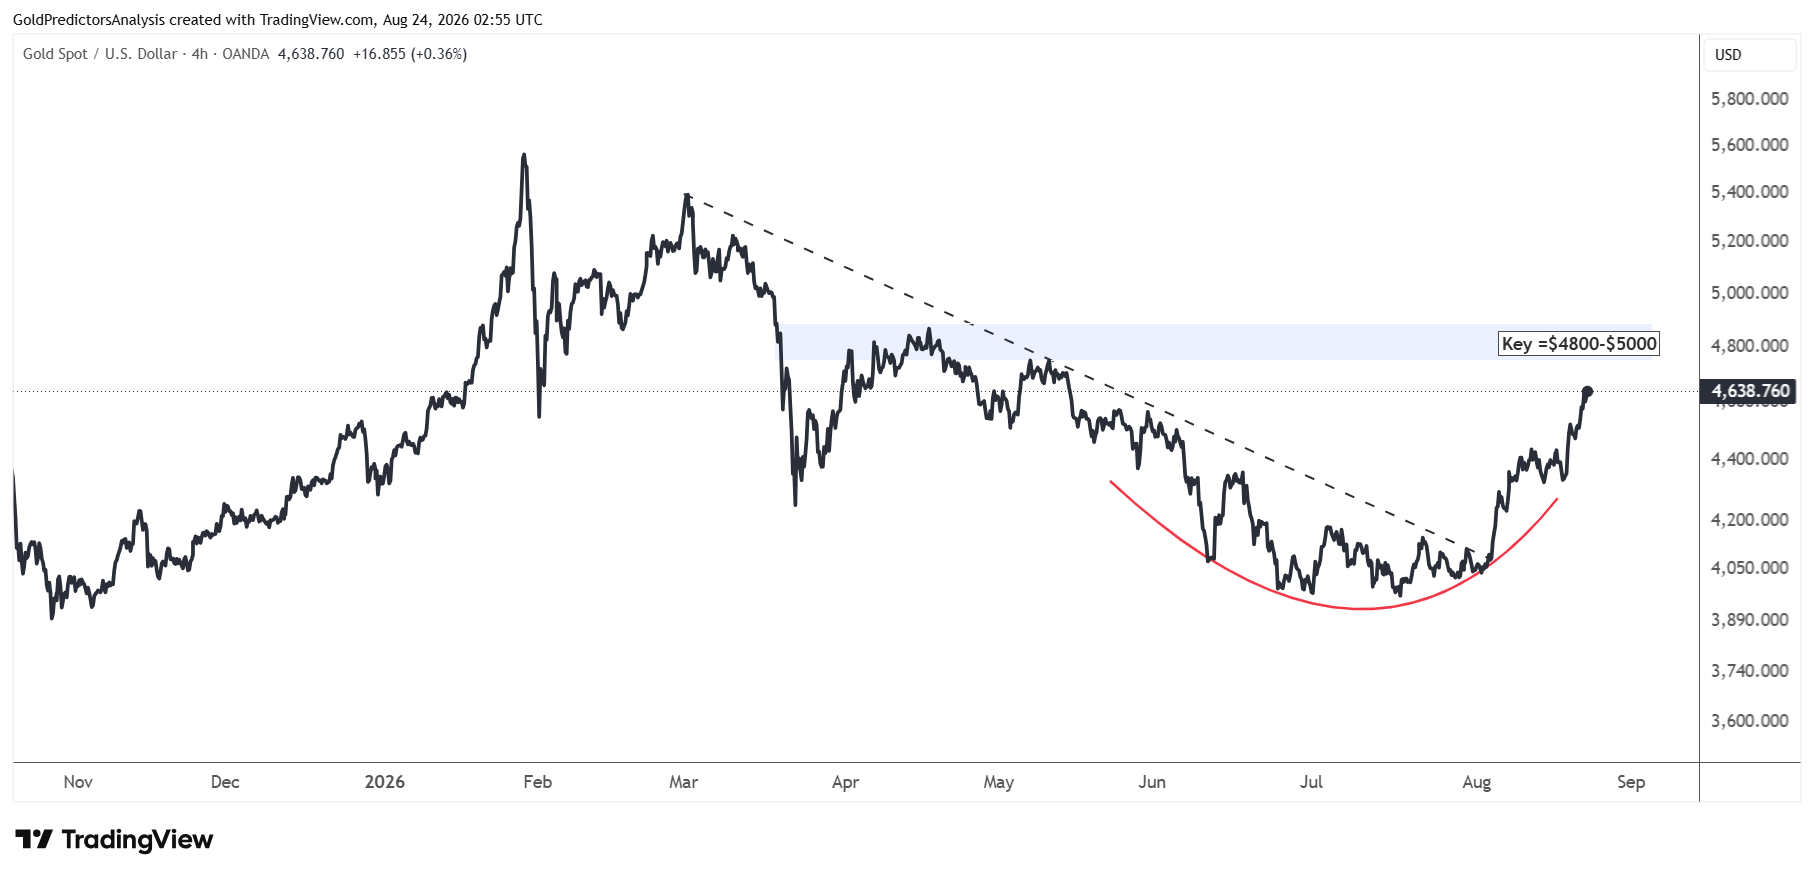
The 4-hour chart for spot gold also shows constructive price action as the consolidation in June and July has formed a rounding bottom pattern. But this bottom pattern will only be confirmed when the price produces a confirmed break above the $5,000 area.
However, the breakout from the descending trend line that stretches from the March 2026 highs indicates that the short term momentum has shifted to the upside.
Gold Price Forecast
Every new Gold analysis as it publishes, today's technical signal and key levels, live price — on one page.
See all Gold forecastsSilver Price Forecast: Break Above $72 Could Target $90
Silver price faces strong resistance at $72. This is a key level in the silver market. But the price has already broken the triangle pattern on the line chart. This breakout indicates that the price may continue to rally toward the $90 area soon. But the price still needs to break above $72 to maintain the strong rally in the silver market.
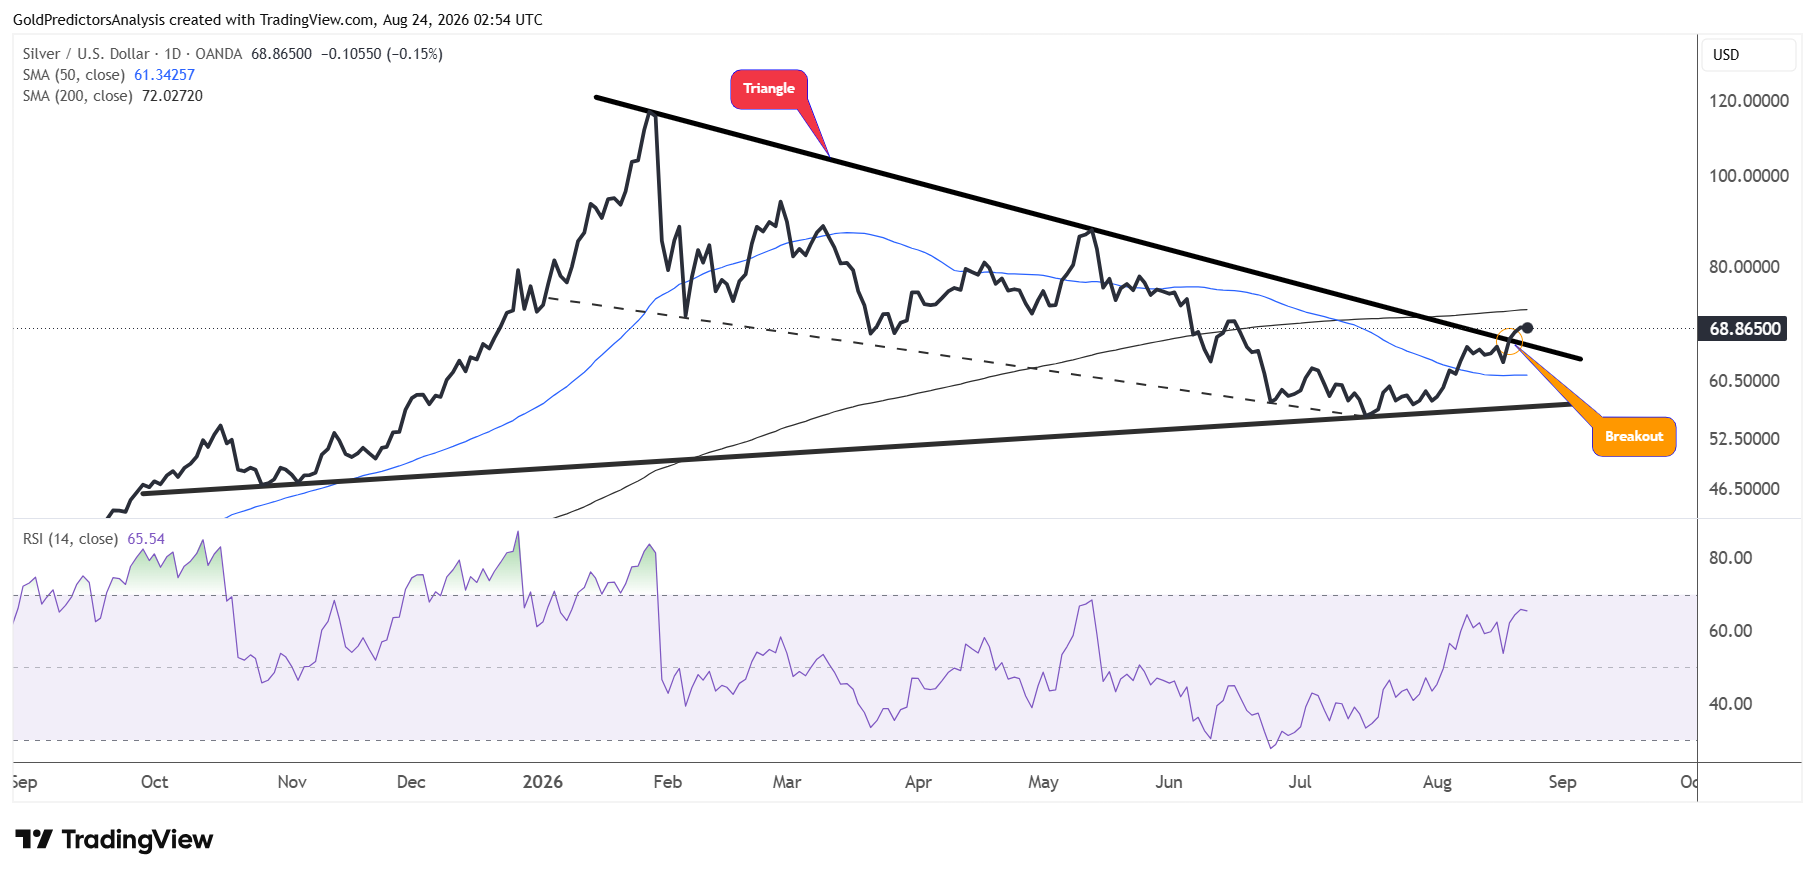
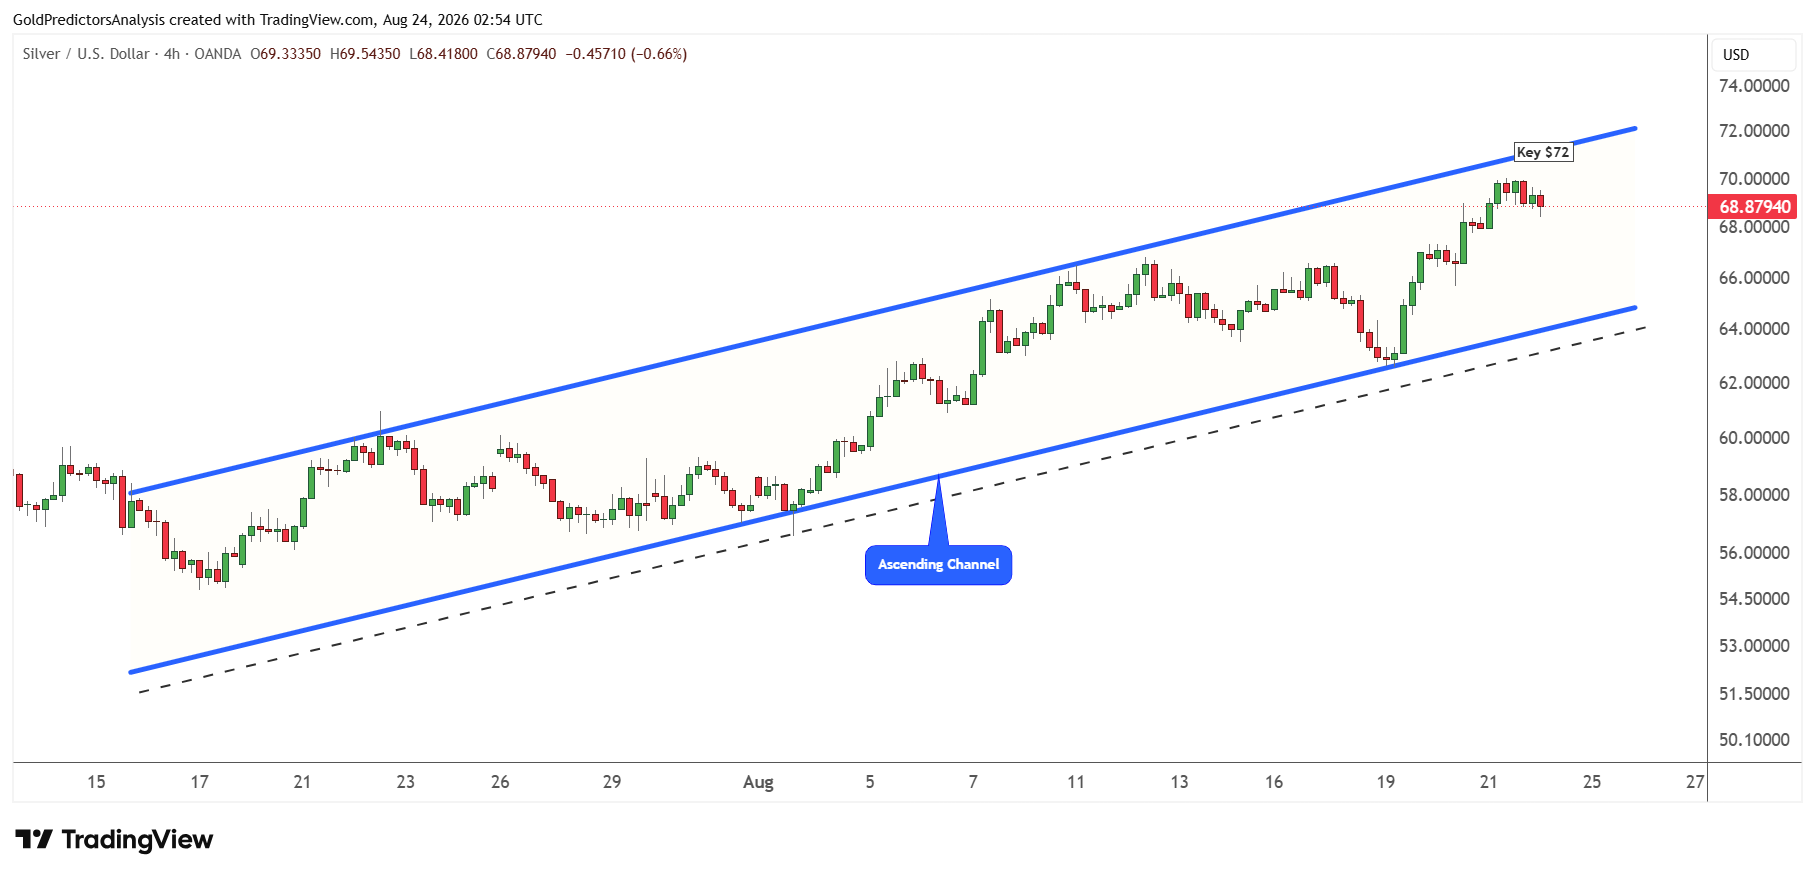
If the price fails to break above $72, it may drop further toward the $60 area. The $72 level in spot silver is also marked by the 200-day SMA. This key level is also observed on the 4-hour chart which shows the formation of an ascending channel pattern. The resistance of the ascending channel is near $72.
Key Levels to Watch
Gold and silver remain in bullish price structures, but both metals are approaching key resistance. Gold must break above the $4,800-$5,000 zone to target the record highs. Silver must clear $72 to open the way toward $90. A weaker U.S. dollar, softer PCE inflation and a cautious Fed message could support these breakouts. But a stronger inflation or hawkish Fed tone could lift yields and trigger a pullback. A break below $4,200 in spot gold and $60 in spot silver may negate the short term bullish price structure.
Read more: Bullish Momentum Builds in Silver as Dollar Weakens