



$100 Oil Broke the Bond Market and Gold Paid for It
Spot gold dropped more than $60 Thursday after traders looked past an as-expected Producer Price Index and sold the metal on crude oil and Treasury yields instead. WTI moved back above $100 a barrel. The 10-year yield broke above 4.90% to its highest since November 2023. The dollar strengthened. All three moved against gold at the same time and the pivot at $4,396.78 failed as support.
The PPI was not the catalyst. Headline producer prices rose 0.4% month over month, matching estimates. Core came in at 0.2%, below the 0.3% estimate. The bond market sold off anyway because crude oil above $100 reset the inflation conversation before the Consumer Price Index Friday.
At 15:30 GMT, Spot Gold (XAUUSD) is trading $4,367.52, down $34.59 or 0.79%. The U.S. Dollar Index is at 99.090, up 0.308 or 0.31%.
Daily Spot Gold (XAUUSD) Technical Analysis
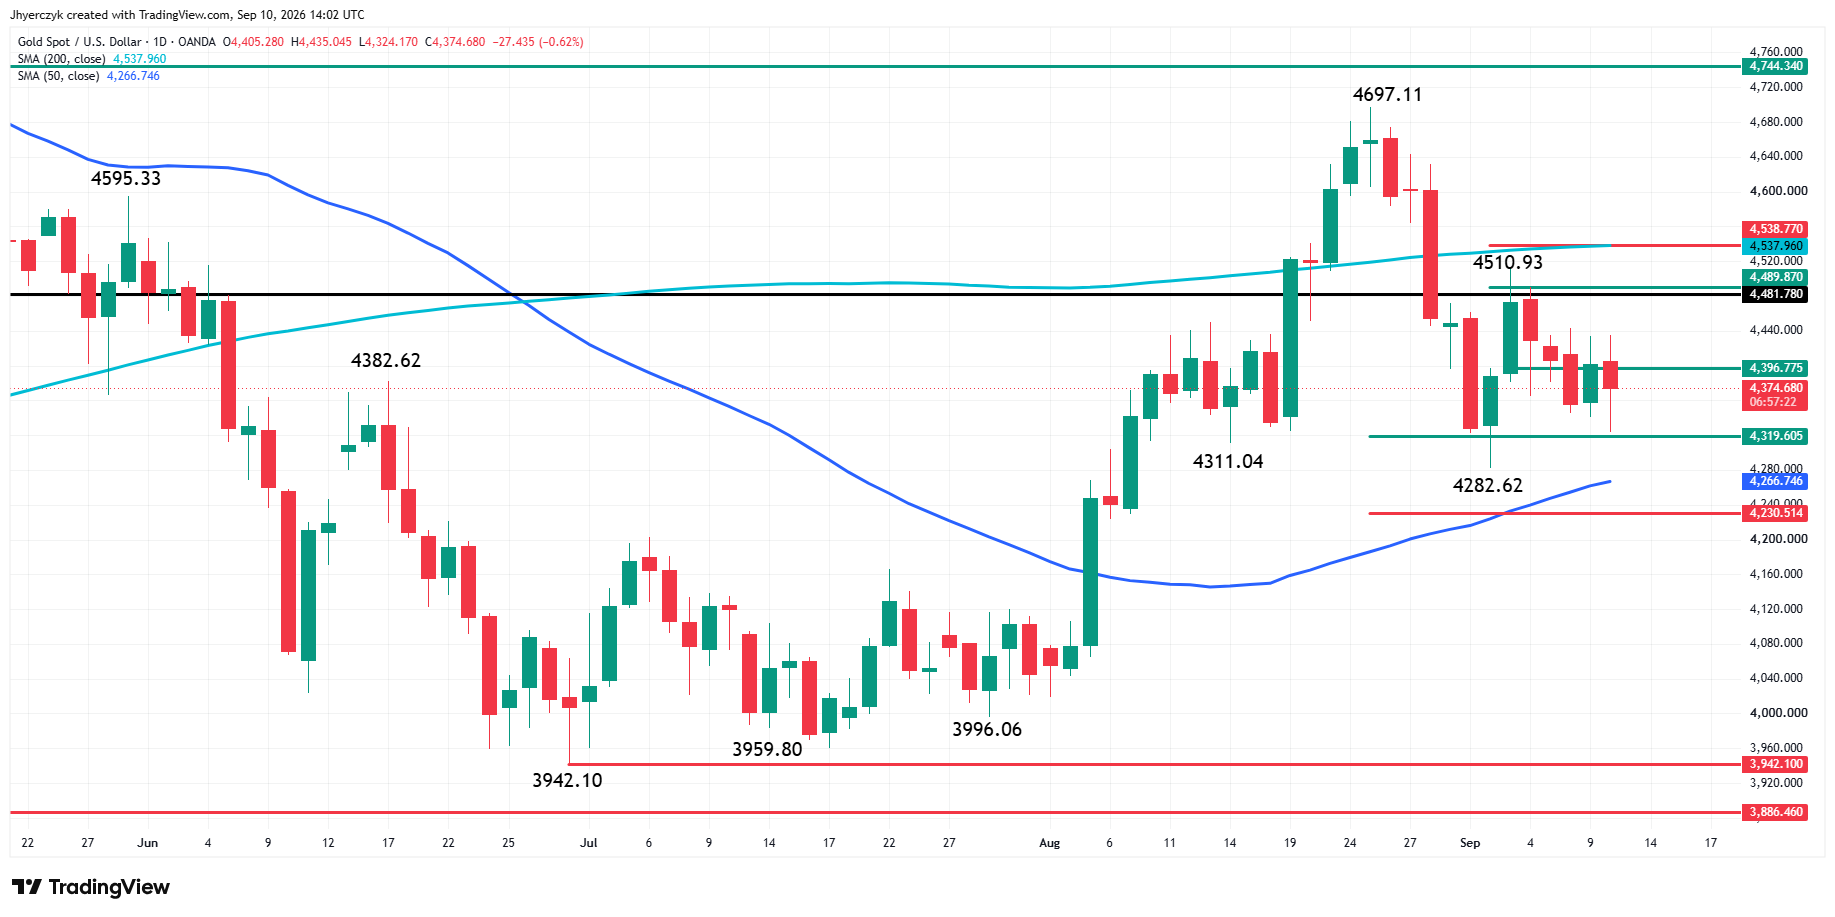
Spot gold is sharply lower on Thursday after being rejected by the minor pivot that is controlling the direction. The main swing chart says the trend is down. But the 50-day moving average at $4,266.76 is indicating strength. This may be helping to generate the four straight days of rangebound trading.
According to the swing chart, a trade through $4,282.62 will reaffirm the downtrend, while a move through $4,510.93 changes the trend to up.
Retracement zone support is $4,319.60 to $4,230.51 and retracement zone resistance is $4,489.87 to $4,538.77.
The 50-day moving average support is $4,266.76 and 200-day moving average resistance is $4,537.97.
The short-term range is $4,282.62 to $4,510.93. Its 50% level at $4,396.78 was the spot to watch earlier in the session. When it failed as support, the selling accelerated. The low of the session is $4,324.17. Because of today’s strong downside momentum, however, the focus has shifted to $4,319.60, which is the top of a short-term retracement zone.
Gold Price Forecast
Every new Gold analysis as it publishes, today's technical signal and key levels, live price — on one page.
See all Gold forecastsThe PPI Was Not the Problem
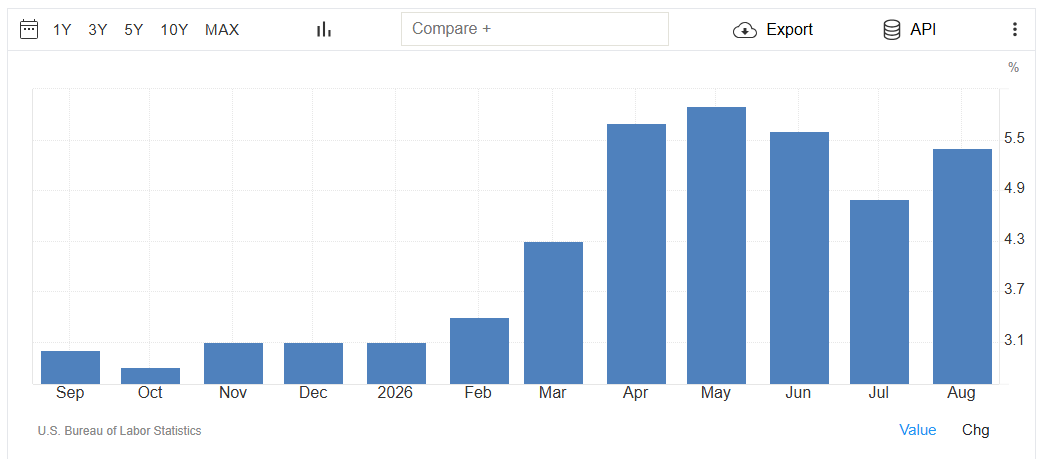
August headline producer prices rose 0.4% month over month, matching expectations. Core producer prices excluding food and energy rose 0.2%, below the 0.3% estimate. The headline was in line. The core was friendly. Gold sold off anyway.
The details inside the report showed where the pressure is sitting. Final demand goods prices jumped 1.1% in August. Energy prices rose 4.2%. Diesel fuel surged 24.1%. Services prices rose just 0.1%. The inflation is in energy, not services.
WTI Back Above $100 Took Over the Session
Crude oil forced the repricing. WTI moved back above $100 a barrel Thursday as fighting between the United States and Iran continued to threaten Middle East supply routes. Traders were handed a PPI report that was in line to slightly soft. The bond market sold off anyway.
The August PPI already showed the energy pressure building through diesel and goods prices. Another sustained run in crude makes the next inflation reports harder for the Fed to look through. Traders were already pricing a 60% chance of a September rate increase. Oil above $100 gives the hawkish side more ammunition even without an upside inflation surprise from the data.
Treasury Yields Broke to Multiyear Highs Without a Hot PPI
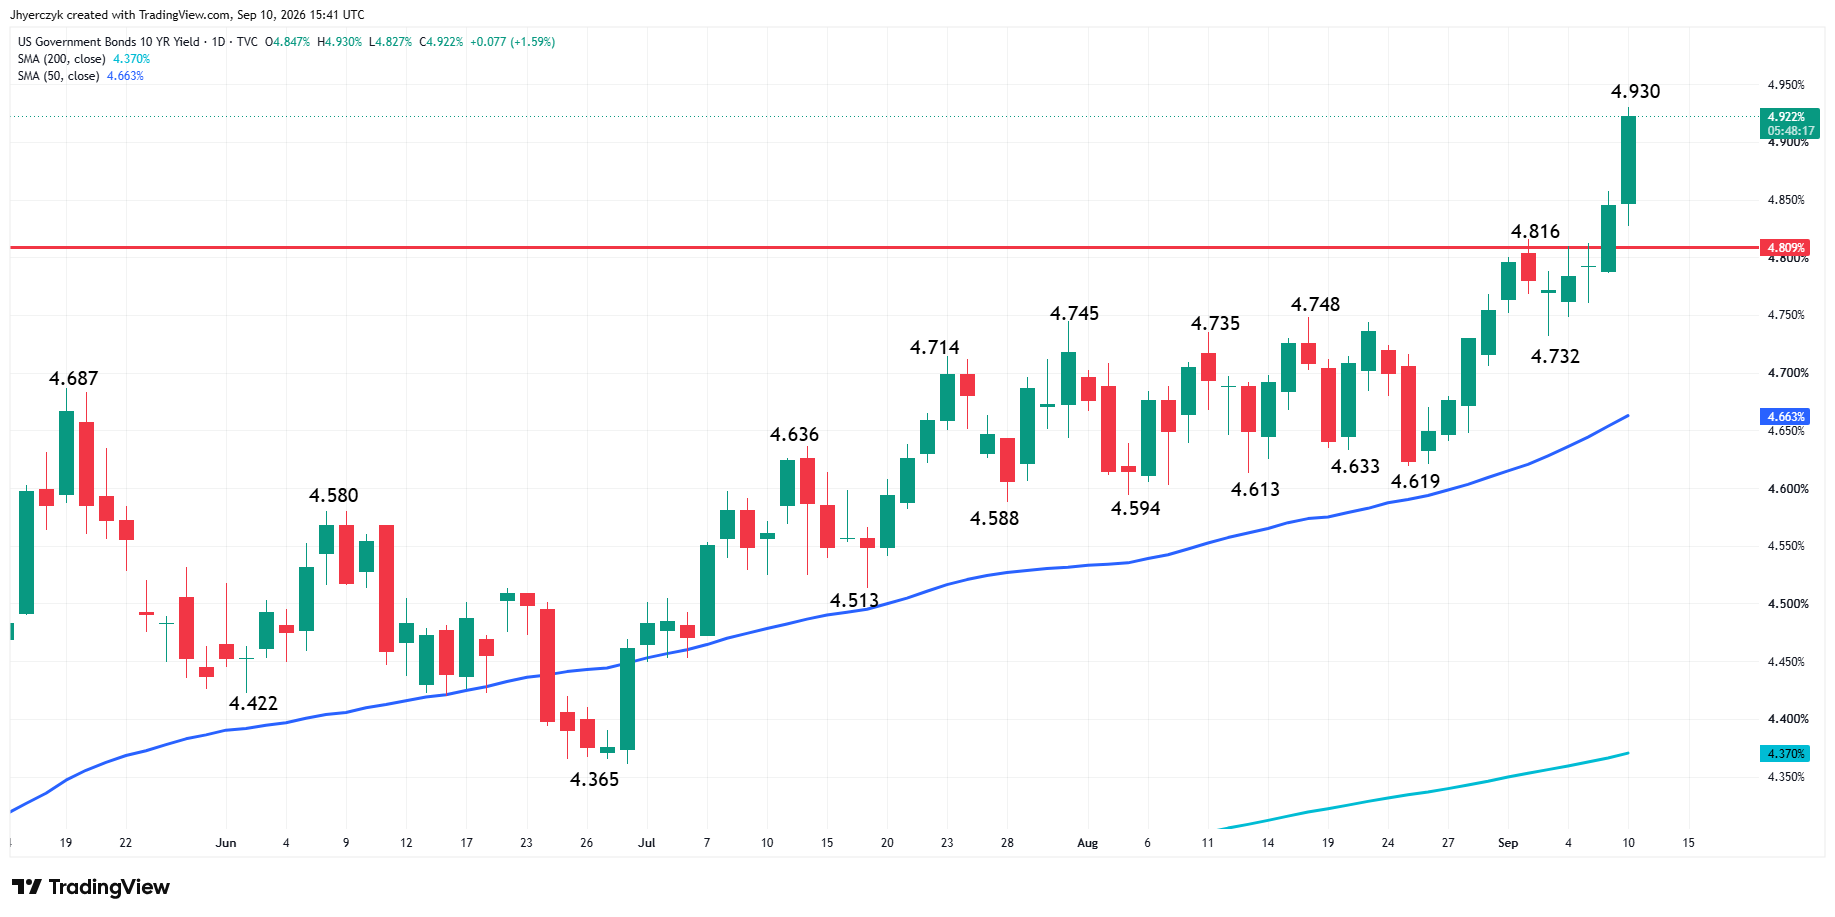
The 10-year yield climbed more than 6 basis points to 4.906%, its highest since November 2023. The 2-year reached 4.501%, its highest since July 2023. The 30-year moved above 5.33%.
The yields did not need a hot PPI to break higher. The bond market is trading the inflation risk coming from energy, not from the producer price data. That made Thursday’s move worse for gold than a hot PPI would have been on its own. The selling came from crude oil driving yields, not from the data.
Wednesday gold rallied more than 1% with yields elevated because the dollar was weakening. That cushion disappeared Thursday.
The Dollar Turned Higher and Removed the Other Support
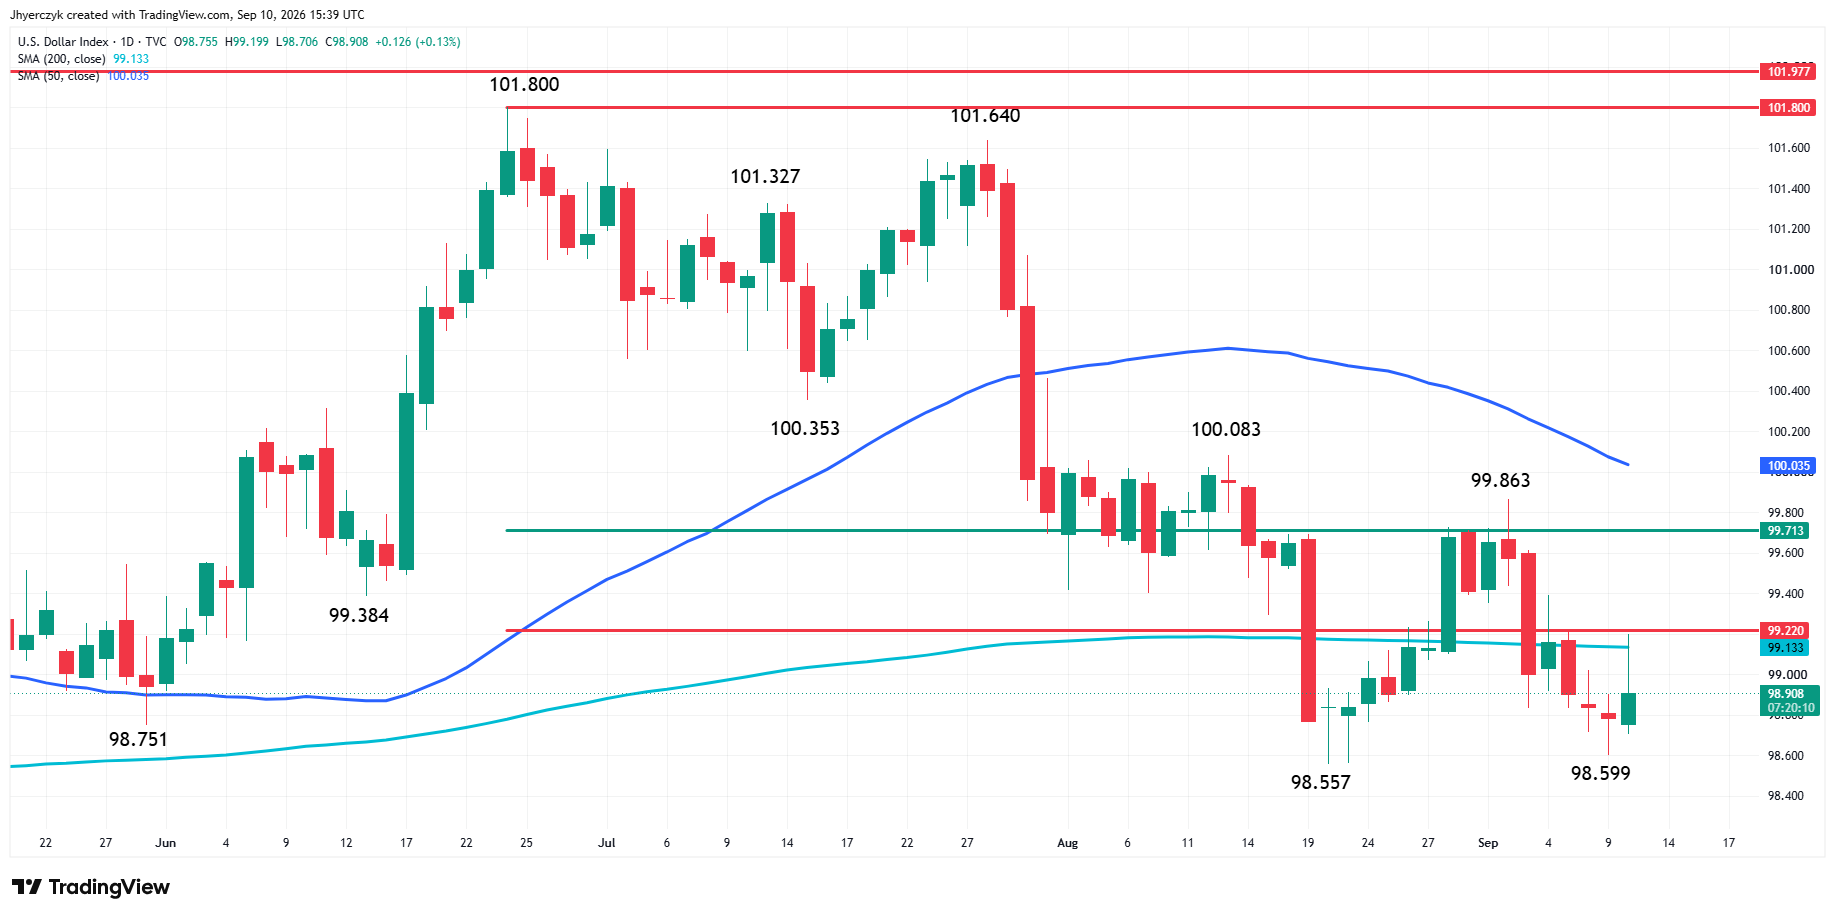
The U.S. Dollar Index is up 0.31% at 99.090. The dollar had been weak all week despite elevated yields. That unusual combination had been supporting gold. Buyers could absorb the bond market pressure because the currency side was still helping.
That changed Thursday. The 10-year above 4.90% and the dollar moving higher at the same time took both supports away from gold. The result is a $60 drop on a day the PPI did not even beat expectations.
Friday’s Consumer Price Index Is Now the Bigger Test
The Consumer Price Index Friday was already the more important report. Thursday’s oil and yield moves made it even more significant.
A soft CPI gives the bond market a reason to question Thursday’s yield surge. A hot CPI with oil already above $100 and yields at multiyear highs reinforces the September rate-hike case. Thursday showed gold does not need a hot inflation print to sell off if yields keep climbing on crude.
What to Watch
Friday’s Consumer Price Index is the next test for gold after Thursday’s $60 drop. The bond market broke yields to multiyear highs without a hot PPI. Crude above $100 did the work. The CPI decides whether that pressure holds or whether the bond market takes some of it back before the Fed meets September 15-16.
The bias remains to the downside with the trend down and the pivot at $4,396.78 now acting as resistance after failing Thursday. Sellers are targeting $4,319.60. A break of that level extends the move into the support cluster at $4,282.62 and the 50-day moving average at $4,266.76. The Consumer Price Index Friday gets the last word before the Fed meets September 15-16.
If you’d like to know more about how to trade gold, please visit our educational area.