Gold Catches a Bid but the Fed Decides If It Holds
Gold is higher Wednesday because the three forces that hammered it all week let up at the same time. Oil came off Tuesday’s highs. The 10-year slipped below 5%. The dollar stopped climbing against the yen, the euro and the New Zealand dollar. That was enough to start the first real short-covering rally since the selloff began Monday. It is a pre-decision trade and nothing more. The Fed is expected to raise rates at 18:00 GMT with inflation above target and crude above $100. Warsh talks at 18:30 GMT. Everything between now and then is positioning.
At 13:45 GMT, Spot Gold (XAUUSD) is trading $4342.42, up $48.54 or +1.13%.

The 10-Year Below 5% Was All Gold Needed
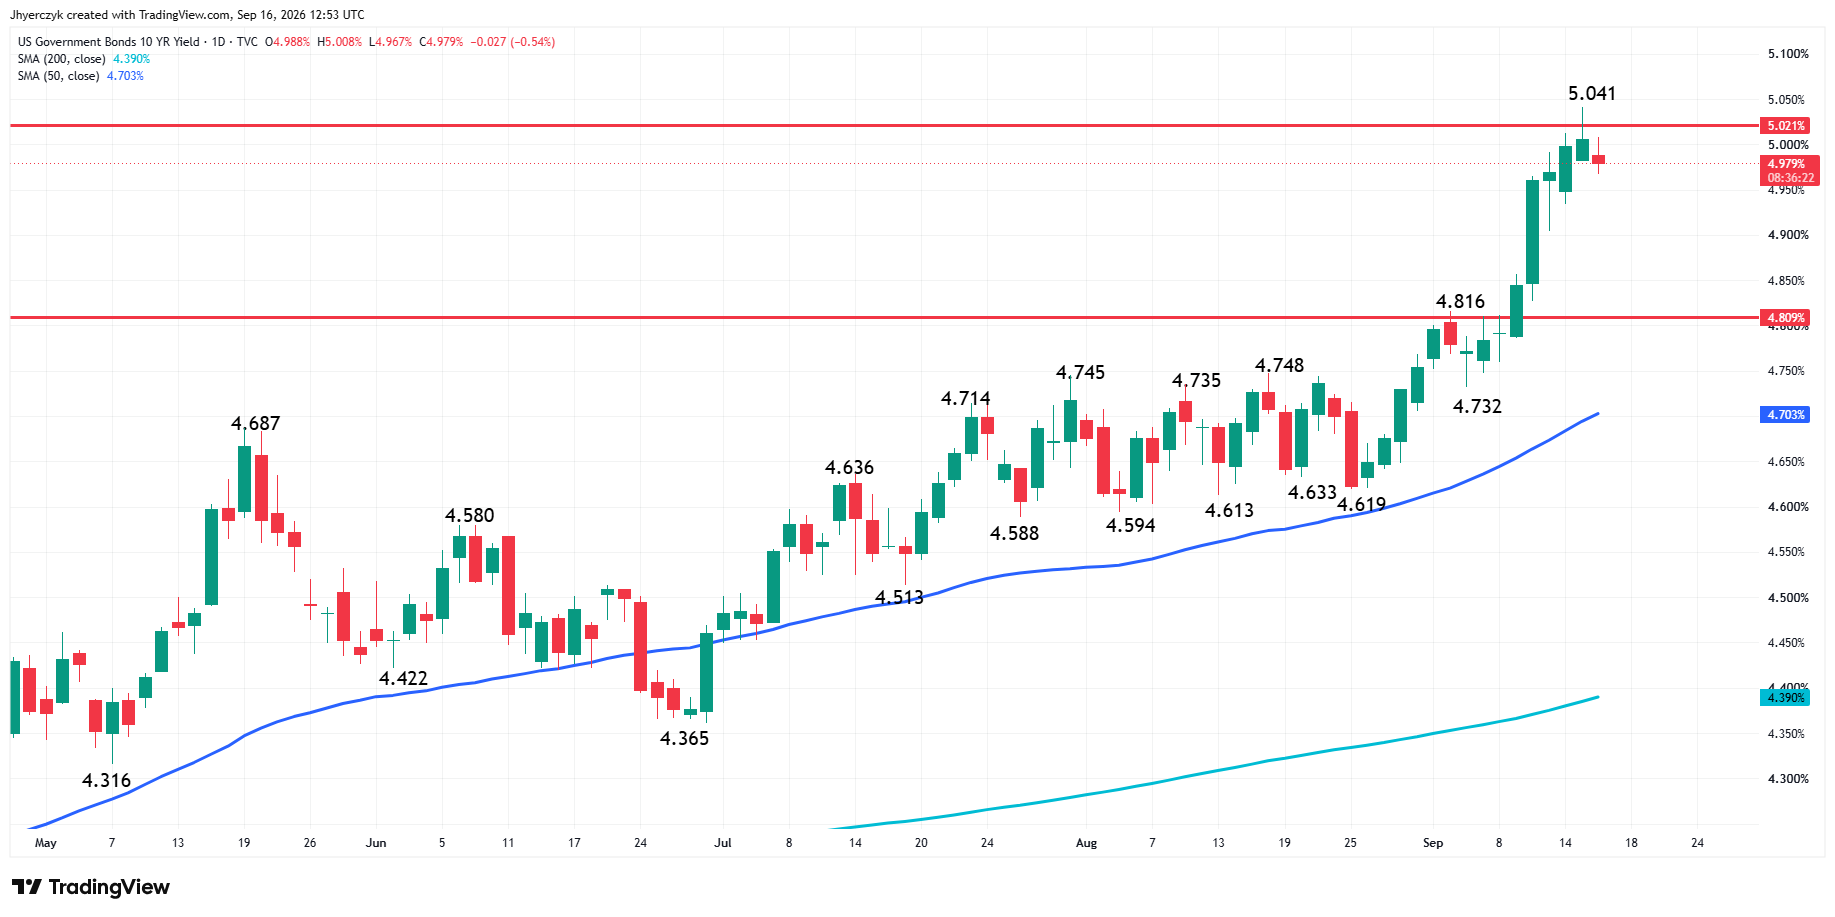
The 10-year dropped to 4.973% Wednesday. The 30-year eased to 5.347% and the 2-year fell to 4.634%. First time all three moved in gold’s direction since Monday. Tuesday’s article called 5% the line and the slip below it gave sellers a reason to cover ahead of the announcement.
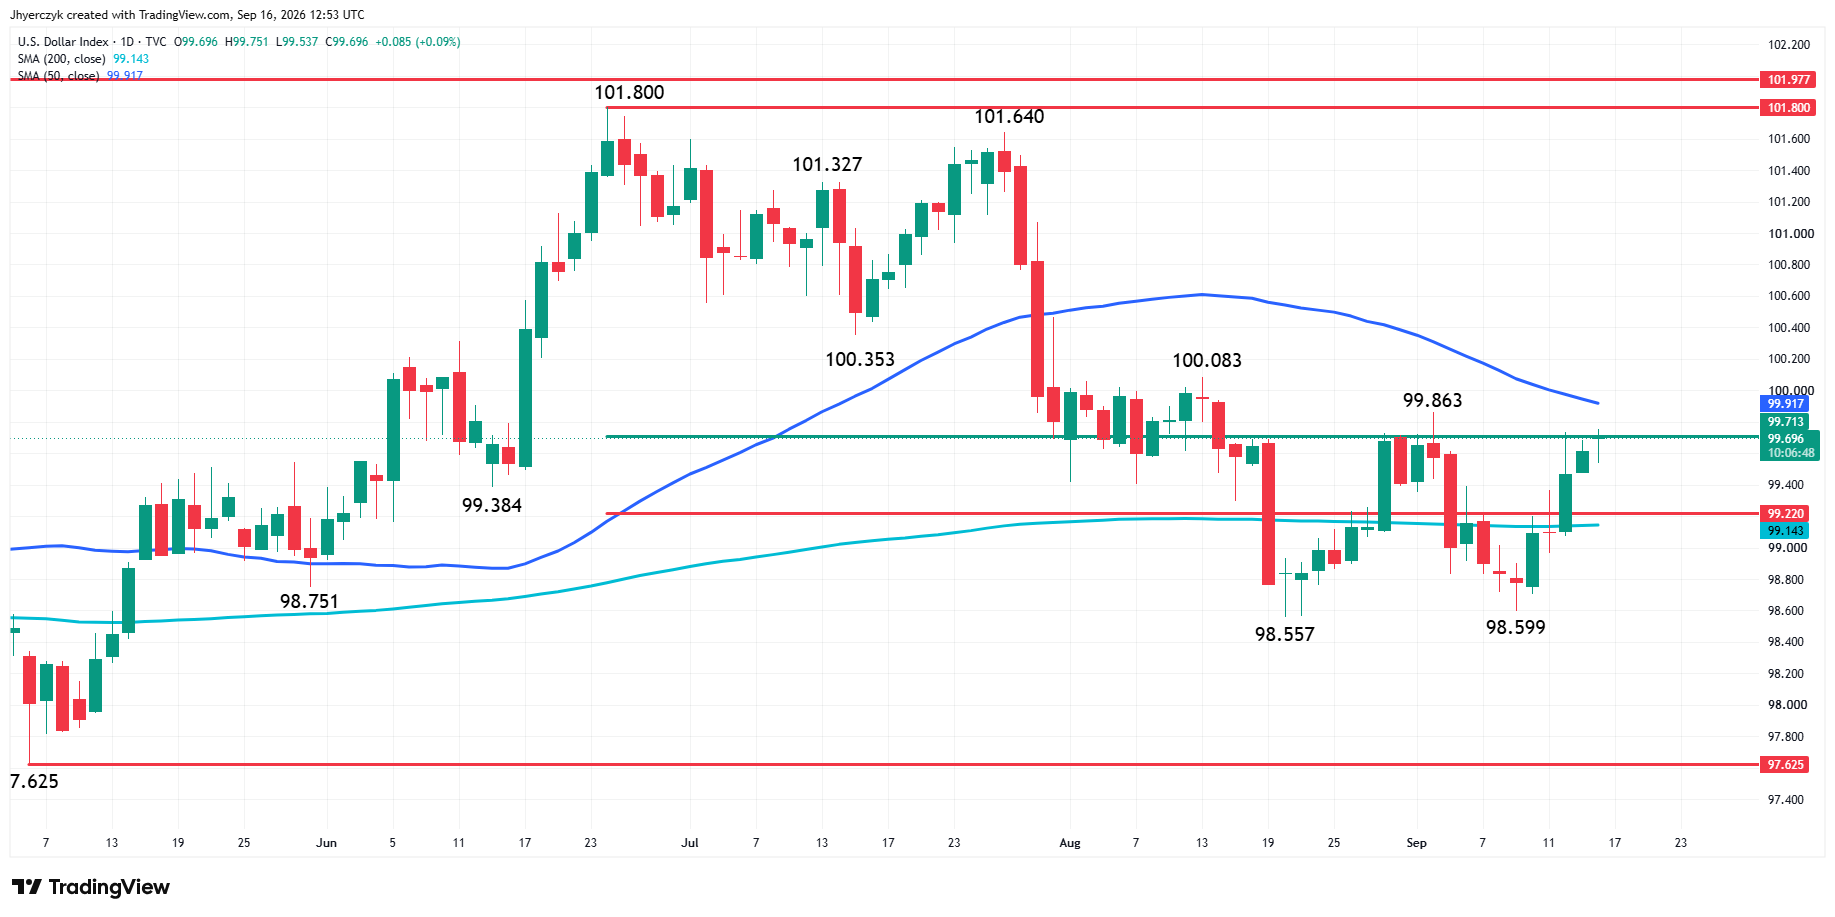
The dollar index held near 99.67 but stopped advancing. It has been gaining all week against every major currency. Wednesday’s stall came with the yield pullback and the combination opened the window for gold. That window stays open only as long as the 10-year stays below 5%. A move back above that level after Warsh talks and the bounce is over.
Gold Price Forecast
Every new Gold analysis as it publishes, today's technical signal and key levels, live price — on one page.
See all Gold forecastsCrude Gave Gold Room but Has Not Left the Building
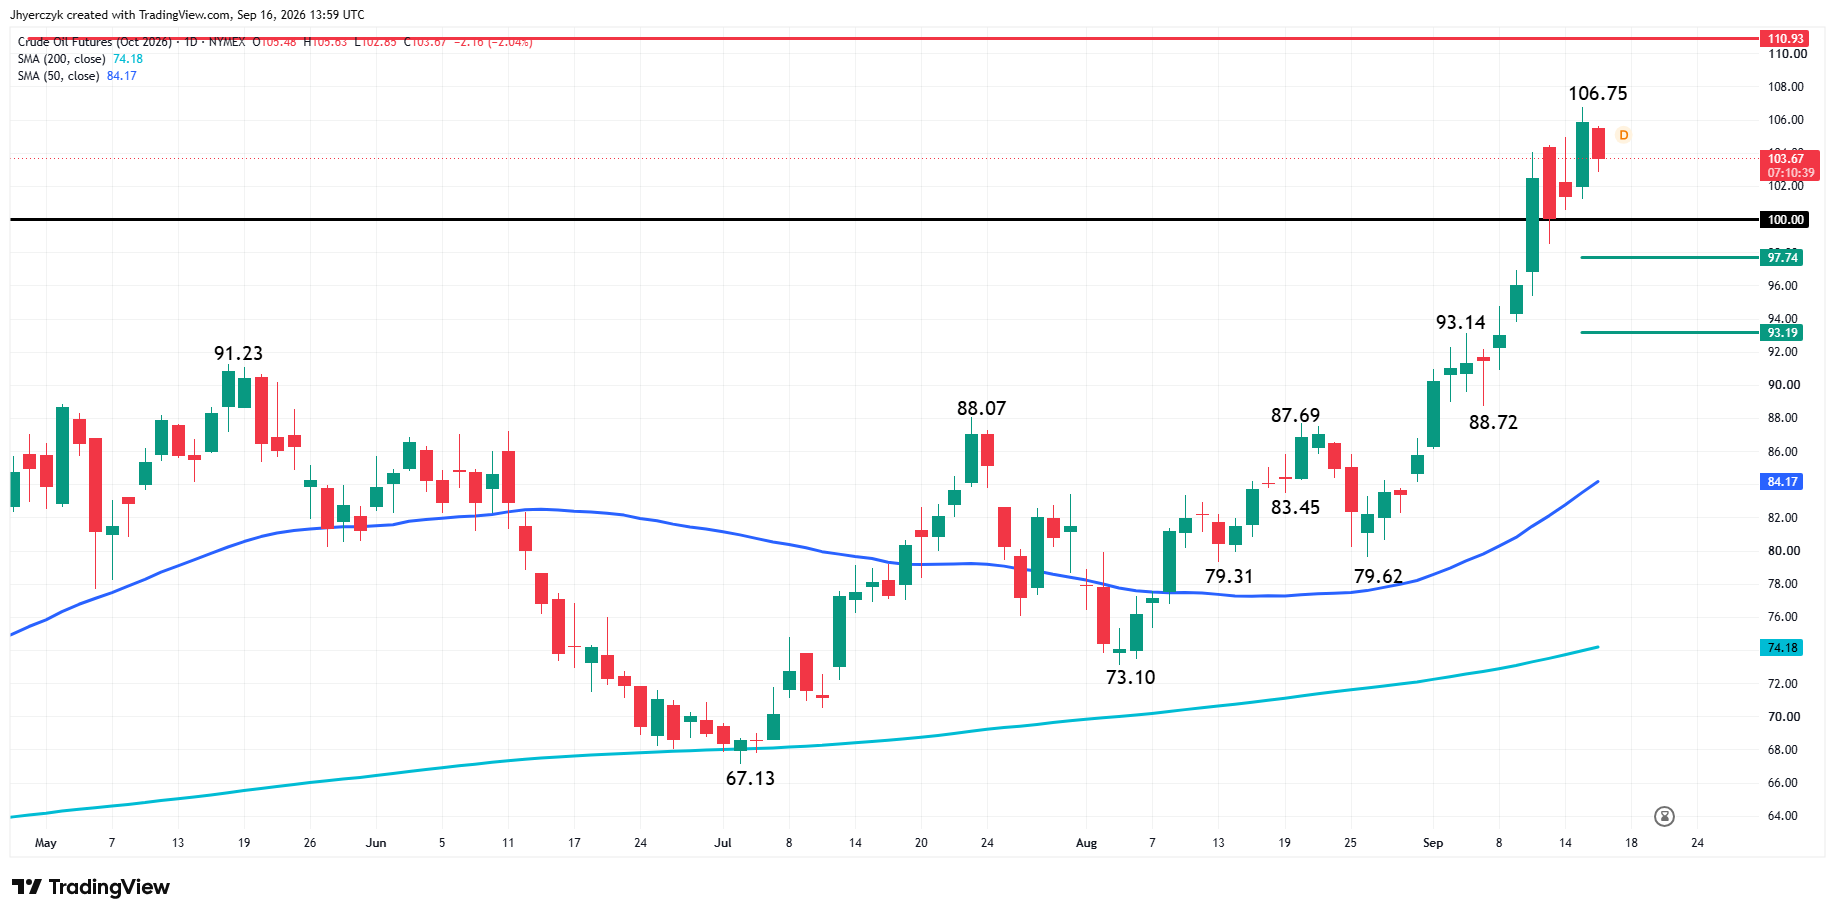
The American Petroleum Institute reported a 7.1-million-barrel crude build Tuesday night. WTI slipped toward $105. Brent fell toward $108. Gold got the lift because the immediate inflation pressure came down with the barrel price.
The Saudi pipeline is damaged. Hormuz is thin. Diesel is at record highs in Europe and above $6 in the U.S. None of that changed on the API number. Crude backed off a data point. The physical shortage underneath the oil trade did not respond. If oil turns higher after Warsh talks, the inflation argument walks right back into the gold market and this morning’s bounce becomes the setup for another selloff. The metal needs crude to stay off Tuesday’s levels through the press conference and that is a lot to ask with the supply story still running.
Gold Needs One Thing From Warsh
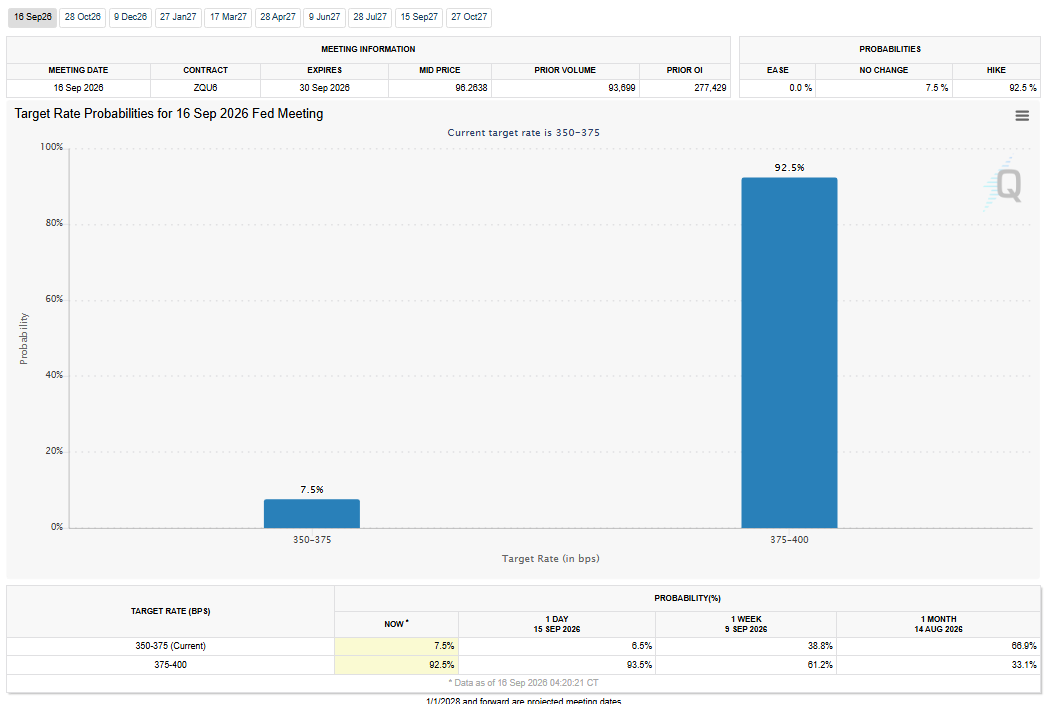
Fed funds futures have the hike at 93% odds. The move lifts the target range to 3.75% to 4.00%. August CPI showed annual inflation at 3.4%. The PCE measure rose 3.7% annually in July. Crude above $100 on top of those numbers is what Warsh has to address at 18:30 GMT.
Gold does not need Warsh to sound dovish. It needs him to sound done. One hike, one acknowledgment that recent data required a response, and then nothing about December or oil keeping inflation elevated into year-end. That is a narrow path and the market knows it. Warsh has spent the last three months talking about prices being too high. Asking him to stop now with crude above $100 is asking a lot. But gold’s bounce today is built entirely on the bet that he will.
The Bank of Japan meets Friday with expectations for a rate hike to a 31-year high. Two major central banks tightening in the same week is not the backdrop gold buyers want. The Fed is the one that matters more but the BOJ adds weight to the wrong side of the scale.
Daily Spot Gold (XAUUSD) Technical Analysis
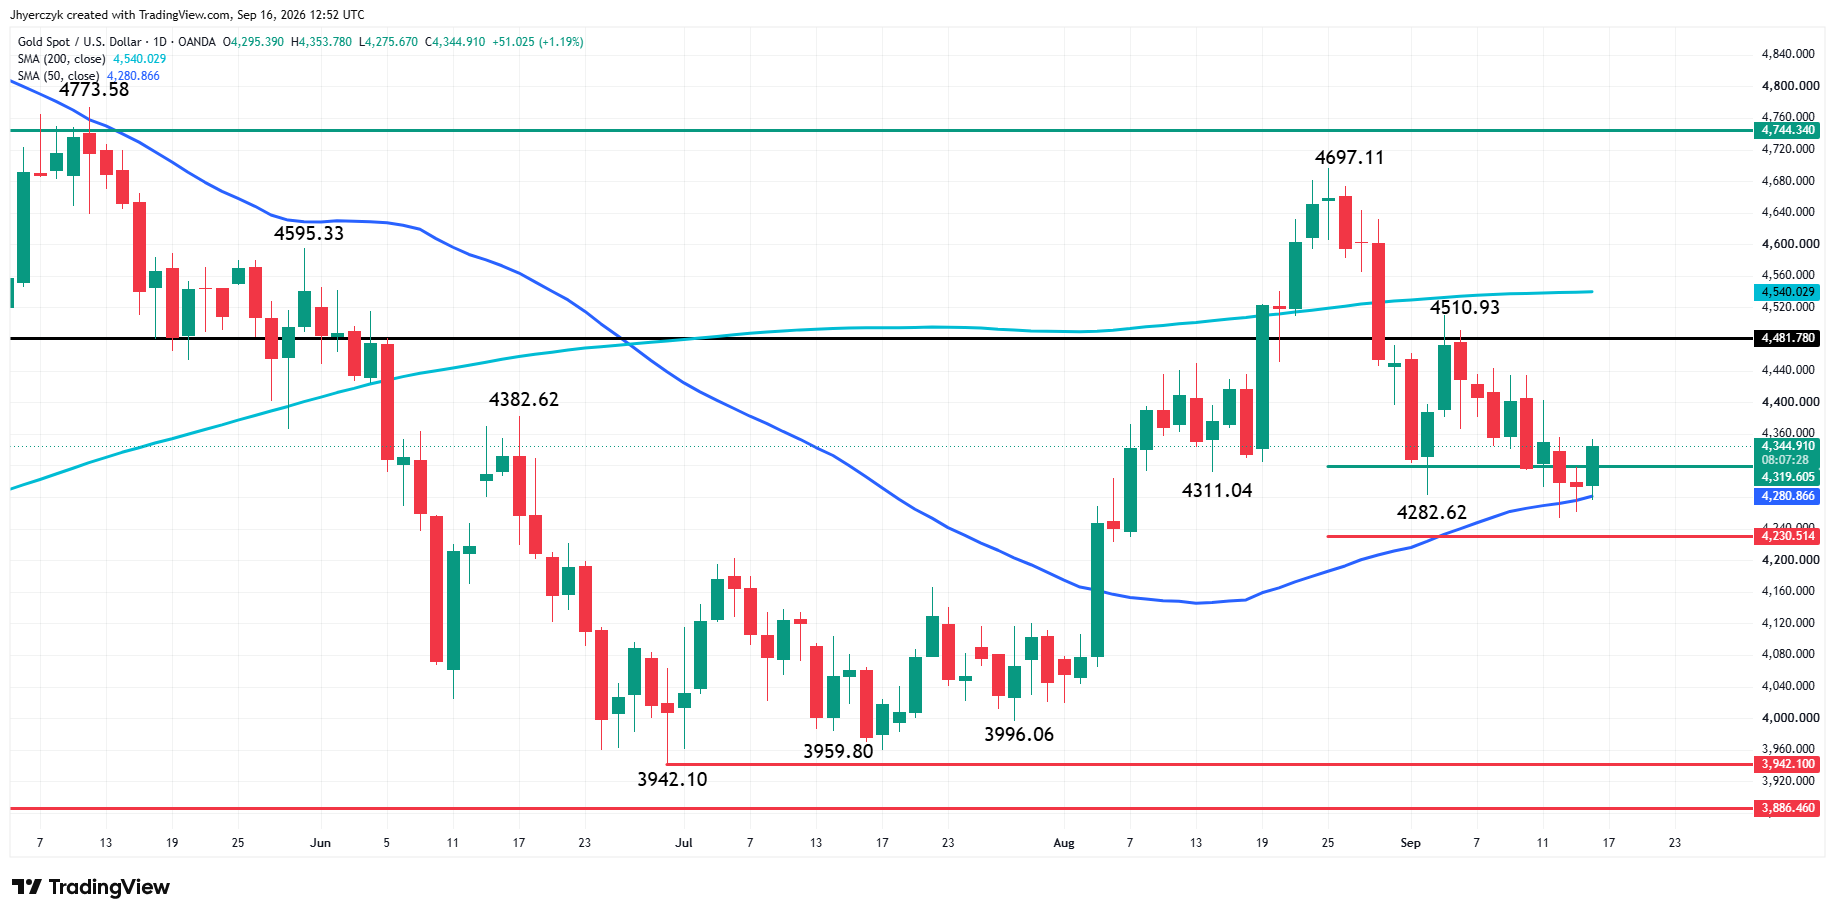
Spot Gold is edging higher on Wednesday after a third successful test this week of a key retracement zone and short-term moving average. The main trend is down according to the daily swing chart. A trade through $4253.63 will signal a resumption of the downtrend. The trend changes to up on a move through $4510.93.
The market is trying to establish support at the 50-day moving average at $4280.99. The 200-day moving average at $4540.06 is resistance.
The short-term range is $3942.10 to $4697.11. Its retracement zone is $4319.60 to $4230.51. On September 2, Spot Gold made a low from inside this zone at $4282.62. It led to a rally to $4510.93. This week, the market hit a low on Monday at $4261.38. Today, it hit an intraday high at $4360.50.
A new minor range has formed between $4510.93 and $4253.64.
What to Watch
Wednesday comes down to one press conference. The market already paid for the hike. Gold already got the bounce from yields slipping below 5% and the dollar going quiet. Now Warsh has to talk and everything gold gained today is on the table. If he sounds like December is still live, this morning’s rally was the exit for late shorts, not the start of a recovery. If he sounds finished, gold has room to run because the metal held its floor three times this week while yields were at their worst and sellers could not break it.
The bias leans bearish with the main trend down on the daily swing chart, but the bears have a credibility problem. The 50-day moving average at $4280.99 and the retracement zone at $4319.60 to $4230.51 stopped the selling Monday, Tuesday and again Wednesday morning. Three tests and three failures to break through is not a pattern that gives sellers confidence heading into a Fed decision.
A push through $4382.28 would be a normal retracement and not a threat to the trend by itself. A move beyond it is different. That puts the main trend at risk with the swing top at $4510.93 as the level that changes direction.
On the downside, a break through $4253.63 would finally end the support defense that has been frustrating sellers all week with $4230.51 as the level where the real damage starts.
If you’d like to know more about how to trade gold, please visit our educational area.