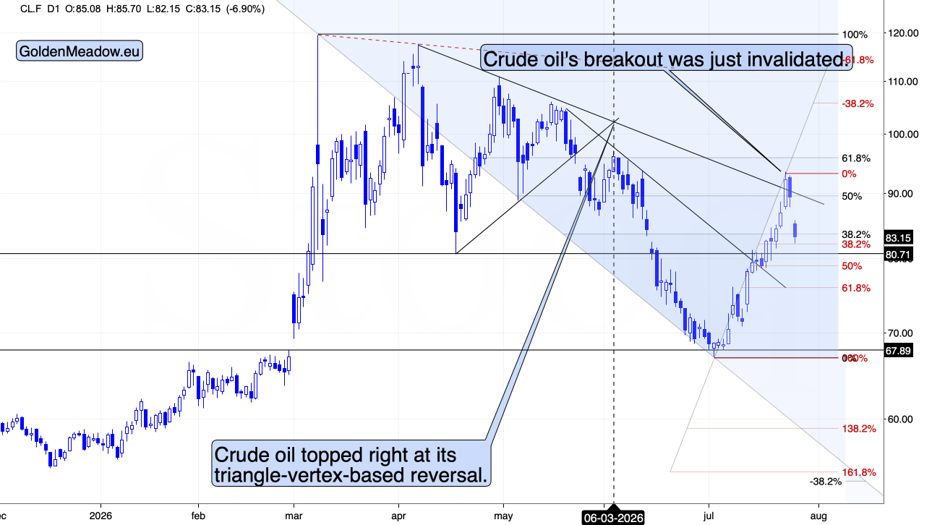
On Thursday I wrote that crude oil had rallied almost without a break for three weeks and had run into a strong resistance area built from the 50% and 61.8% Fibonacci retracements, the June highs, and the declining resistance line. I noted the small breakout above that line and said that given the volatility, it could be invalidated any minute. Then I added the part that matters now: the fundamental situation fully supports the rally, but still, corrections happen anyway.
On Friday, the breakout was invalidated. Crude opened at $92.50, reached $92.81, and fell back under $90. It did that on a day when Iran rejected a ceasefire proposal, American strikes ran into a twelfth consecutive night, Trump told Axios he was considering a massive attack bigger than anything in the war so far, and Brent had traded above $100 for the first time since May. I wrote that afternoon that the chart had beaten the news.
Late on Friday, after the close, the Pentagon suspended the bombing campaign. Trump ordered the military not to carry out strikes that had already been approved.
Over the weekend there were no American attacks at all. Iran said it would halt its own strikes as long as the pause held. Oman shuttled technical talks on the Strait in and out of Tehran, and a deal began taking shape around Iranian-run vessel transit with fewer restrictions on shipping.
This morning, crude collapsed, down roughly 7% in West Texas Intermediate, with Brent falling further still.
Technical Resistance Outruns Geopolitics
Now let’s talk about what that sequence means. When I wrote about that resistance area on Thursday, I had no idea the bombing campaign was about to stop. Nobody outside a very small circle in Washington did. The decision had not been (officially) made. Every fundamental input available to me argued for higher oil prices, and I said so in the same paragraph where I flagged the level. The chart marked the end of the rally before the reason for it (officially) existed.
This is the part of technical analysis that I find remarkable even after decades of it, and I want to be careful about how I describe it, because there is nothing mystical here. A price chart is a record of what everyone did, including the people who sit closest to the information. Resistance is not a magic number. It is a price where sellers who have already made up their minds are waiting, and some of those sellers know things the rest of us read about later. When a rally runs three weeks without a pause and arrives at a level where several forms of resistance overlap, the buying that carried it there has to be replaced by fresh buying at worse prices. Often it is not. The market turns, and then the news catches up and gets the credit.
The practical lesson is the one I keep coming back to. If we wait for the fundamental picture to confirm a turn, we are late, because the fundamental picture is at its most convincing precisely when the move is finished. On Thursday, the case for higher oil had never looked stronger. That was the moment the chart said the rally was done.
To clarify, in the case of long-term investments, it doesn’t matter that much if one is a bit early or a bit late, as the price moves around turning points are not that significant compared to the big price moves. However, the more one zooms in, the more it matters.
Gold Price Forecast
Every new Gold analysis as it publishes, today's technical signal and key levels, live price — on one page.
See all Gold forecasts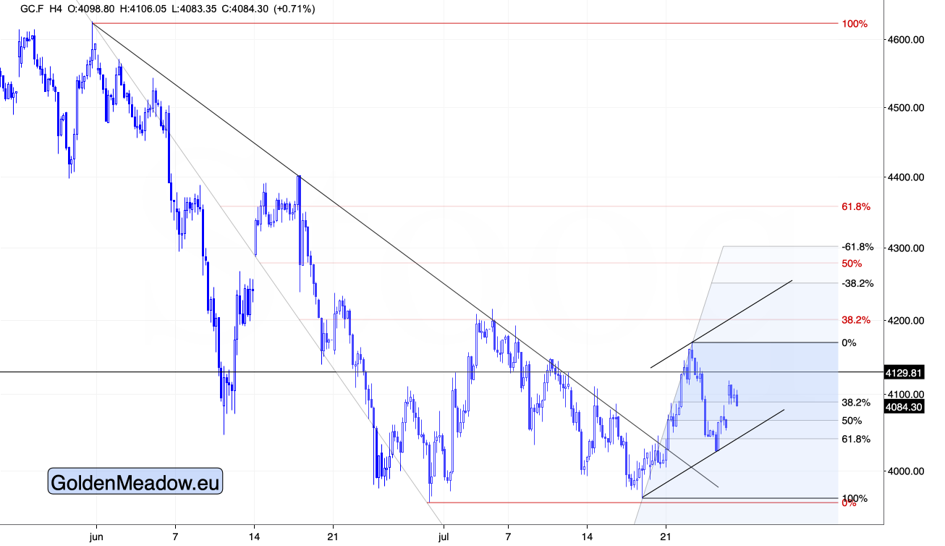
Gold Fails to Collect the Peace Dividend
Which brings me to gold, and to a number that deserves more attention than it will get.
Everything that has pressed on the precious metals for a month has reversed this morning. Oil is collapsing. The inflation impulse that pushed the odds of a September rate hike from roughly half to above 80% in a single week is unwinding in a single session. Rate-hike expectations are being pulled back ahead of Wednesday’s Federal Reserve decision. The dollar is easing. This is my own mechanism running in reverse at full force, and it is unambiguously favorable for gold.
Gold is up less than one percent today.
Let’s compare it with the mirror image. On the eighth of July, crude rose 6.79% on the American strikes, and gold fell 2.18% that day. Today crude has fallen by almost exactly the same amount, in the opposite direction, and gold’s gain is a small fraction of that decline. Same driver, same magnitude, opposite sign, and the response is a shadow of what it was.
That asymmetry is the signature of a (gold) market in a downtrend. It reacts to bad news immediately and completely, and to good news slowly and partially. I described this pattern in the middle of the month when two soft inflation prints bought gold about twenty dollars, and silver went to a new low anyway. Today gives the cleanest measurement of it yet, because the input is the same size in both directions and the output is not.
Let’s look at what the equity market did with the same news. Dow futures rose about 550 points, the S&P added around 1%, and the Nasdaq did better than that. Stocks took the peace dividend with both hands. Gold barely showed up to collect it.
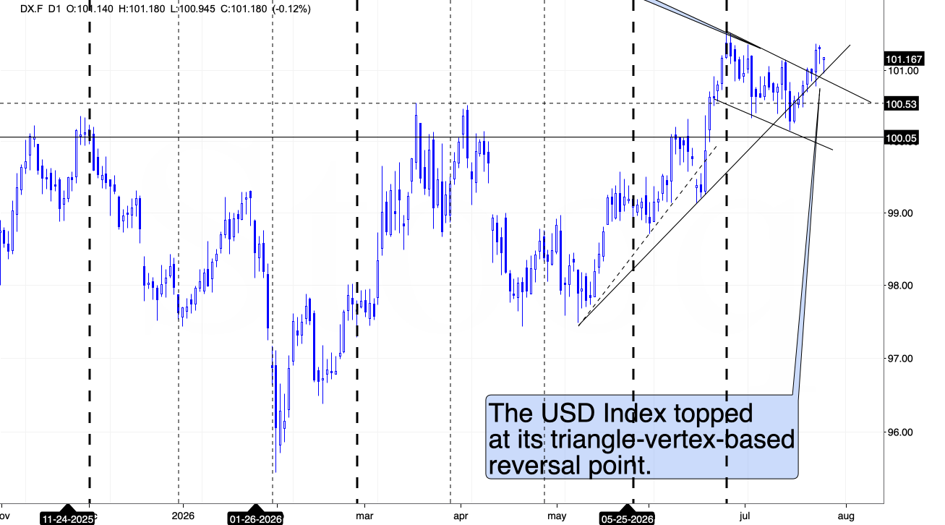
In the case of the USD Index, it seems that we’re almost there. I mean, we’ve got a weekly close above the flag, and today will – likely – be the third day above it. There’s one thing that makes me think that we’ll still get another small move down.
That’s the USD’s tendency to reverse its course close to the turn of the month, and what tends to happen beforehand if the preceding move was a rally. I marked those cases with thick, dashed lines. We saw at least a few days of declines, not just a one-day move lower. This suggests that we need a day or a few days at the current or lower price levels before the move is over.
The month ends this week, so the above would perfectly fit the scenario in which we see a few additional days of the moves. This would give precious metals and mining stocks enough time to reach their target areas, given the current pace.
Also, the USD Index topped right when the support and resistance lines crossed. This technique worked once again.
One caution: nothing has changed on the water. Iran’s negotiating office still says the Strait is closed, the Revolutionary Guard says its navy turned back four vessels in the past day, and one tanker crossed Hormuz on the twenty-fourth of July against fifty on the same date a year ago.
The Saudi front is escalating rather than calming, with Houthi attacks setting Aramco refineries alight. And the bombing stopped not because of a breakthrough but because Trump’s advisers warned that the military was running short of viable targets and that interceptor stocks were being drawn down toward nothing. Oil has fallen 7% and more on a bombing pause and a negotiation, without a single additional barrel moving. If the talks stall or one tanker is hit, that repricing reverses overnight.
The Federal Reserve concludes on Wednesday, with a hold still the base case, so the language will matter more than the decision. This could be the trigger for the reversals.
I called the top in oil from a chart while every headline in the world (or at least most of them) argued the other way, and the reason arrived four days later. That is worth remembering the next time someone says that the fundamental factors are too strong for a market to fall. And it is worth remembering this morning, when the fundamentals finally turned in gold’s favor, and gold could barely lift itself off the floor.
If you’re not ready to subscribe yet, I encourage you to sign up for my free gold newsletter today.
Thank you.
Sincerely,
Przemyslaw K. Radomski, CFA