


Gold Technical Analysis
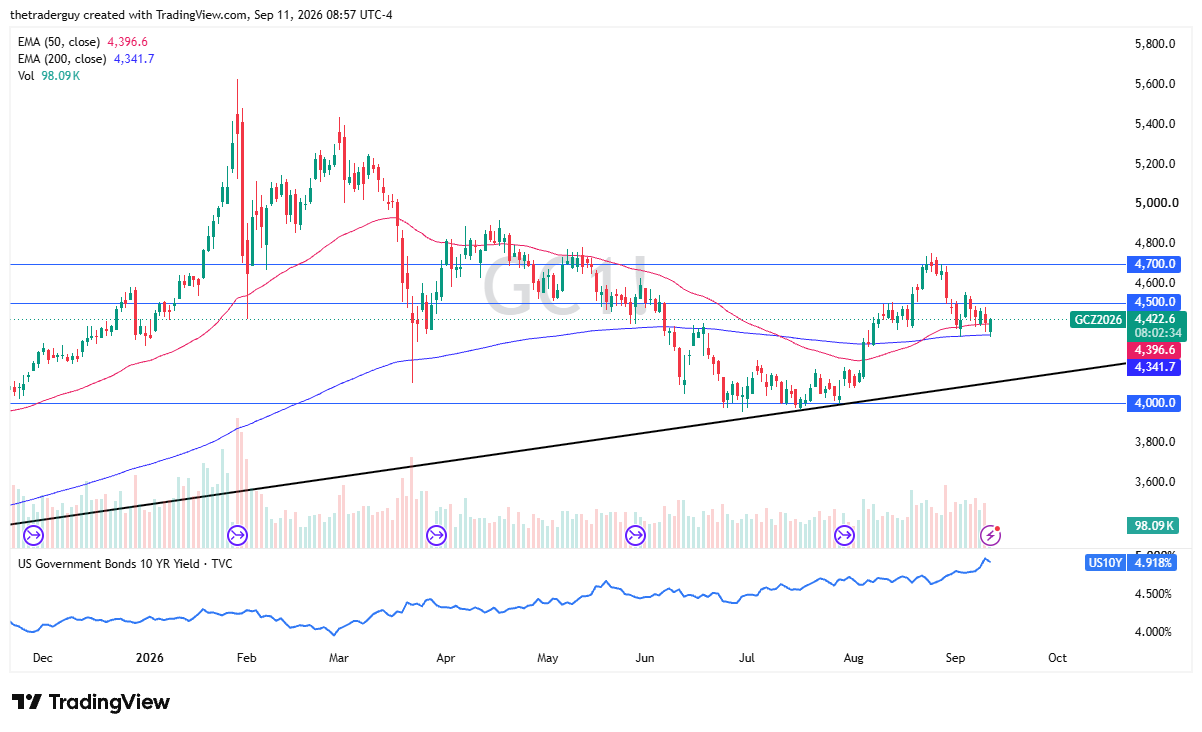
The gold market continues to see a lot of momentum in both directions, as the CPI was approaching, traders seemed to be on edge. At this point, it appears that the markets have accepted that the Federal Reserve will be hiking rates next week.
After the CPI number came out hotter than anticipated, but maybe not as bad as people had feared, the market is likely to continue to see a lot of choppy sideways action as we are now re-entering the massive consolidation area that has been a part of this market for the better part of a month, with the exception of a throwover.
Key Support and Resistance Prices
The 200-day EMA offering support makes sense from a technical analysis standpoint. So really, at this point in time, none of this is a big surprise for those who follow the chart patterns.
To the upside, we have the $4,500 level offering a bit of resistance and could be a bit of a target for those who are overly bullish. Above that, then we have the $4,700 level. That is an area that has been important in the past.
The 200-day EMA has already shown itself to be important during the session, so it will be worth watching as potential support. We will just have to wait and see. A breakdown below that would, of course, be negative, but at this point in time, it looks like metals markets, both gold and silver, are willing to just hang out where they have been.
If you’d like to know more about how to trade gold and silver, please visit our educational area.