Breakout Sends Gold Toward Major Resistance
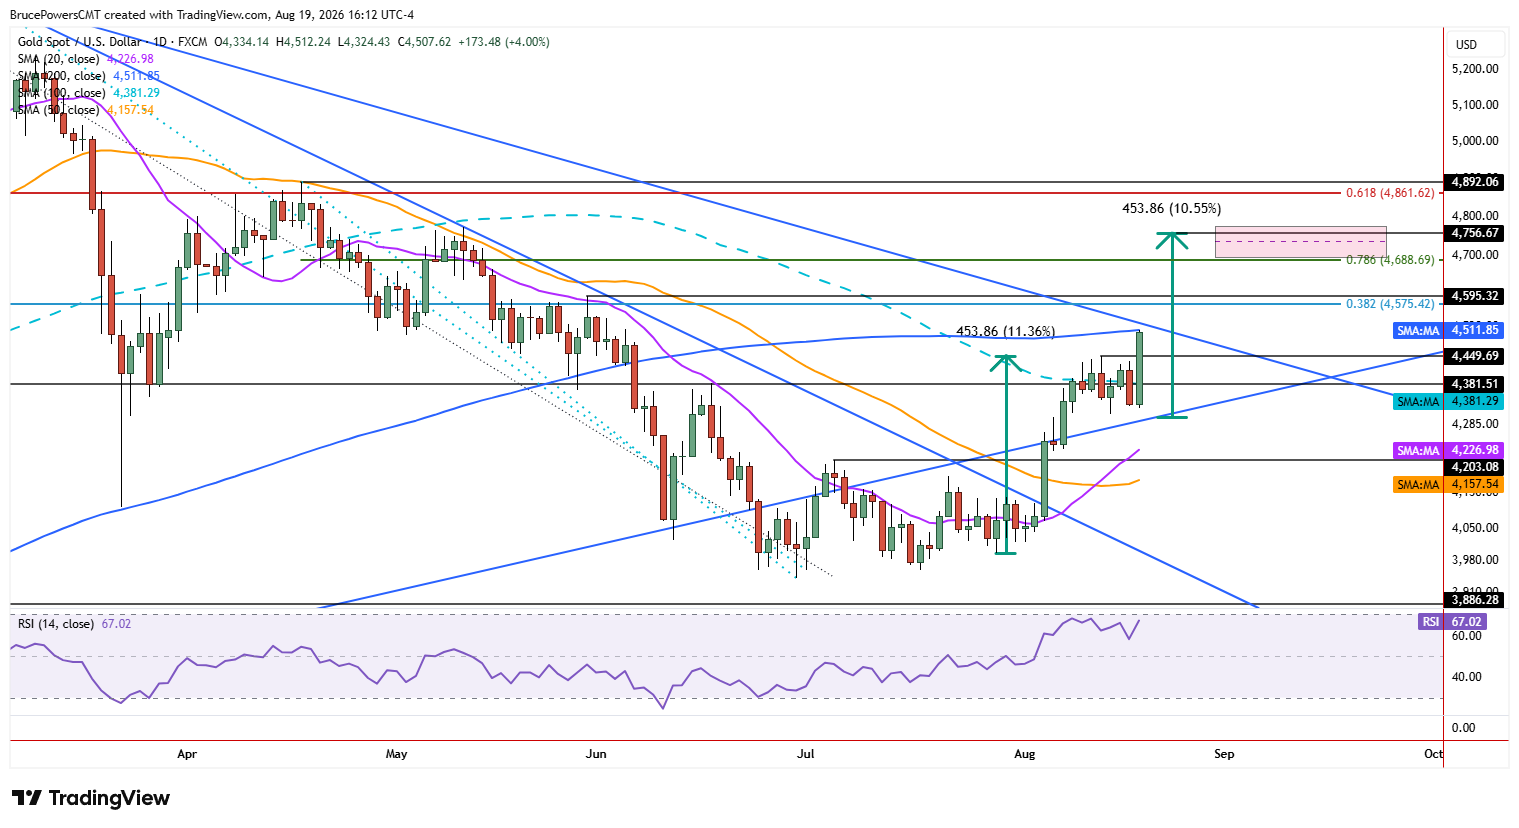
Gold broke out of a short-term range on Wednesday and spiked to a high of $4,499. At the time of writing, buyers remain in control and trading continues near the highs of the session. This puts gold in a relatively strong position near its first key target zone defined by the 200-day moving average at $4,512. The advance also confirmed a bullish reversal signal on a move above the lower swing high of $4,382 from mid-June. That is where resistance has been tested for seven days until Wednesday, when an extension of the advance was triggered.

Second Leg Builds on Earlier Breakout
Since this is the first notable test of resistance at the 200-day moving average since gold dropped below it in early June, there is a good chance resistance will be observed. However, Wednesday’s advance signaled the second leg up from recent lows after a break above the downtrend line occurred two weeks ago.
Weekly Breakout Strengthens Bullish Case
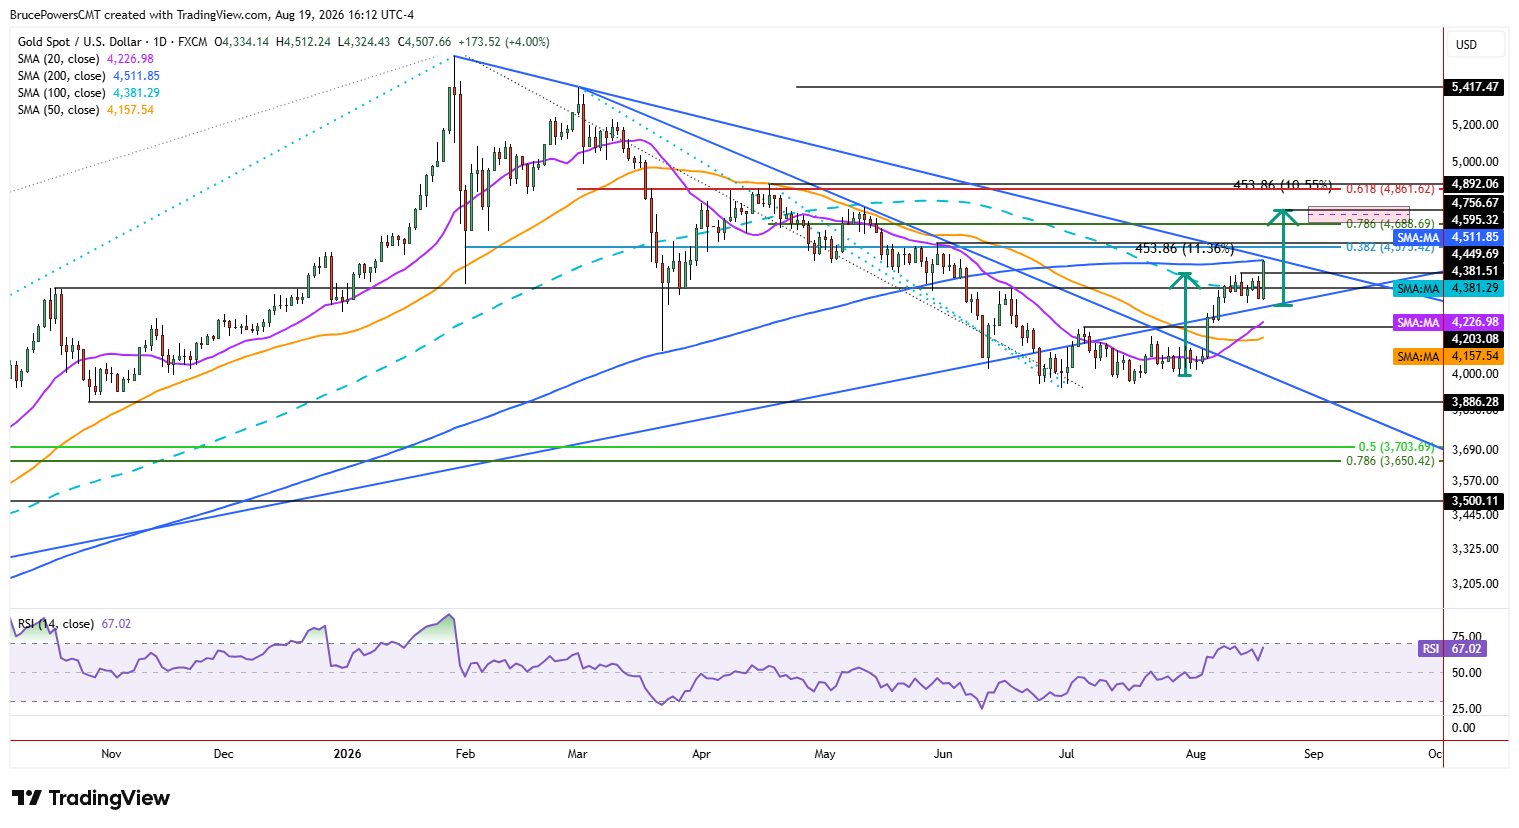
The weekly chart adds to the significance of Wednesday’s upside breakout above the prior high of $4,450. That was also a weekly high and therefore a continuation of the weekly trend, with a higher daily low of $4,324 established. The breakout will confirm on a weekly basis if this week ends above last week’s high of $4,450. That would add to the growing bullish evidence for gold, suggesting that the 200-day moving average could be reclaimed, along with the top downtrend line.
A simple measured move for the current advance projects to a potential upside target for gold near $4,791. That would put it above the 78.6% Fibonacci retracement of the recent decline at $4,689, which also marks a potential upside target. There was strong momentum seen during the first leg up from the bottom, and this second leg up is beginning with signs of powerful momentum. Regardless, the 200-day moving average presents the next key decision zone for gold.