Bitcoin Strength Reignites MSTR
Strategy Inc. (MSTR) stock is beginning to show signs of life again after a seven-week consolidation range formed near the low of the recent bearish correction. This is not surprising given the sharp advance and upside breakout that triggered in bitcoin on Wednesday. The company, formerly known as MicroStrategy, holds bitcoin as its primary treasury asset and therefore its stock is seen as a proxy for the cryptocurrency. As bitcoin strengthens, MSTR is beginning to show signs that its own bearish correction may be losing momentum.

Breakout Gains Confirmation
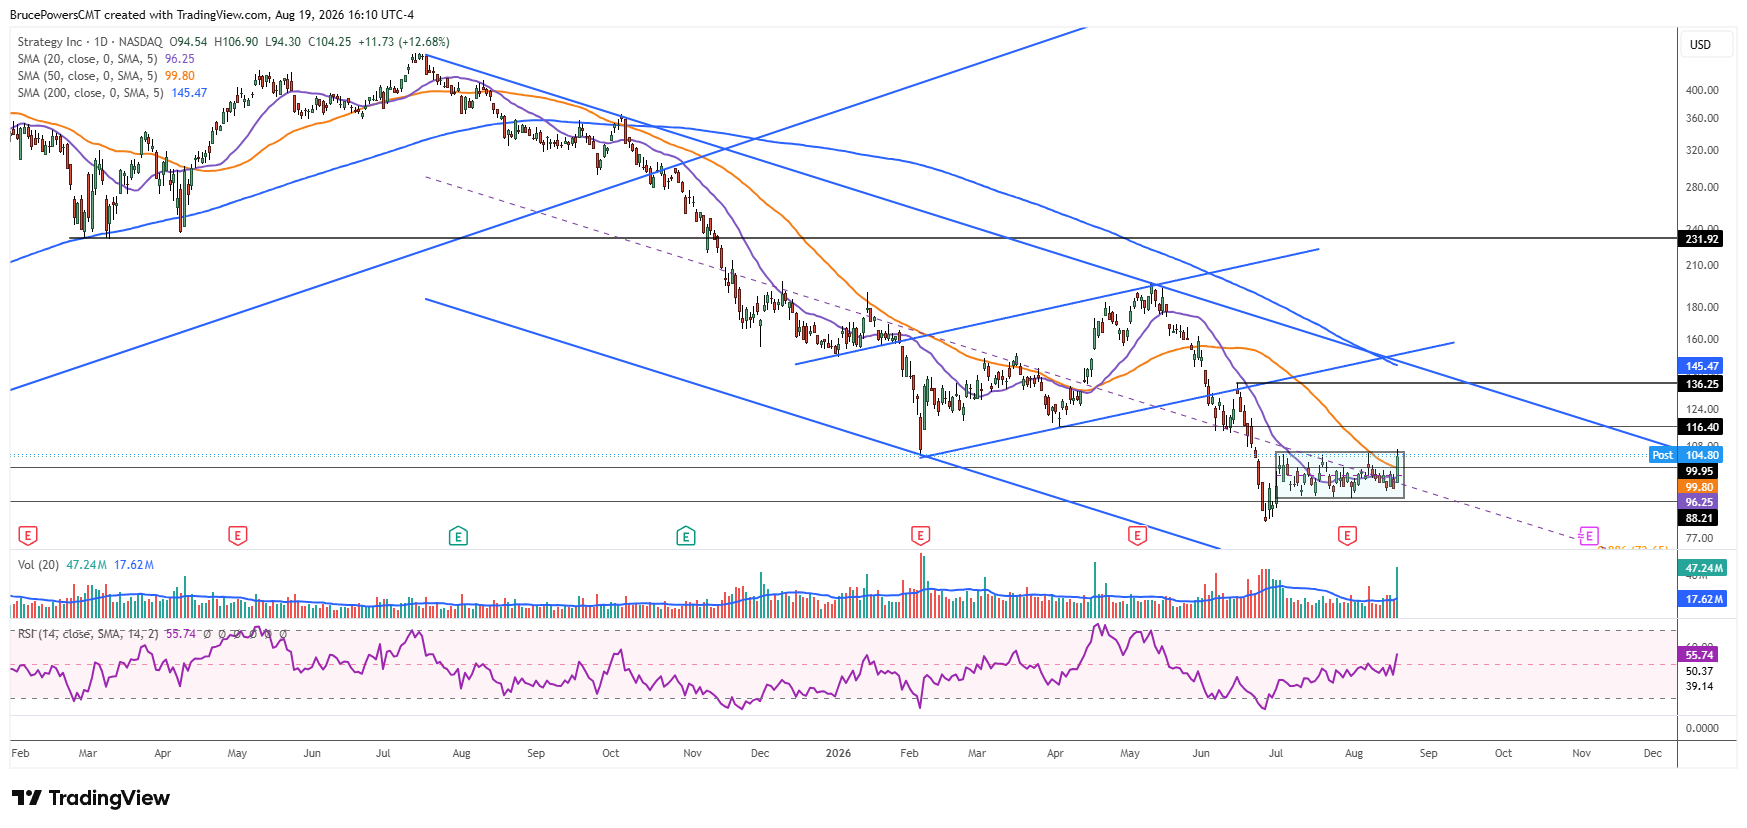
On Wednesday, MSTR rallied with enthusiasm and reclaimed the 50-day moving average for the first time since late May, reaching a high of $106.90 for the day. A bullish breakout of the consolidation also triggered on a move above the top of the seven-week consolidation pattern at $105.50. Participation broadened as volume spiked to a 39-day high. The combination of a moving-average recovery, a range breakout, and stronger participation provides early evidence that buyers are regaining control.
$105.50 Becomes Critical Support
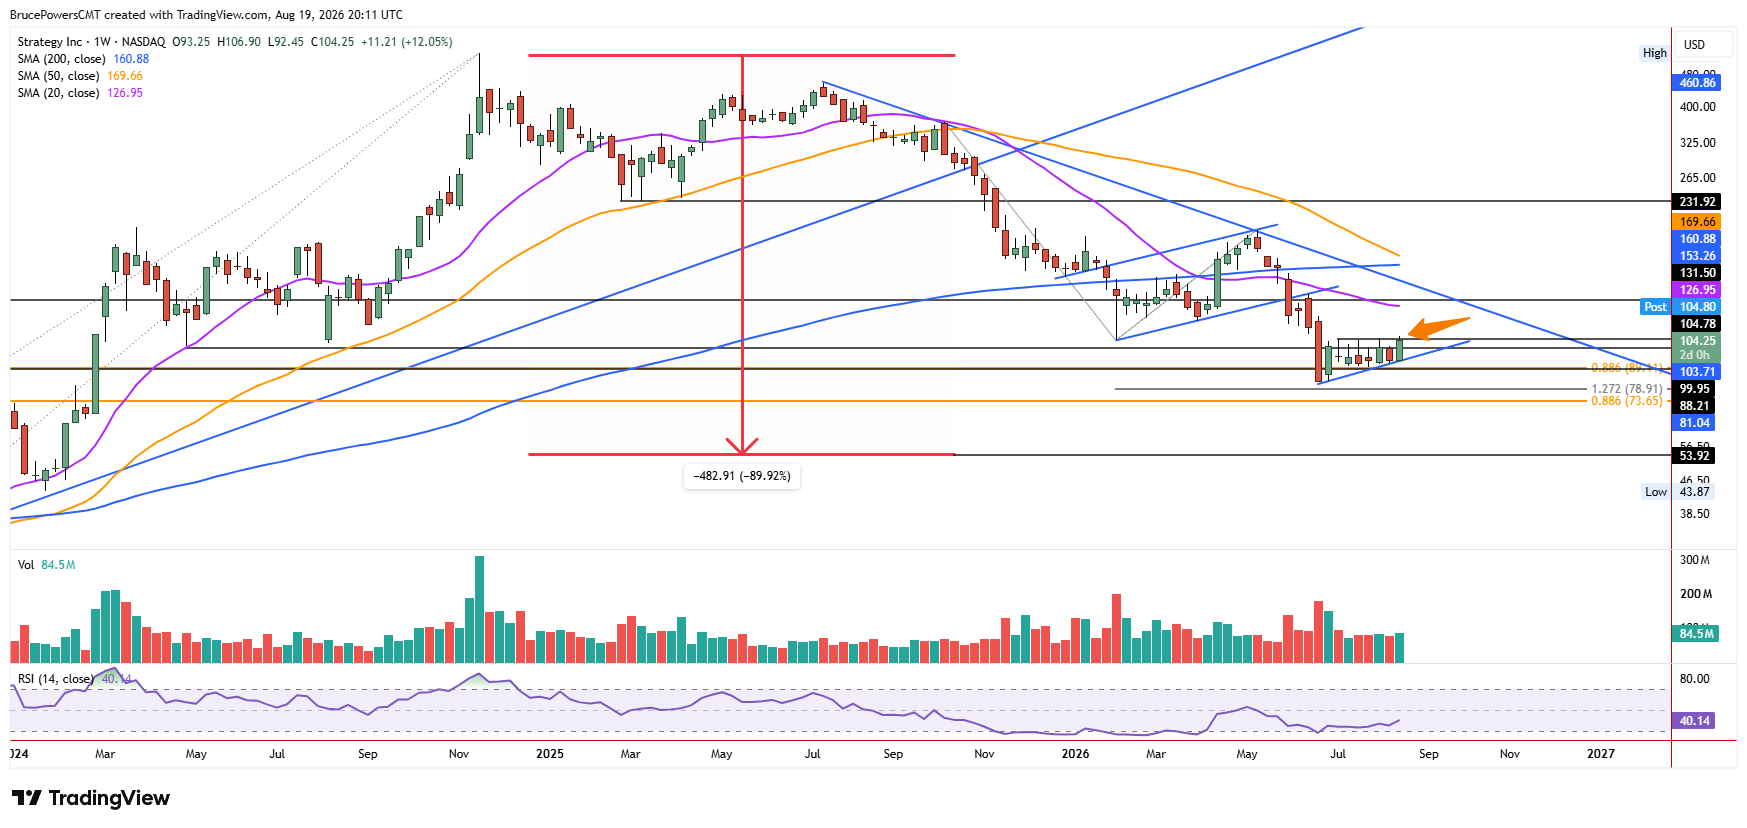
Although a daily close above the $105.50 resistance level would strengthen the bullish case, bullish price behavior following the breakout could result in a more successful and sustained upside breakout. A sustained recovery above the 50-day moving average is now a key indicator. If support is found at or above that average, now near $99.79, and it is followed by signs of strength, the bullish reversal would show greater conviction and could be further confirmed by a close above $105.50 at the top of the range. Conversely, a failure to hold the 50-day moving average would weaken the developing reversal and keep MSTR vulnerable to further range-bound trading.
Major Resistance Sets Next Test
If buyers can retain control and MSTR confirms an upside breakout of the consolidation, the first major upside target looks to be around the falling 200-day moving average at $145.47. It recently aligned with the downtrend line, adding to the potential significance of this dynamic resistance zone. Key structure resistance is at the lower swing high of $136.25. However, the first area of potential resistance is near a prior support zone around $116.40. Since the 200-day moving average is falling, it may be tested before there is a chance to hit the $136.25 area. For now, the $105.50 breakout level and 50-day moving average near $99.79 are the key levels to watch, as holding them would give the emerging recovery a stronger foundation to move toward higher resistance.