
The Nasdaq 100 gained positive traction on Friday and closed at 30,827. It also gained over 0.50% over the week as weaker jobs data reduced expectations for another Federal Reserve rate hike. But tariff uncertainty and high Treasury yields still challenge technology stocks. In my view, Nasdaq can extend the recovery if bond yields ease and spending on artificial intelligence remains strong. This article presents the latest developments for Trump tariffs, jobs data and economic drivers that could shape the next move in Nasdaq.

Trump Tariff Plans Raise Risks for AI Investment
The tariff plans by Trump returned to the spotlight on October 2. The five technology trade associations urged the president to reconsider proposed tariffs of Section 232 on semiconductors, robotics and industrial machinery. They warned that wider duties would increase the cost of building chip factories, AI data centers and advanced facilities for manufacturing.
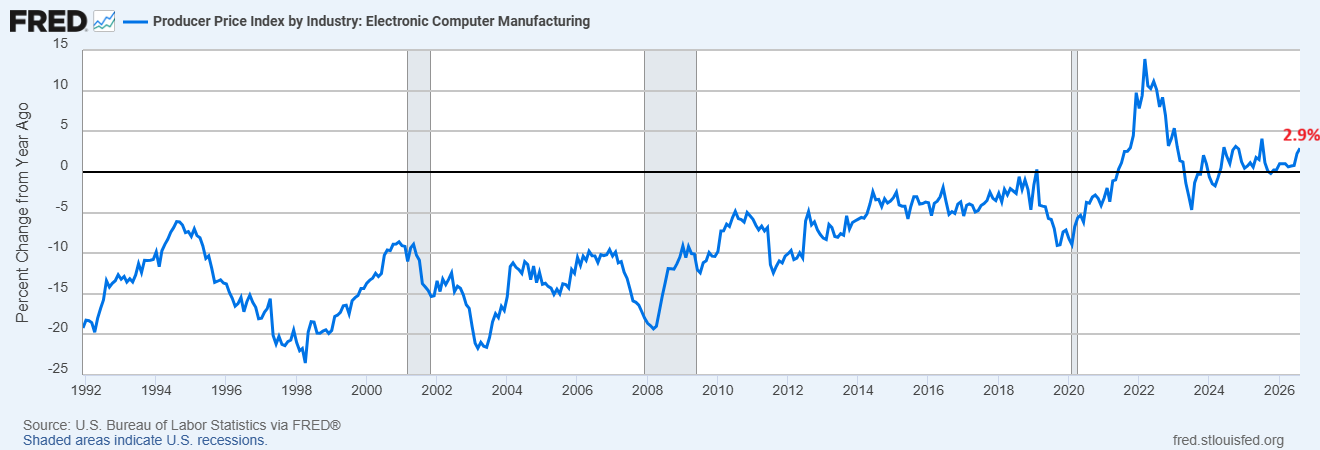
For Nasdaq, the concern reaches beyond chipmakers. The cloud providers and equipment suppliers could also face pressure as projects become more expensive. The chart below shows that the producer prices for computer manufacturing are starting to pick up again in 2026.
CCIA estimated that applying a semiconductor tariff of 25% to data centers would impose burden equivalent to 15.6% of the costs for construction. It also projected a broader US economic cost of about $90 billion a year. The high project costs could push cloud companies to review expansion budgets. That could weaken some of the AI demand supporting technology earnings.
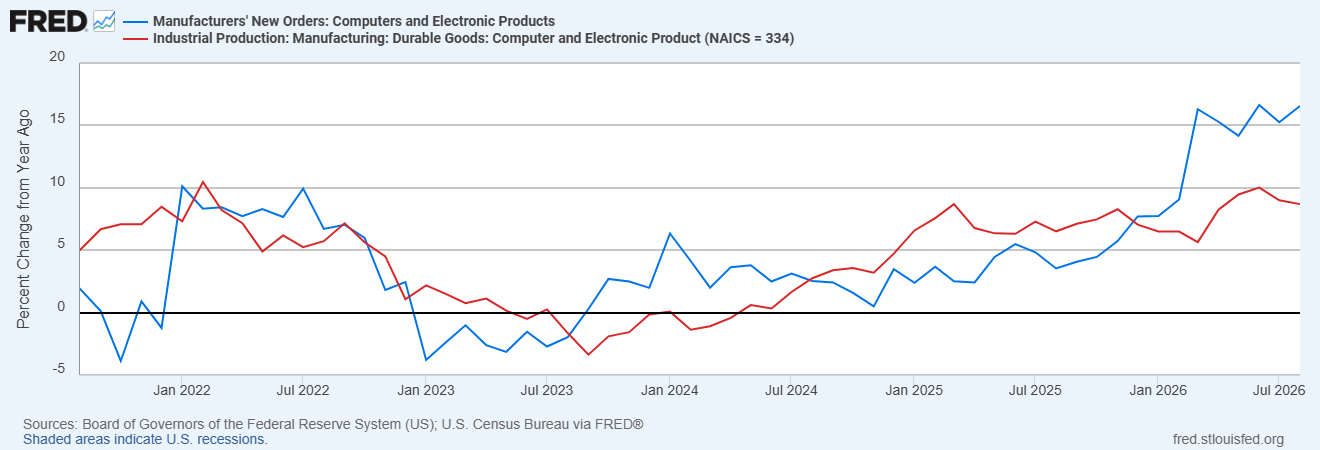
The latest trade comments by the administration suggest that the tariff remains central to the policy. At the G20 trade meeting on September 30, US Trade Representative Jamieson Greer defended the use of tariffs and bilateral agreements. He also called for action on excess industrial capacity and questioned trade preferences that are unconditional.
His remarks offered little sign of broad retreat from trade barriers. This keeps future sourcing costs and access to overseas markets uncertain for technology firms.
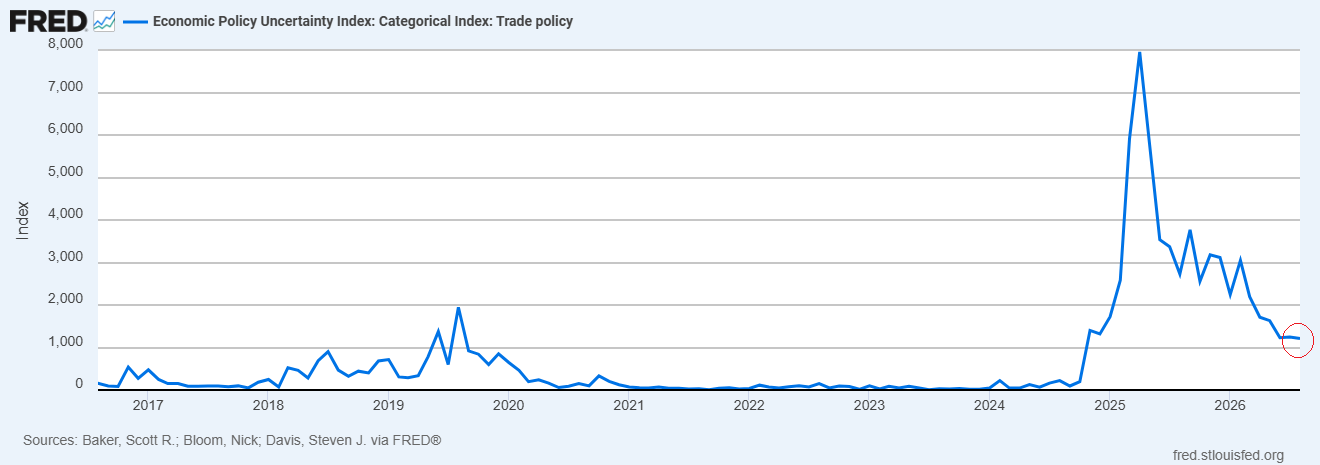
The G20 outcome left key disagreements unresolved. In a statement released on October 2, Greer said that members failed to reach consensus on forced labor in supply chains. Mexico and Argentina joined the US statement, while some members rejected proposed path toward cooperation on excess capacity. These discussions did not announce broad technology tariff relief.
NASDAQ 100 Price Forecast
Every new NASDAQ 100 analysis as it publishes, today's technical signal and key levels, live price — on one page.
See all NASDAQ 100 forecastsNasdaq 100 Fundamentals: Weak Jobs Ease Fed Hike Bets
US Jobs Report Signals Slower Hiring
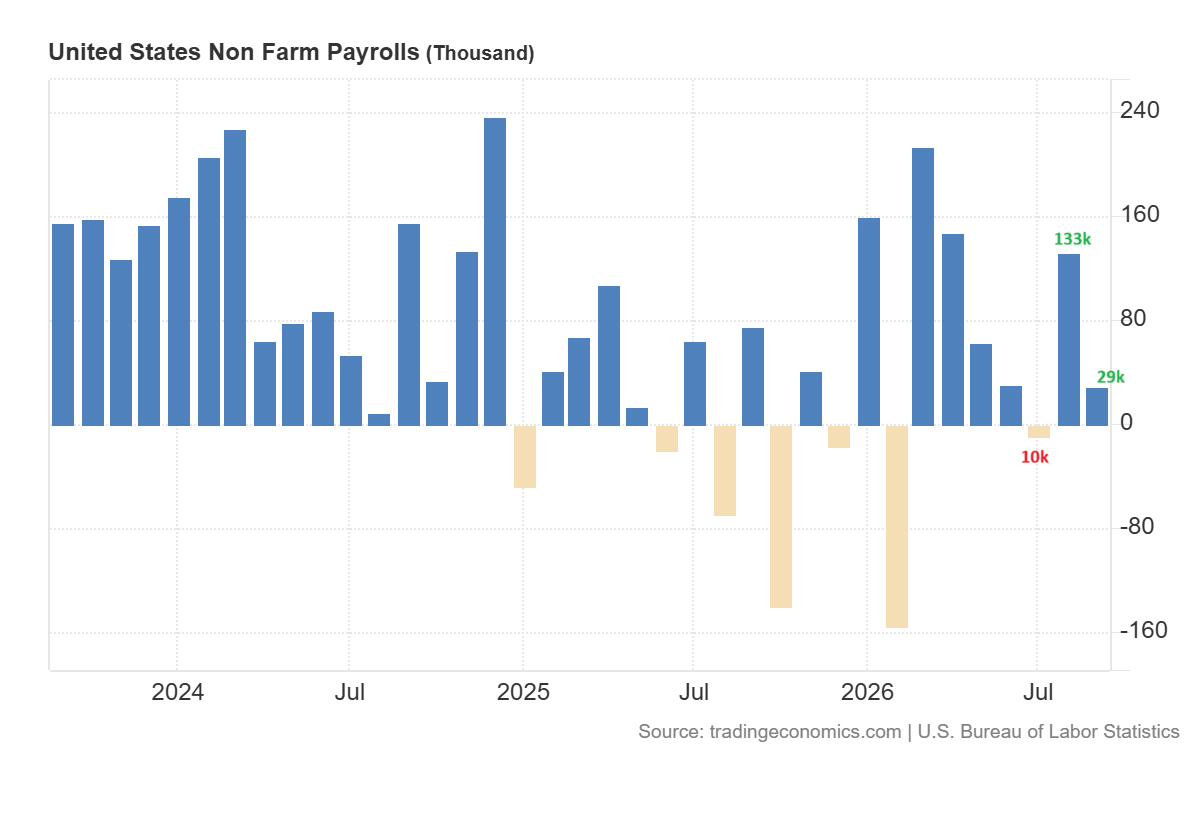
The jobs report for September provides immediate support to the Nasdaq. The chart below shows that the nonfarm payrolls increased by 29,000, which is well below the 90,000 forecast. The Labor Department also reduced the employment gains for July and August by a combined 60,000.
The data now shows a loss of 10,000 jobs in July and a gain of 133,000 in August. The three-month average stands near 51,000. This points to uneven hiring and reduces the case for raising the interest rates to restrain an overheating labor market.
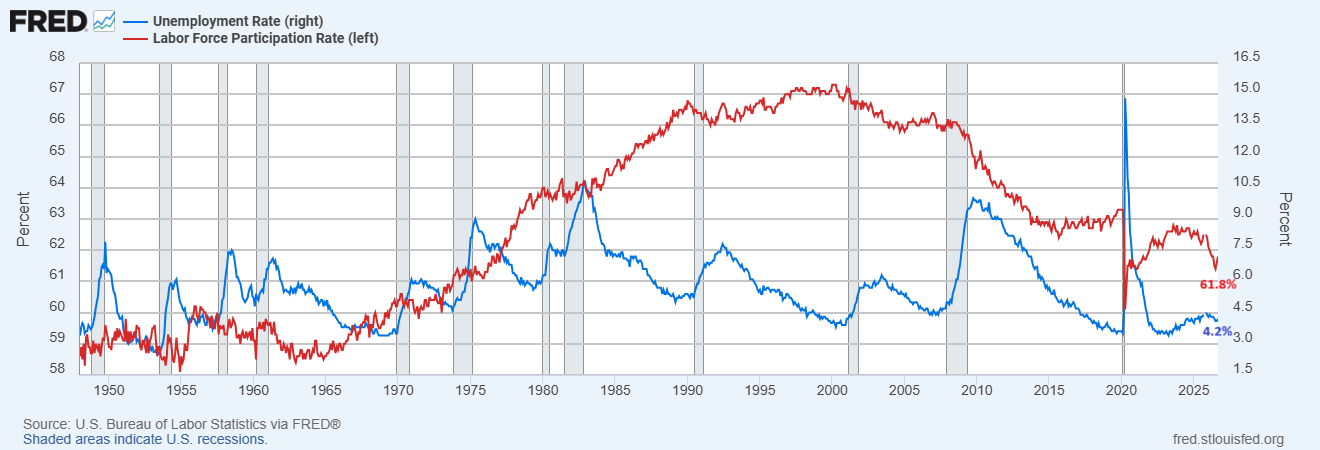
The unemployment rate increased to 4.2% from 4.1%. But the labor force participation also increased to 61.8% from 61.6% as more people entered the workforce. That helps explain the increase in unemployment.
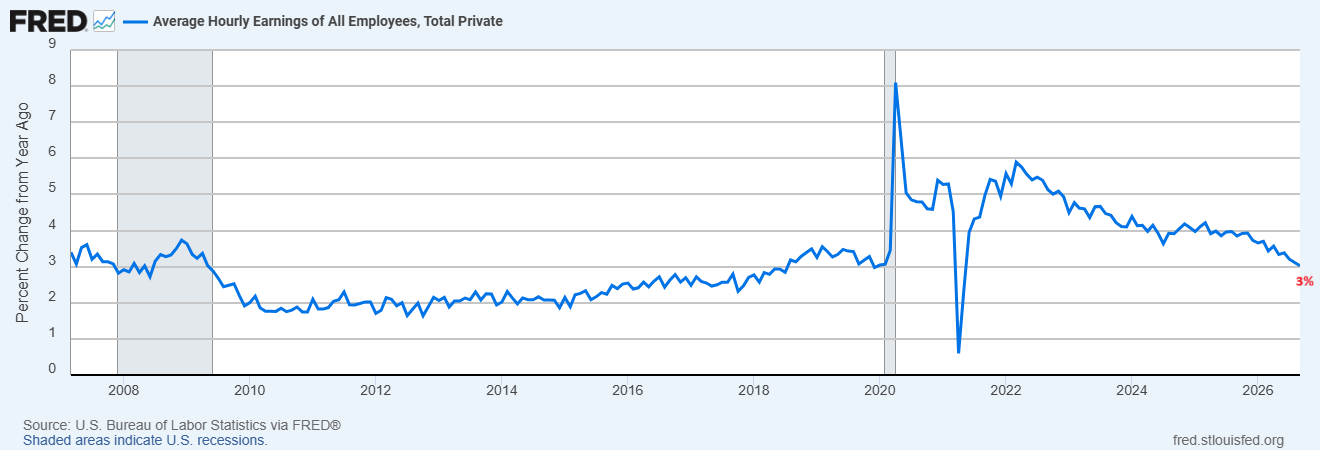
Average hourly earnings increased just 0.1% during September and 3.0% over the year. The slow wage growth could ease inflation pressure. But weaker hiring could also limit future spending by the household. The jobs data support a cooling labor market while leaving the outlook for demand uncertain.
Fed Rate Outlook: PCE Inflation and Consumer Spending
The market responded by reducing the probability of rate hike in October to 22.1% from 64.2%. This supports the expectation for a pause. Fed Vice Chair Philip Jefferson also said that policymakers may need more time to judge the economy.
The policy rate remains at 3.75%-4.00%. The less pressure for another hike can support valuations for companies. But investors still need evidence that inflation will move toward the target set by the Fed.
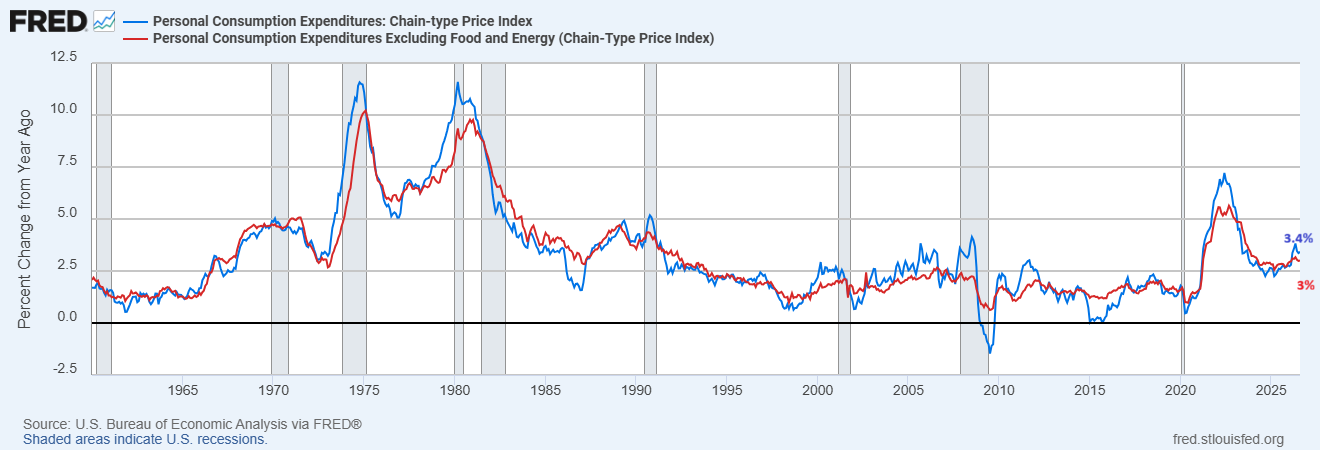
The PCE release on 30 September gave a mixed inflation signal for the economy. The headline prices rose 0.3% in August and 3.4% over the year. The core prices increased 0.2% monthly and 3.0% annually. Both monthly increases exceeded the revised readings for July. This data suggests that the inflation remains above the target set by the Fed.
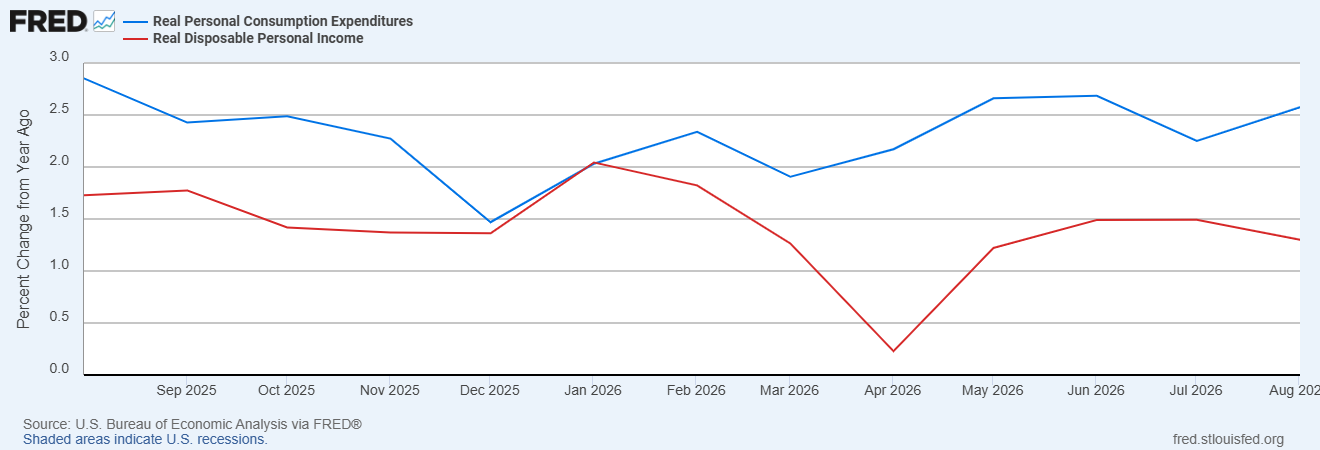
The chart below shows that the real consumer spending is growing faster than the real disposable income. This is important because if the growth in income remains weak, then households may slow their spending, which could weigh on revenues for the company.
High Treasury Yields Pressure Nasdaq Valuations
The jobs report also failed to sustain a rally in Treasury. Yields dropped initially then rebounded later on Friday. The 10-year yield traded around 5.28% while the 2-year yield was near 4.83% during the close of the week.
This matters because lower Fed hike odds do not guarantee lower borrowing costs in the long term. High yields reduce the present value of future profits and raise the cost of funding. Nasdaq needs more lasting decline in yields to strengthen support for technology valuations.
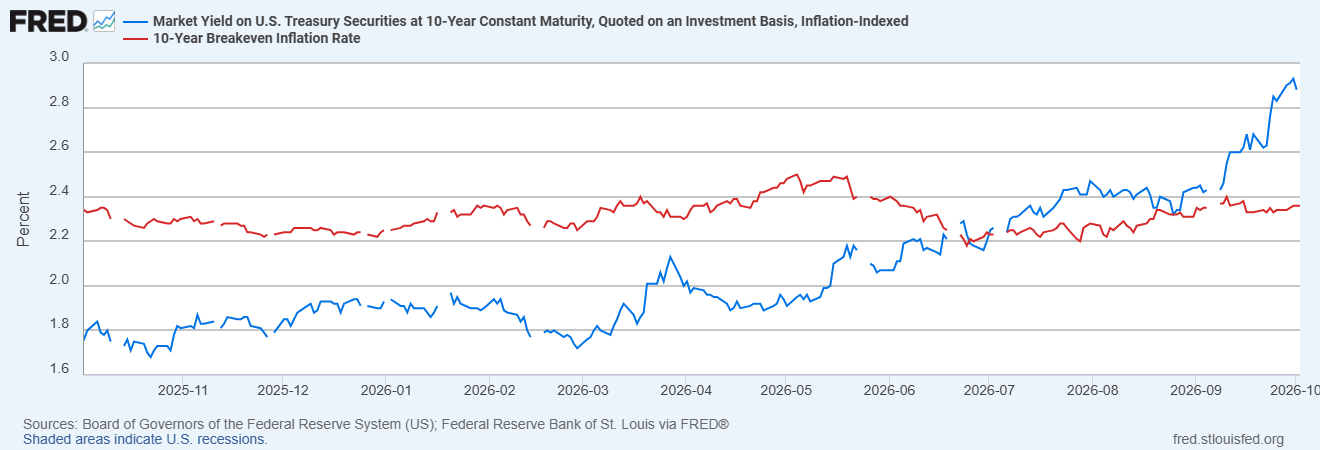
In my view, the near-term outlook remains positive if the investment in AI and earnings stay strong. A sustained drop in yields would strengthen that view. The broader tariffs or further weakness in hiring could instead shift attention toward higher costs and slower growth in revenue.
Nasdaq 100 Technical Analysis: 30,600 Breakout Puts 35,000 in View
Long-Term Bullish Patterns Support Nasdaq 100
The Nasdaq 100 has been forming a strong bullish structure since the bottom formed in October 2022. The chart below shows that the index has formed a cup and handle formation from November 2021 to November 2023. A breakout from this formation has triggered a strong surge in the index, marking a record high. The bottom formations in April 2025 and March 2026 further support the bullish structure.
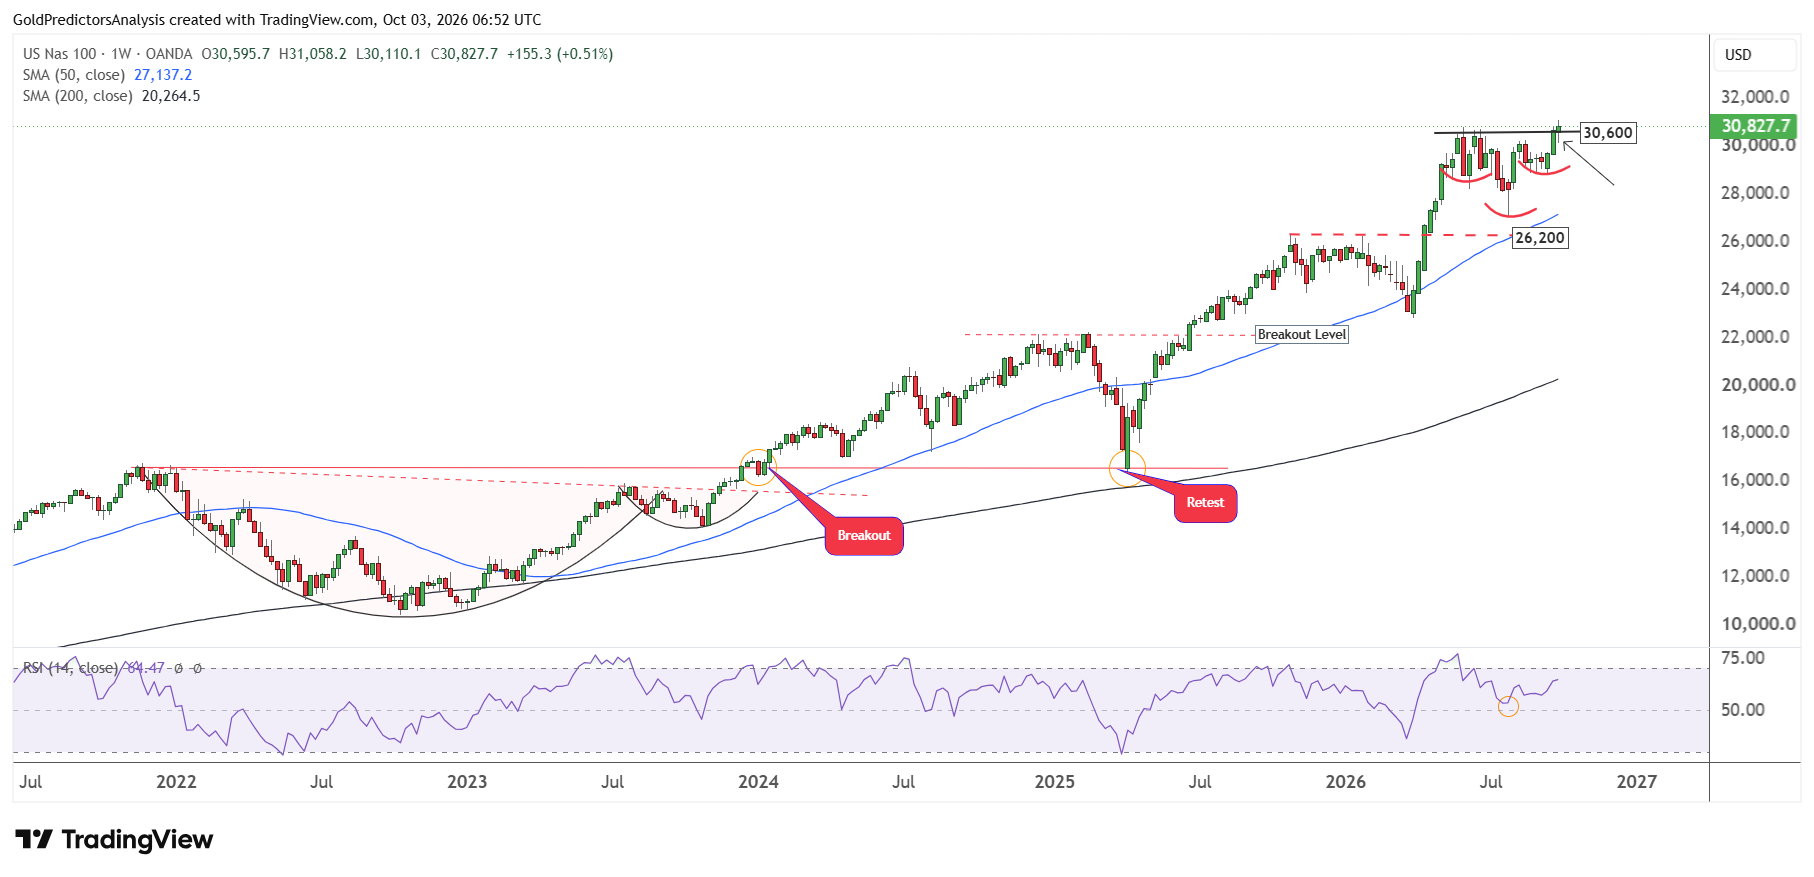
Now, the index has formed an inverted head and shoulders pattern from May 2026 to September 2026. This inverted head and shoulders was broken last week at the neckline level of 30,600, which suggests another strong surge in the index towards the 35,000 area.
This bullish structure is further supported by the RSI, which has formed a bottom around the mid-level and is now rising. Moreover, the index remains above the 50- and 200-week SMAs, which suggests a strong bullish trend.
Nasdaq 100 Breakout and Key Support Levels
This strong bullish formation is further supported by the inverted head and shoulders formed from December 2024 to June 2025, as observed on the daily chart below.
After forming these patterns, the index has formed an ascending broadening wedge pattern from June 2025 towards the recent highs. The formation of a V-shaped recovery in March 2026 and then the descending broadening wedge from June 2026 further supports a bullish structure.
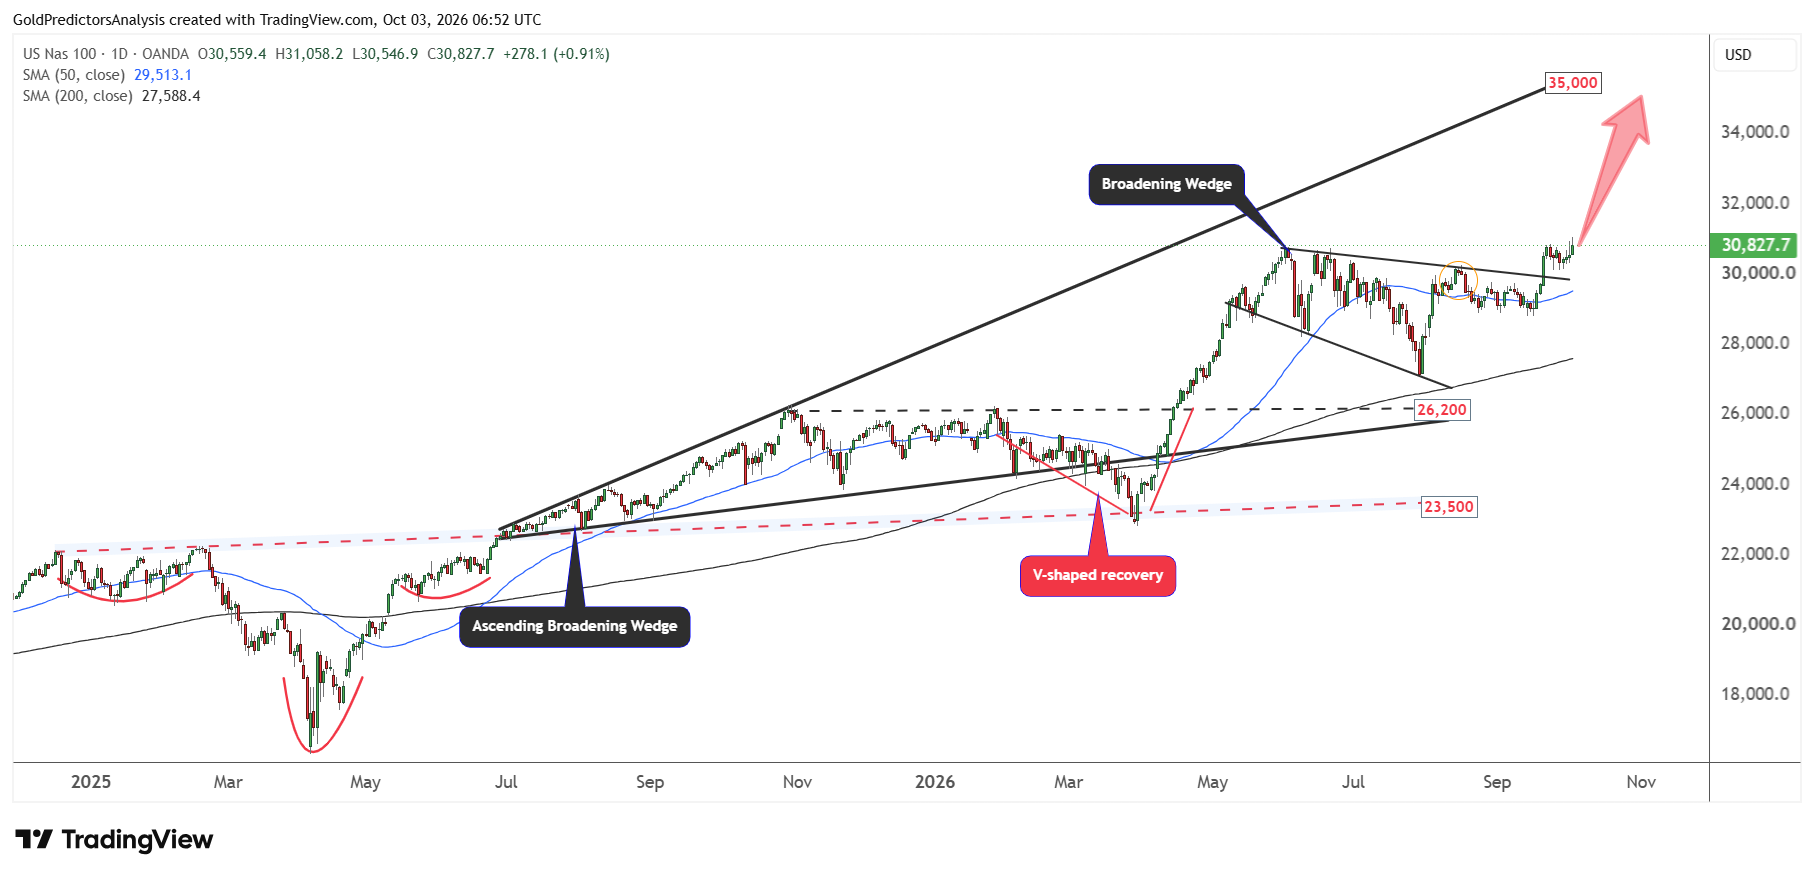
The breakout from the broadening wedge in September 2026 suggests that the index is ready to surge towards the target area of 35,000. This target is defined by the ascending broadening wedge pattern that stretches from July 2025.
The immediate support now stands at 30,150. A break below 30,150 will offer further downside towards 29,700. A break below 29,700 may trigger a deeper correction towards the 200-day SMA around 27,600. However, the bullish structure remains in place, and this correction will further strengthen the case for the upside target.
What to Watch Next for Nasdaq 100
Nasdaq 100 gains support from weaker jobs data, which reduces pressure for another rate hike by the Fed. But slower hiring could also weaken the demand for consumers and revenues for the company. High Treasury yields continue to challenge technology valuations, while wider tariffs could raise costs and slow the investment in AI. Therefore, further gains depend on strong earnings, continued AI spending and a sustained decline in yields.
The technical structure for Nasdaq 100 supports a positive outlook. The breakout above 30,600 puts the 35,000 target in view, while 30,150 remains the immediate support. A break below this level could open a move towards 29,700. Further weakness below 29,700 could bring the 200-day SMA near 27,600 into focus. The index needs to defend these supports and sustain the recent breakout to strengthen the case for further gains to 35,000.