Gold News: Jobs Data and Iran Risk Compete With Hawkish Fed
Gold and silver fundamentals will be tested on the 1st of September against a more hawkish Fed and an escalation of geopolitical tension in the Middle East. After Jackson Hole, many speculate that Fed Chair Kevin Warsh will likely signal a need for more rate hikes to get inflation back on track. This has traders expecting a September rate hike with a 66% chance and a 90% chance of another rate hike by December. This commodity-shifting landscape is making non-yielding precious metals a tougher hold due to increased opportunity costs.
Focus has now shifted to the U.S. labor market. Investors will watch all the employment reports with a critical eye leading up to Friday’s jobs report. Reuters is saying that a rebound in hiring is expected after the last reported contraction, but the new data could actually slow down the expected tightening if inflation stays high.
Geopolitical demand is also important. President Trump will keep threatening a new military effort against Iran, all while the Strait of Hormuz has almost no commodity or liquid cargo transport. All of this has steady inflation and safe haven demand.
Structural demand is still very high. August data from the World Gold Council shows demand for gold-backed ETFs stayed elevated, and bullion from central banks is still very likely to keep interest in the coming years.
Silver continues to benefit from a physical-market tailwind. For another consecutive year, the Silver Institute has predicted an annual deficit for 2026. Given the expected high level of physical investment, this is positive news. With solar industry thrift, reduced industrial demand is offset by AI infrastructure, automotive electronics, and power grid investments.

Gold Technical Analysis: XAU/USD Holds $4,396 Support as Oversold Bounce Tries to Develop

On the 4-hour chart, gold is currently trading around $4,439, down from the $4,630 – $4,700 zone. As expected, gold has broken the 23.6% Fib level at $4,452, and is still below the 50-EMA at $4,554 and the 100-EMA at $4,539, therefore confirming a bearish short-term structure. Thankfully, the latest gold candles are closing above the $4,396 support area and are aligning with a region of previous fair-value gap zone and an upward trend line.
The RSI at 32 shows that there is an oversold condition and an increasing probability for a corrective rally. Immediate resistance is at $4,452 and beyond that is $4,487, $4,515, $4,543 and $4,570. Support remains at $4,396 with even stronger support at $4,341.
Being below $4,452 – $4,487 keeps the outlook for gold bullish, but the oversold RSI makes $4,396 even more important. A break below $4,396 would open $4,341.
Gold Price Forecast
Every new Gold analysis as it publishes, today's technical signal and key levels, live price — on one page.
See all Gold forecastsSilver Technical Analysis: XAG/USD Consolidates Above $65.64 as Buyers Defend Rising Support
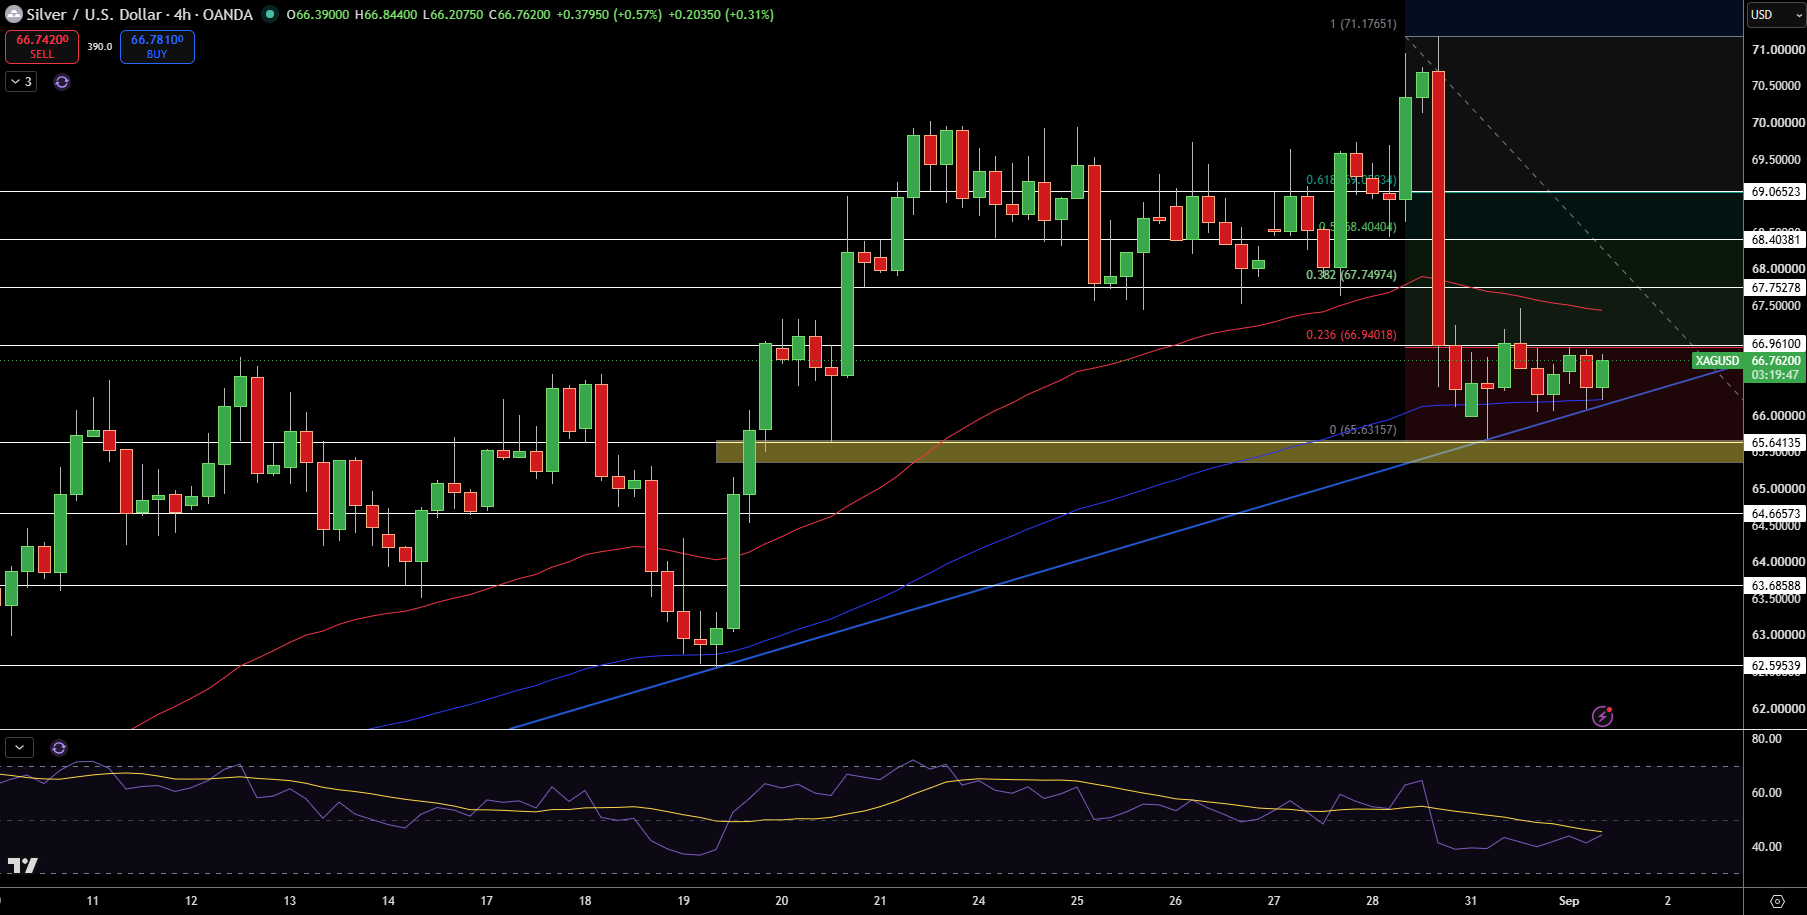
Silver currently trades at $66.76 on the 4-hour chart having recovered from the sharp fall from $71.18. Price is still below the $66.94 level of the 23.6% Fibonacci Retracement and the 50 EMA at $67.5. Price is nonetheless being supported by the 100 EMA and the rising trend line.
The main support zone is at $65.64 where the trend line and an old demand zone meet. The immediate resistance is at $66.94, with $67.75, $68.40, and $69.07 above. Below $65.64, support breaks and we can expect $64.67, $63.69, and $62.60.
RSI is showing weak momentum at the low 40s and is consolidating slightly. I believe that silver is currently in the consolidation phase after the breakdown. $65.64 needs to be held for the rebound to be possible; otherwise a $66.94-$67.75 break would be required to be bullish on silver again.