



Gold & Silver Outlook: Middle East Escalation Revives Safe-Haven Demand as Fed Inflation Test Looms
Fundamentals for gold and silver are developing belligerently in light of the worsening geopolitics of the U.S. and the growing threat of intensifying U.S. monetary policy as traders wait for the inflation report due this week. Wednesday saw increased intensity of the Middle East conflict when Iranian backed Houthi groups attacked Saudi targets, U.S. forces conducted strikes on Iranian oil tankers and Iran retaliated by striking a U.S run air base in Jordan. This has made investors shift to safe havens and has raised new worries about disruptions to the flow of crude oil to locations that need it.
While gold is considering the conflict, rising oil prices are causing concerns about inflation. With the Fed scheduled to meet on September 15 and 16, the oil price shock is creating the opposite of the gold bull case. Inflation fears are high. The Fed is looking at the August jobs reports to set new policy. The data is pushing the market to expect a 60% chance of a rate hike. Rising inflation expectations along with the impact of increasing interest rates and Treasury yields on the value of gold is increased investment in gold.
The big macro tests are still to come. A series of new data will be released this week, and Fed officials believe the CPI data will be key to the September setting of policy. Governor Christopher Waller believes he would support a decision to hold policy steady if inflation continues to move closer to the Fed’s target, while Cleveland Fed President Beth Hammack maintains her position of supporting further tightening.
Precious metal prices are benefitting from a strong yen amid expectations that the Bank of Japan will begin to tighten to offset a weakening U.S. dollar.
For silver, the tightening of the physical market reinforces monetary policy sensitivity. The Silver Institute anticipates silver will continue to have a sixth straight year of market deficits in 2026, as global inventories start to fall since 2021, despite a slowing industrial demand.
Fundamental bias: Gold and Silver are both moderately bullish. The key risk in the near term is Friday’s U.S. CPI report.
Gold Technical Analysis: XAU/USD Holds $4,347 as $4,422 Resistance Keeps Recovery Capped
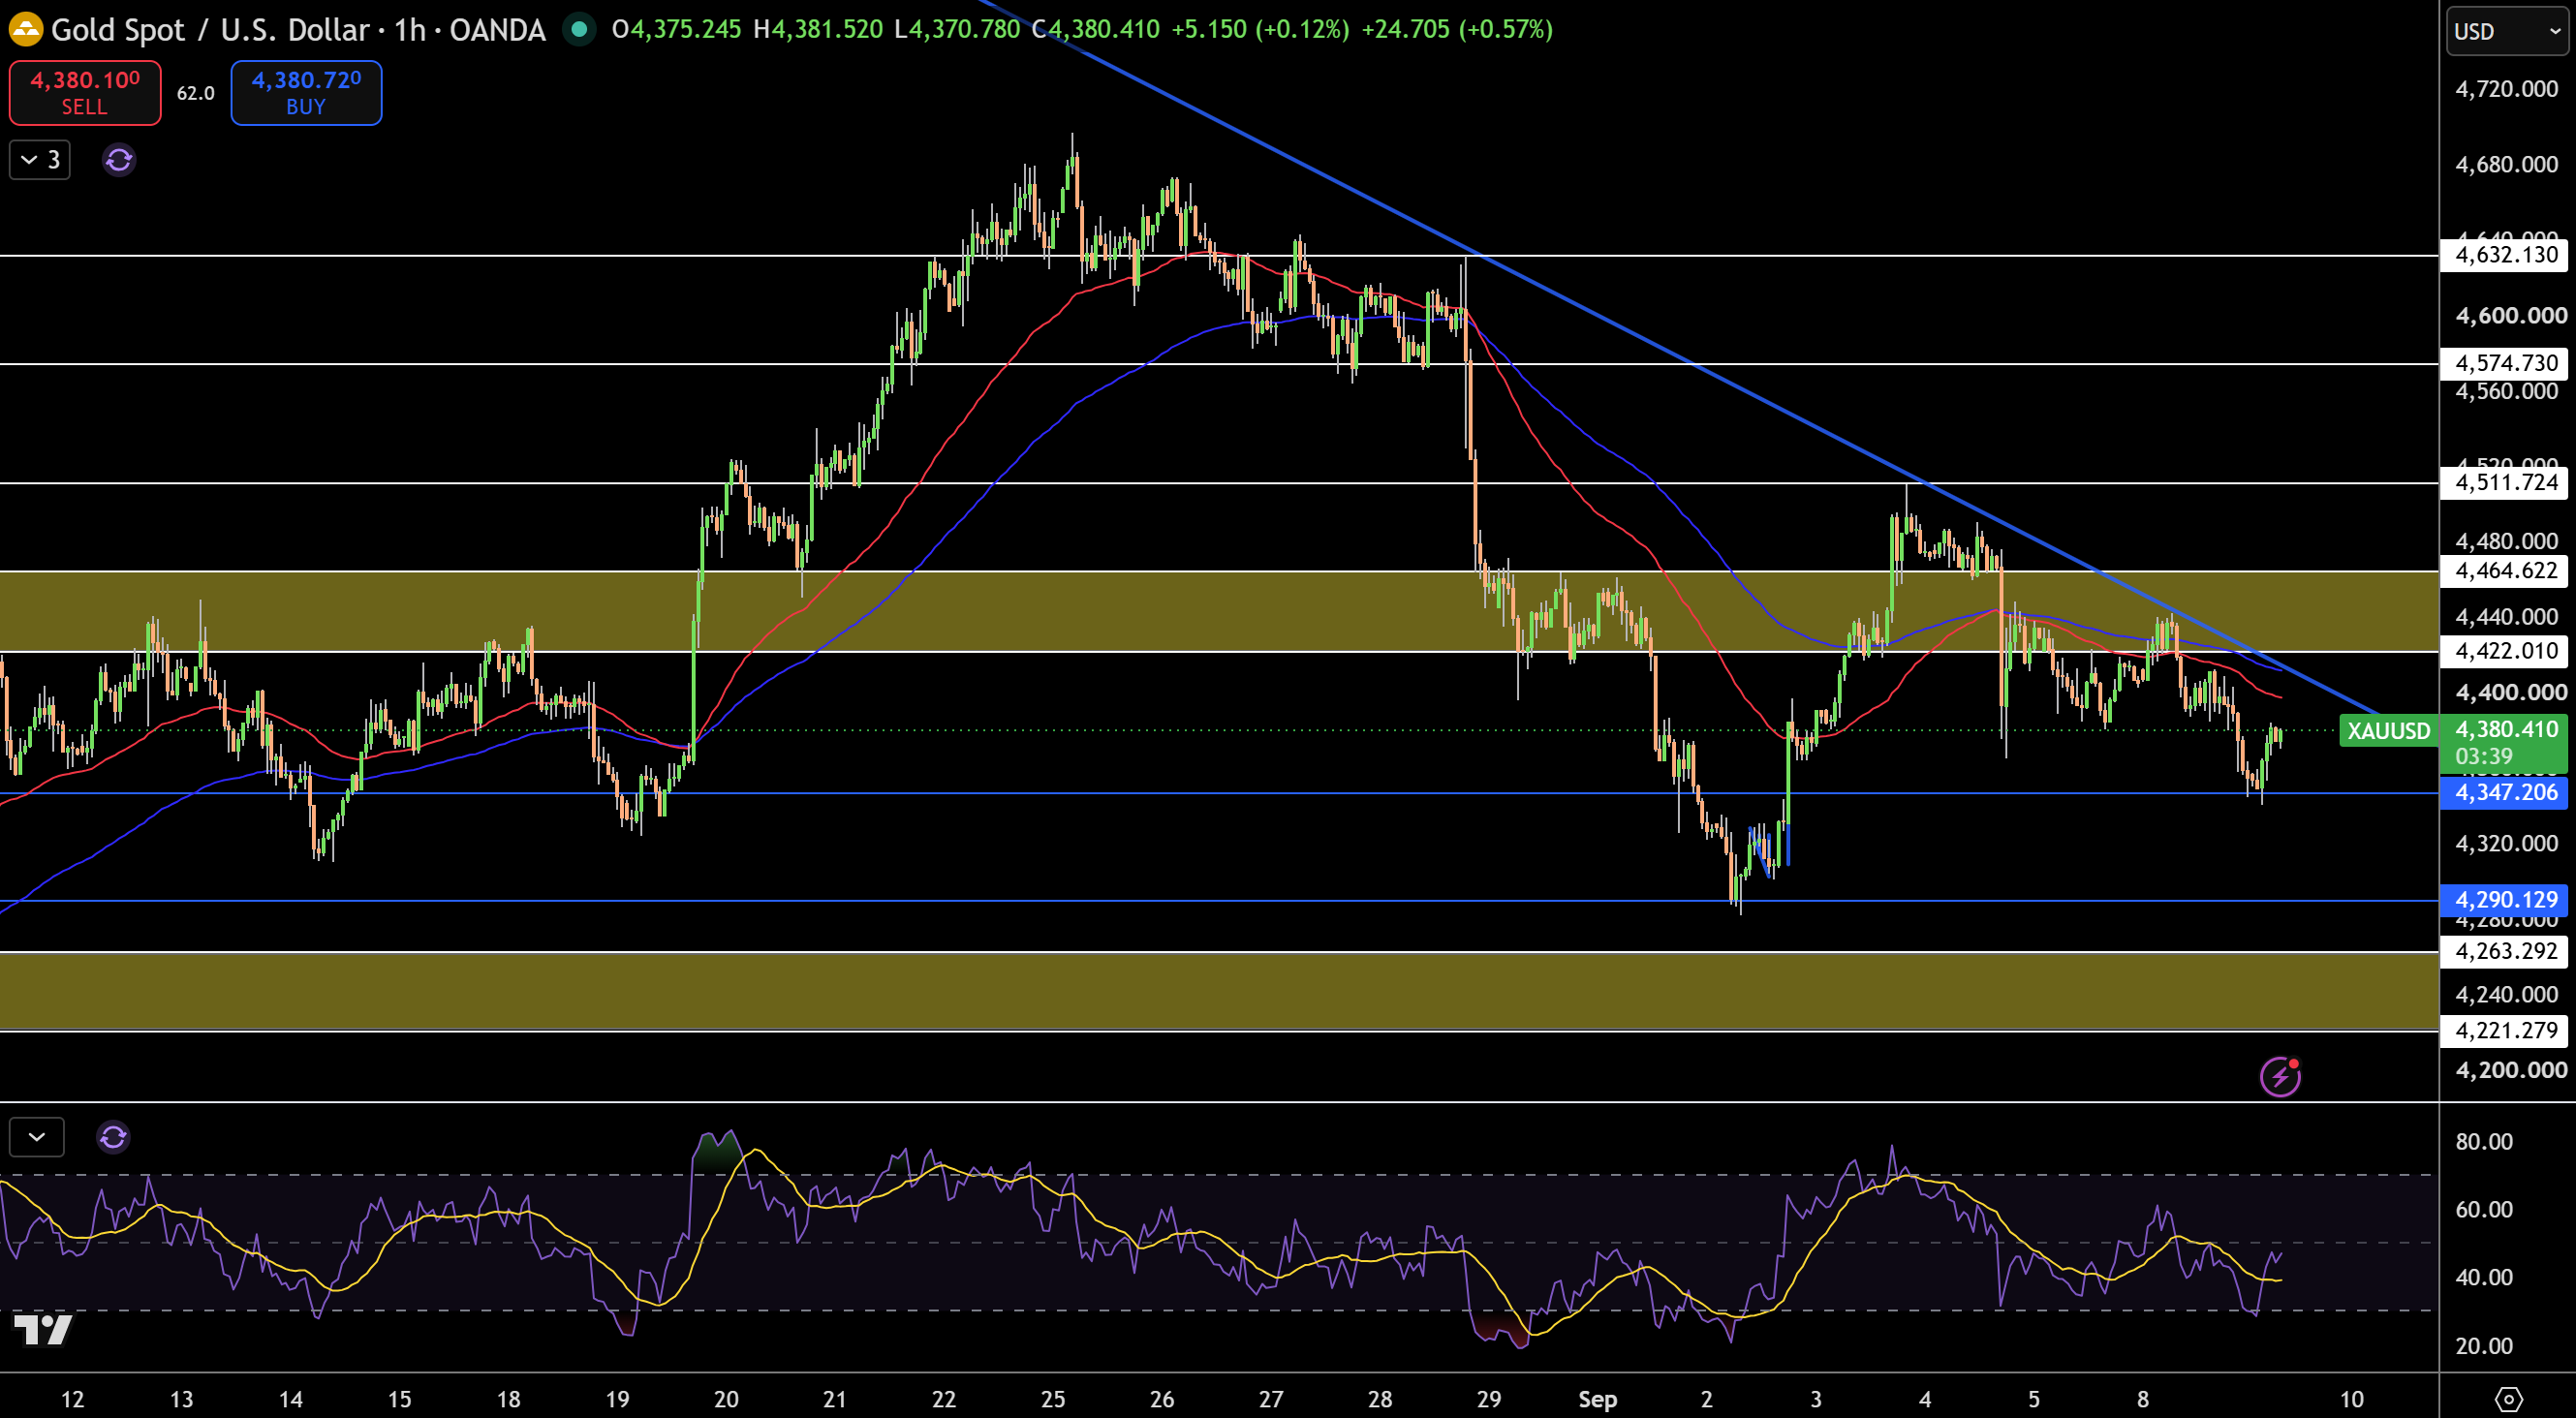
Gold trades near $4,380 on the 1 hour chart after rebounding from $4,347. I see buyers defending this support, but price trades below a descending trendline and is under the $4,422 – $4,465 resistance zone. This shows short term rebound momentum, but still has not repaired the longer term broken structure.
First resistance comes in at $4,422. Above this we have $4,465 and $4,512. Support comes in at $4,347 with $4,290 becoming more important if sellers gain control. Below this we look at the broader $4,263 – $4,221 demand zone.
RSI has recovered from oversold territory and heads back to the midline, which shows rebound momentum, but not a full reversal. I will remain bearish below $4,422 – $4,465. A close above $4,465 would change this outlook.
Gold Price Forecast
Every new Gold analysis as it publishes, today's technical signal and key levels, live price — on one page.
See all Gold forecastsSilver Technical Analysis: XAG/USD Compresses Below $67.21 as Triangle Breakout Nears
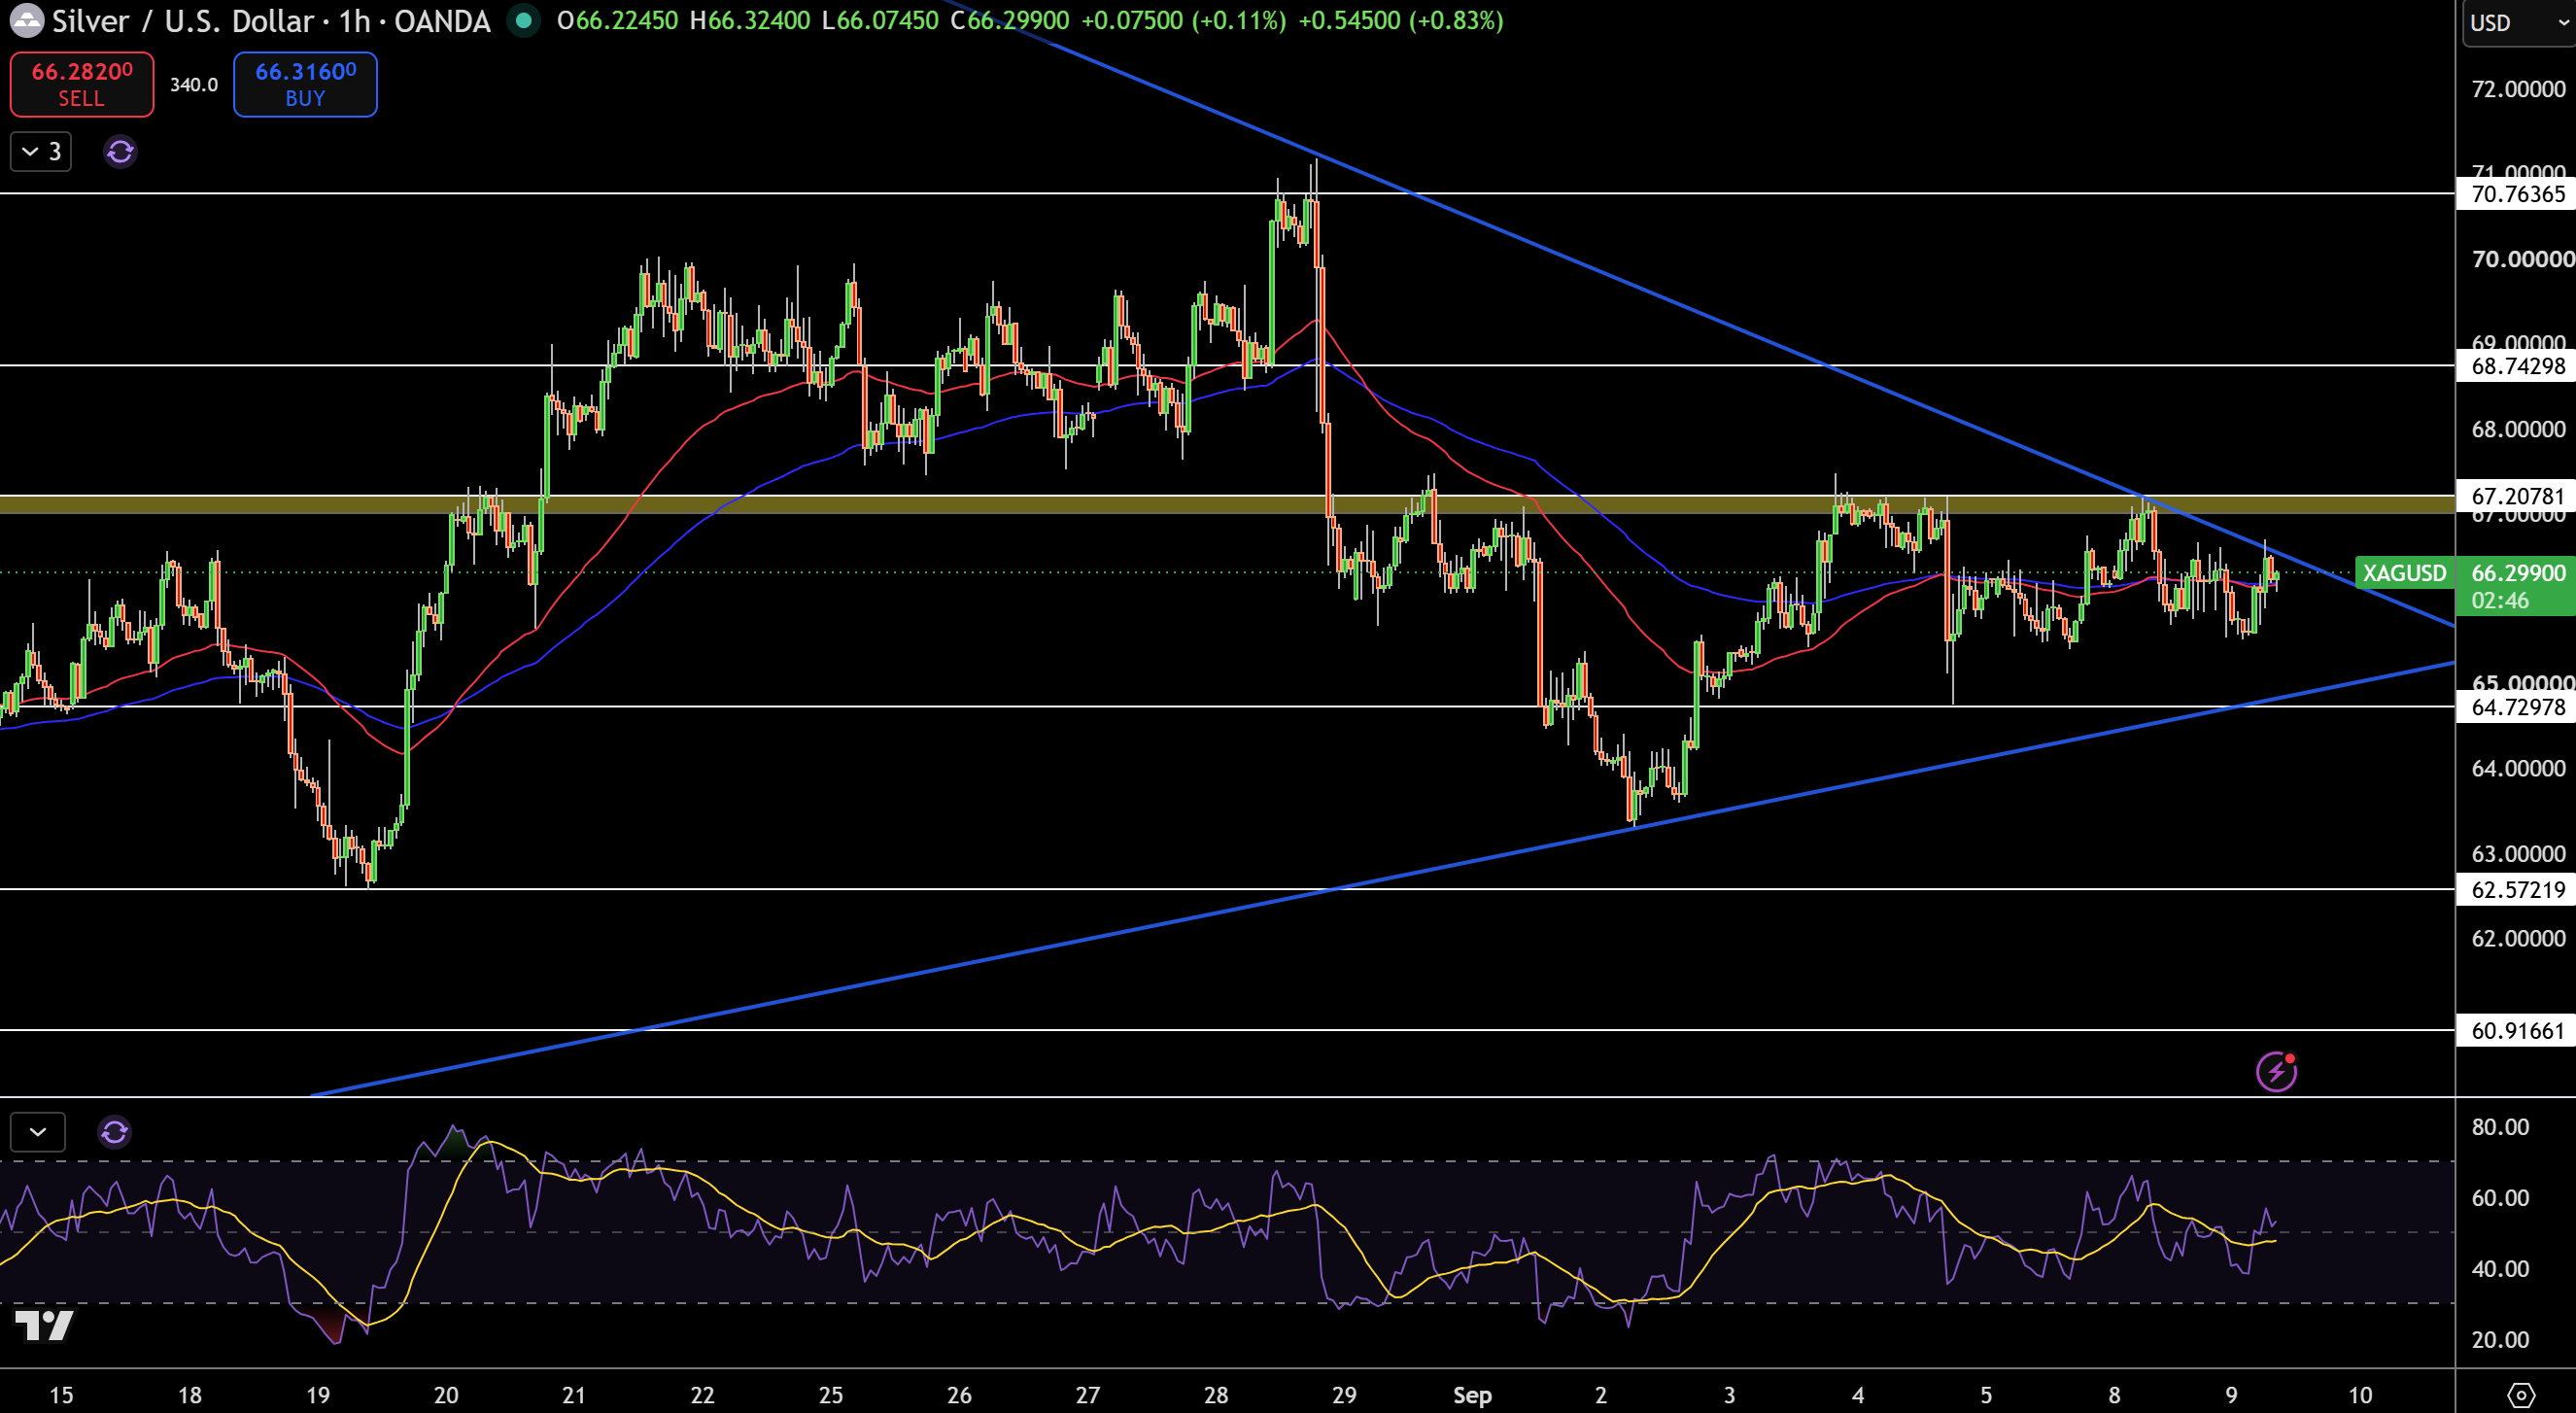
Silver trades near $66.30 on the 1 hour chart and I see a descending trendline and an upward support line compressing price. Silver has failed directly at $67.21 multiple times, while still being defended from a breakdown. All of this provides balance within the structure, but will lead to a more significant breakout.
The first resistance I am watching is $67.21. A break above this would lead to $68.74 and $70.76. A break to the downside has $64.73 as the first meaningful support, and $62.57 as the next important level should the lower consolidation trendline break.
RSI is right in the middle and shows neutral momentum. I am bearish while silver is trading below $67.21. I will remain bearish as long as the ceiling is defended by sellers. If $67.21 is broken to the upside, then I will be looking at a change in trend to the upside. If $64.73 breaks to the downside, then I will be bullish to the downside.