



USOIL, UKOil & Natural Gas Outlook: Middle East Escalation Deepens Supply Risk as Hormuz Traffic Falls
Oil pressed up even more on September 9 with further escalation of the U.S.-Iran conflict as it moved into the military, shipping, and energy sectors. The U.S. said it destroyed five Iranian oil tankers on Tuesday after Iran continually targeted a U.S. Navy vessel. Iran then countered by attacking a U.S.- operated base in Jordan with ballistic missiles and said it attacked 10 vessels in the Strait of Hormuz, further worrying the security of the Gulf exports.
The disruptions in the shipping sector show why this is important. Only six commodity vessels crossed the Hormuz Strait on Tuesday, down from nine the day before and approximately half of the recent average over the last 10 days, according to Kpler. The Strait of Hormuz remains a vital channel for both U.S. WTI and Brent crude as Saudi Arabia is dealing with Iranian-backed Houthis attacking their energy infrastructure.
The broader physical market is currently tighter. Shipments of Middle Eastern crude are about 11 million barrels per day, which is down from about 18 million barrels before this conflict started. Circumventing routes, U.S. supply, Canadian supply, and Guyana supply have lessened the blow, while reduced demand from China has restrained the worsening market.
OPEC+ is still withholding a supply response. The alliance kept its production policy unchanged for October this past Sunday as members focus on future quota negotiations.
The significant international driver for natural gas is still LNG. The crisis in Iran is driving increased competition between Europe and Asia for LNG cargoes, as the Iran crisis is reducing Qatari LNG exports via the Strait of Hormuz. Europe could be more reliant on LNG this winter due to the low levels of gas storage in Germany, with gas storage at 53% and the lowest levels in 15 years. This makes the U.S. LNG export supply more strategic.
Natural Gas Technical Analysis: NG Breaks Below $2.92 as $2.87 Support Becomes Critical
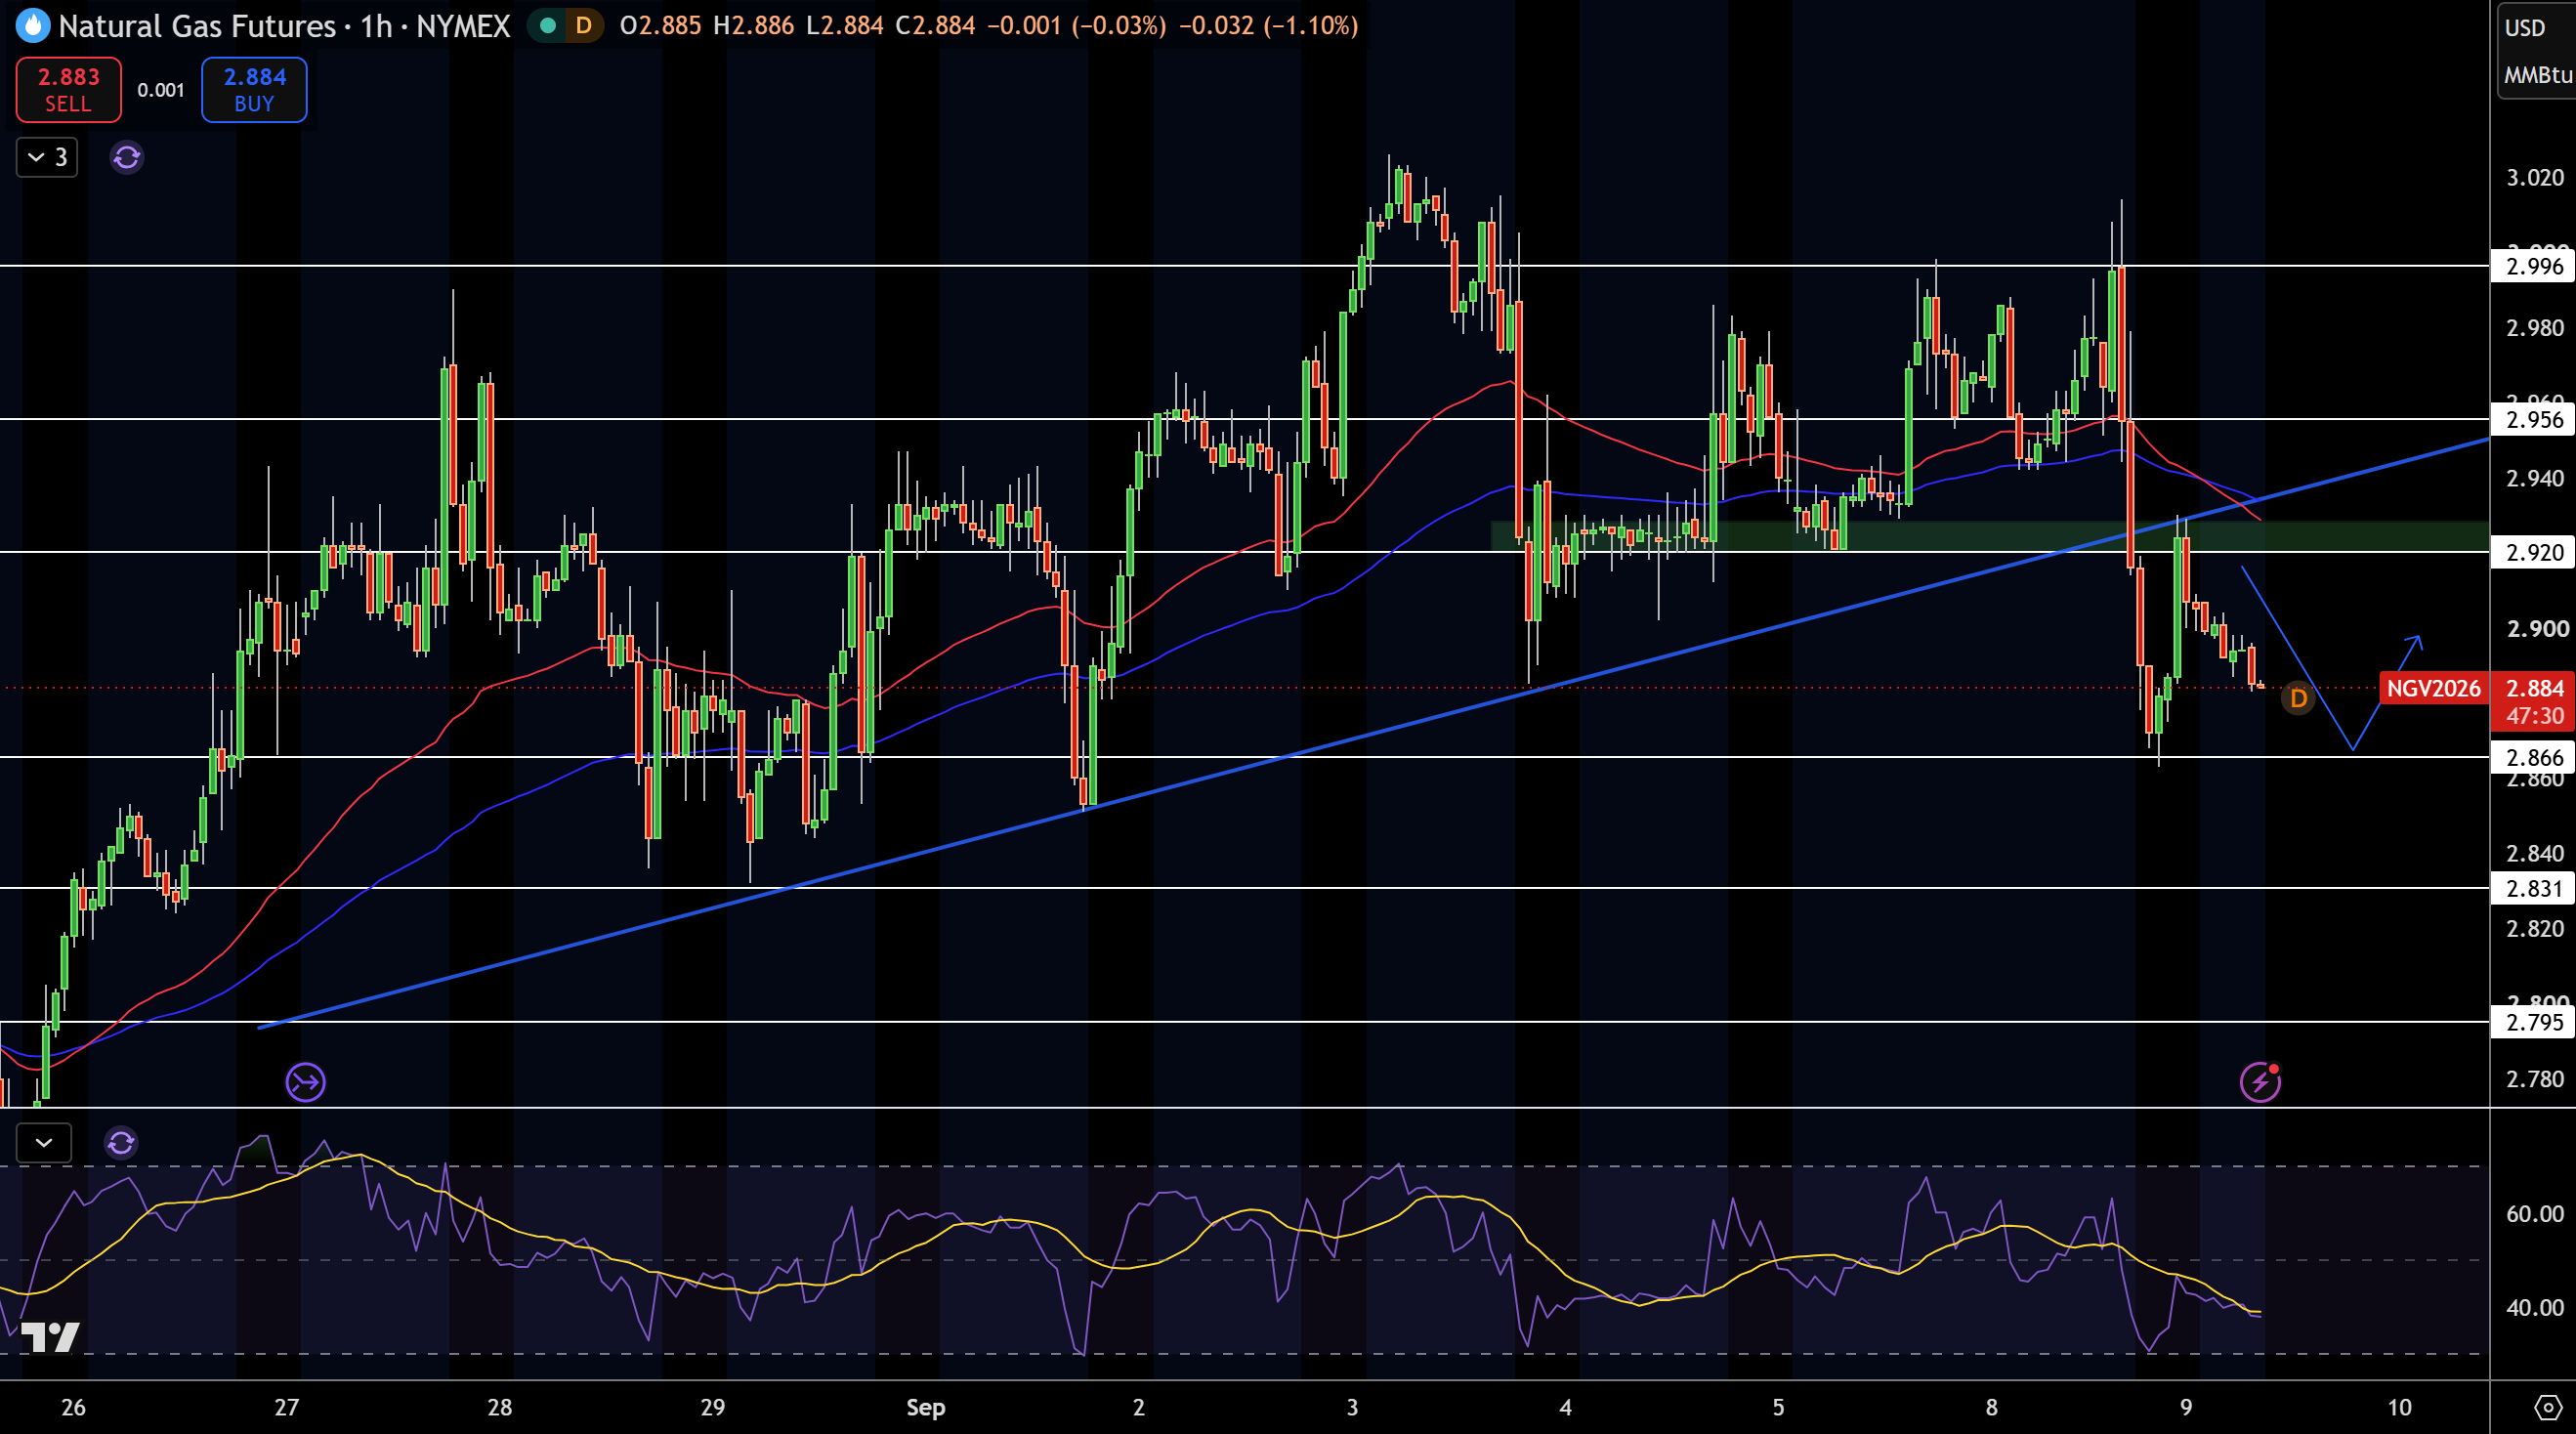
Natural gas now trades at $2.88 after slipping below $2.92 and the rising trendline. The most interesting thing about this pattern is the quick rejection at the $3.00 area before the price fell below both moving averages. Based on this, the current drop is more significant than the rest of the intraday moves.
Current support for the price of natural gas rests at $2.87. If that level is breached, we may see a move to the $2.83 and $2.80 levels. If the price of natural gas manages to break the $2.92 resistance, then we may see levels of $2.96 and $3.00 built.
RSI confirms the move was done with decreased momentum as it is now below the midline. I am currently leaning more to the bearish side of natural gas if it is below $2.92. Natural gas moving above $2.96 would change my view and give me a new bullish sight, but if this level will not hold and be reclaimed by the buyers, we may see a move to $2.87.
Natural Gas Price Forecast
Every new Natural Gas analysis as it publishes, today's technical signal and key levels, live price — on one page.
See all Natural Gas forecastsWTI Crude Oil Technical Analysis: USOIL Holds $92.15 as $94.89 Breakout Stays in Sight
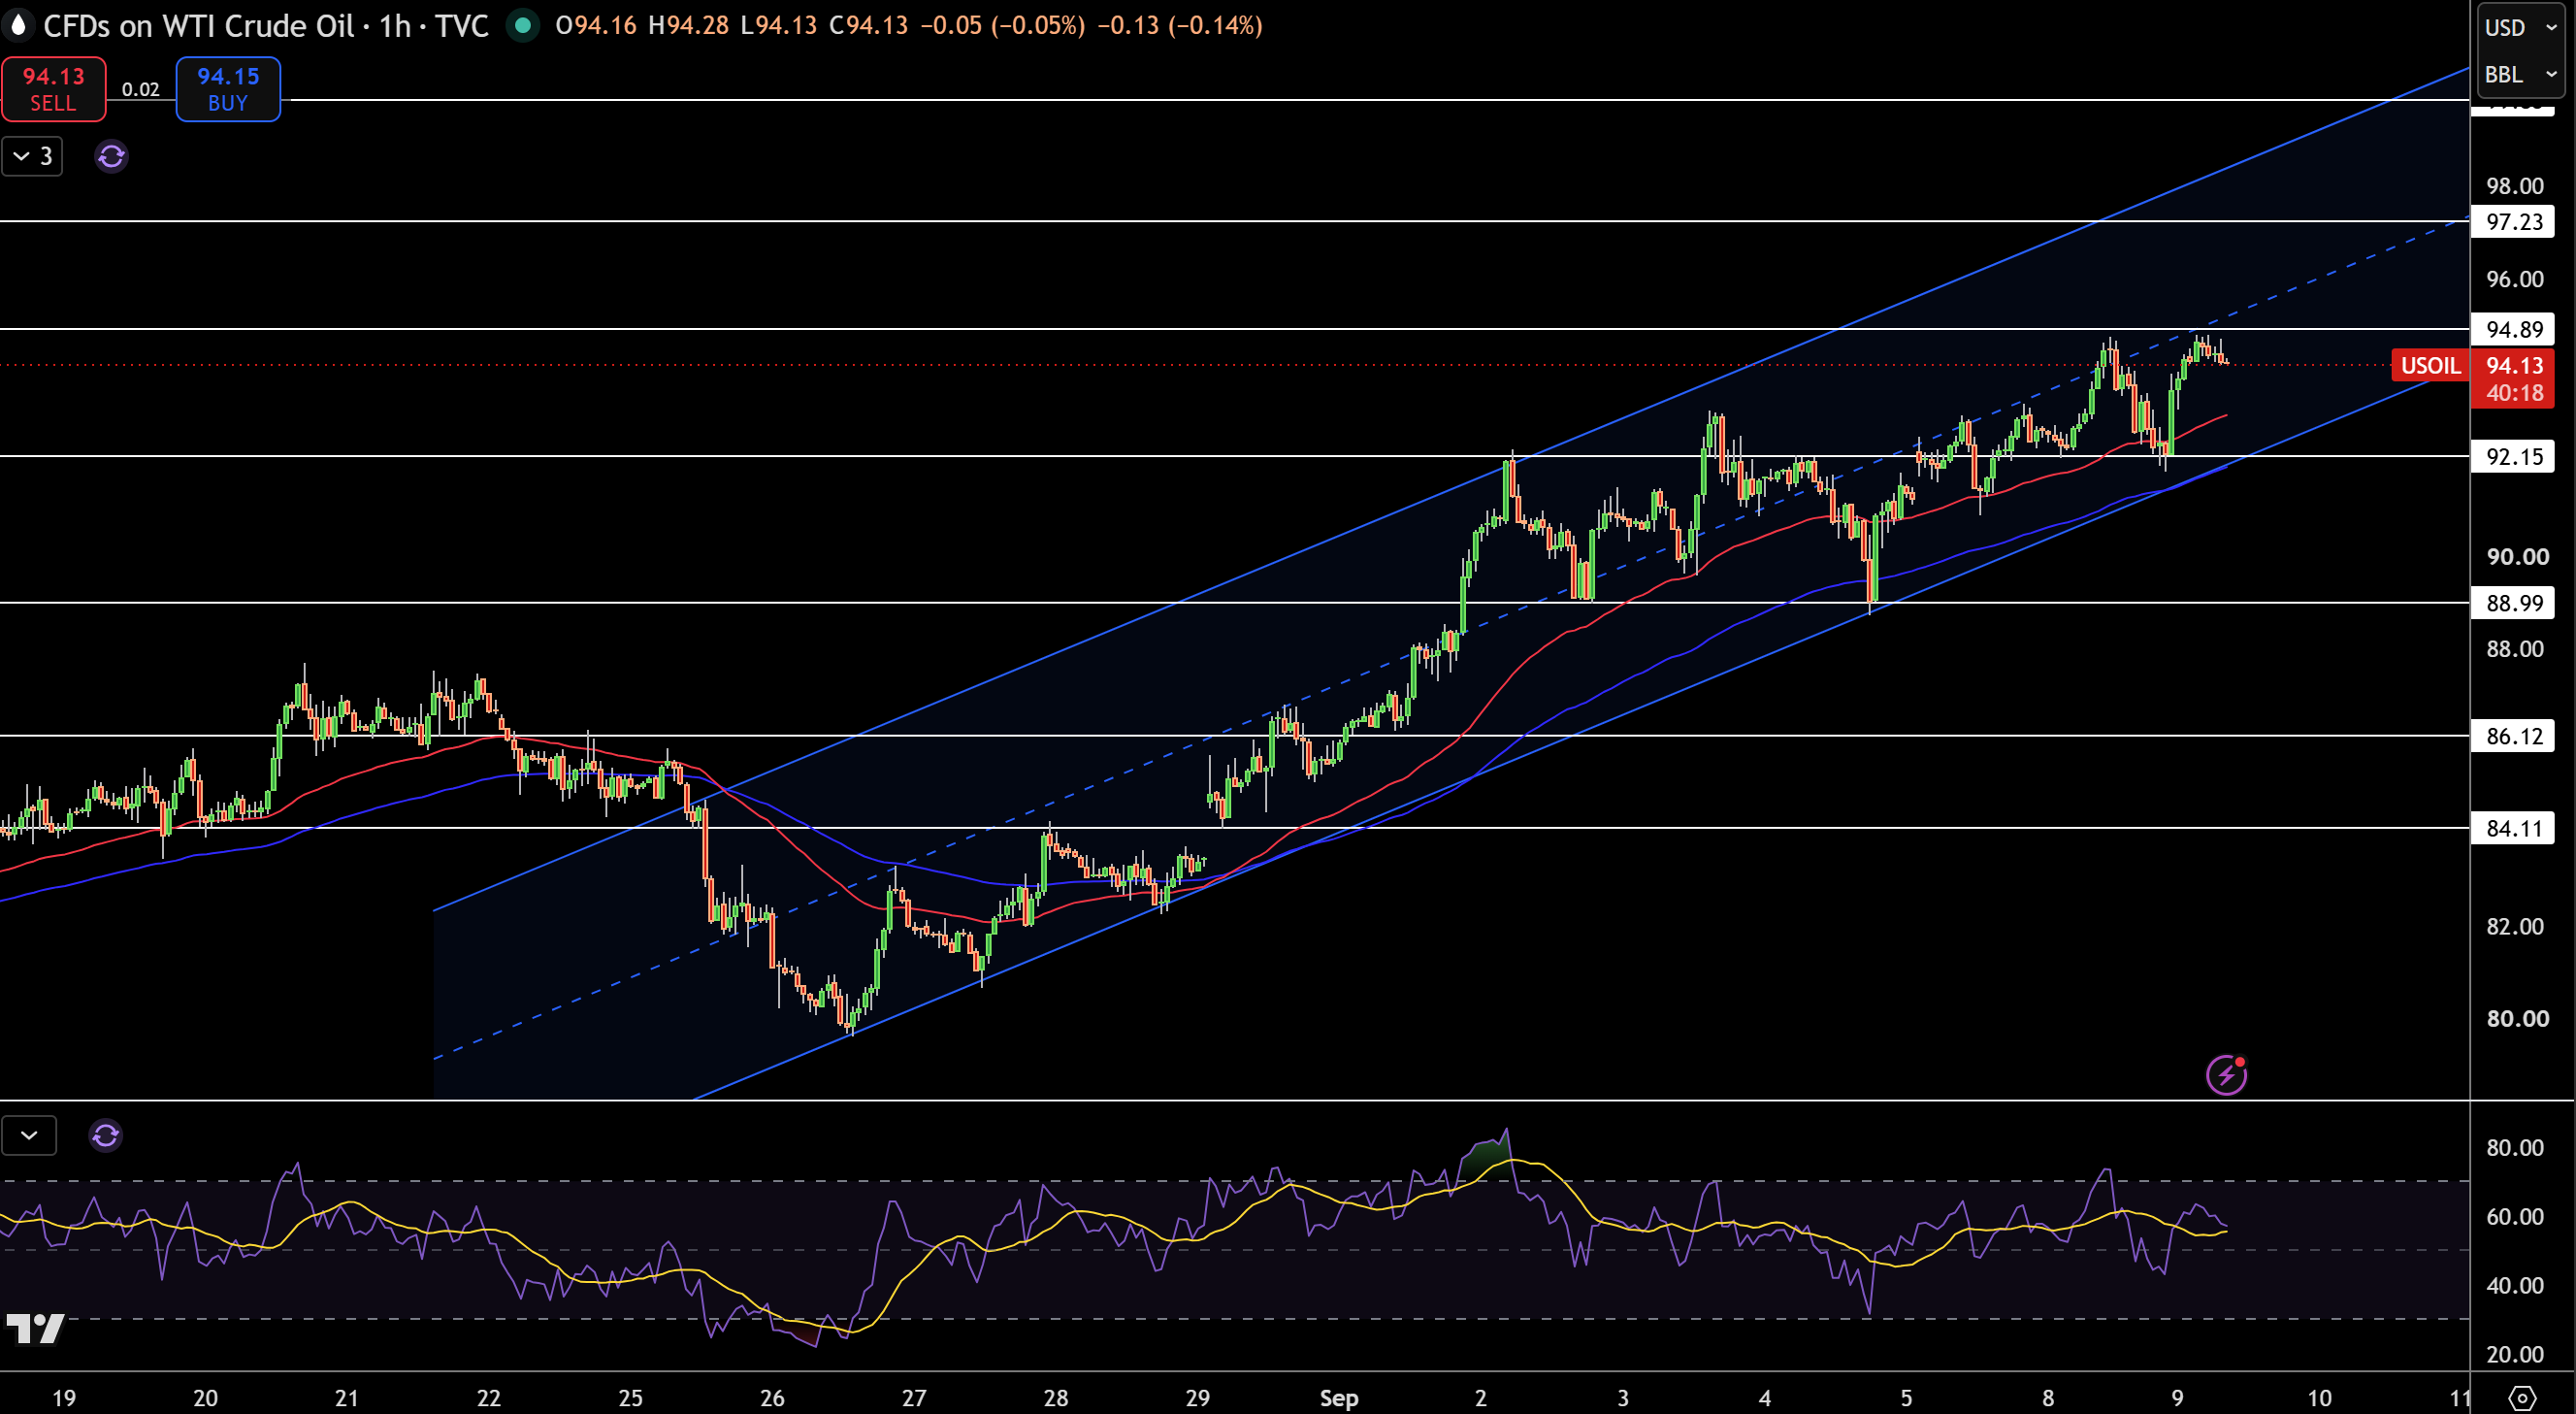
WTI crude is at $94.13 on the 1 hour chart. What stands out is the support and channel resistance is working. Additionally price in this area is above the moving averages. A potential area of interest is that in the last few hours we have found higher lows in the area of $92.15 to $93.00 which indicates strong buying.
The first area of interest is $94.89 and if $94.89 is taken out the next level is around $97.23 with $99.85 next above it. If the channel is broken $88.99 is the next level of support.
RSI is currently around the middle of its range suggesting that momentum remains strong and should be bullish above $92.15. If $92.15 is broken there is risk of the trend continuing. A break above $94.89 confirms the expectation and makes the next level $97.23 likely.
Brent Crude Oil Technical Analysis: UKOIL Clears $96.95 as $99.41 Becomes the Immediate Test
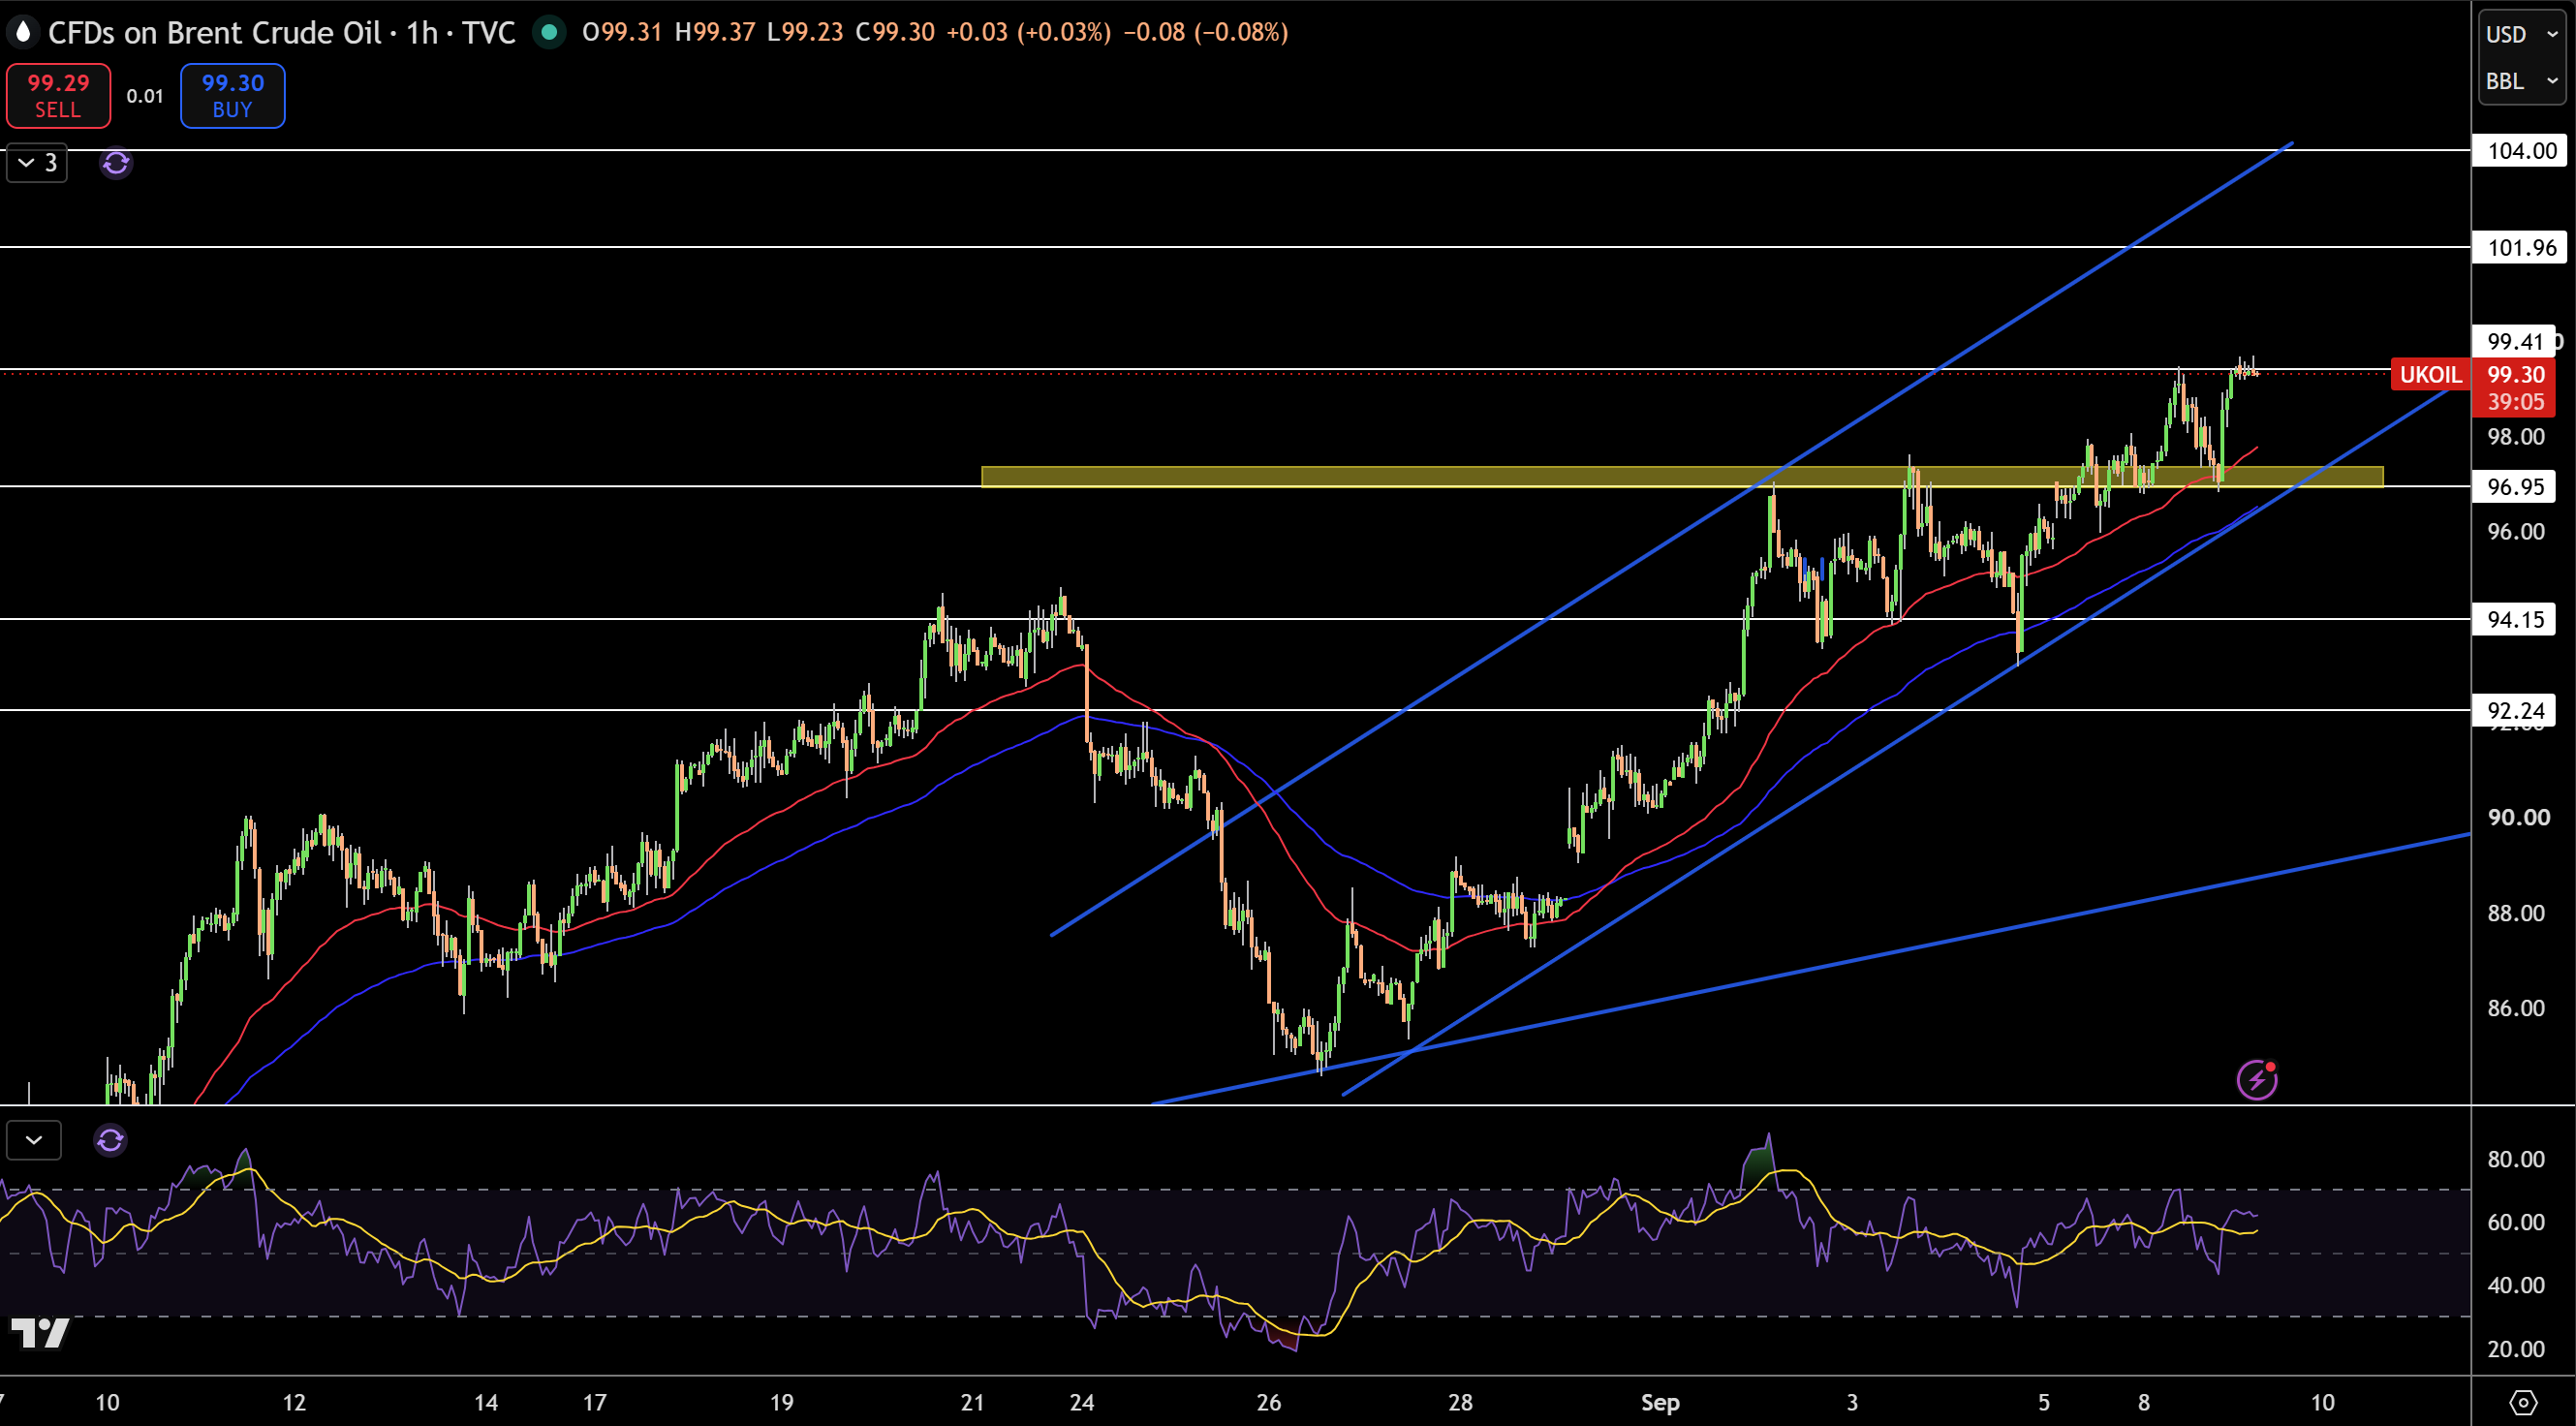
Currently, Brent crude is at $99.30 on the 1 hour chart. As seen recently, price pulled back to test the level which was broken at $96.95 before buying stepped in and pushed the price back up. This suggests that the newly formed resistance is now support and the trend is now up.
The next area of interest is $99.41 which was support before. If this level is overcome, the next level of resistance is in the area of $103.23. If the current channel holds $88.99 is the next level of support.
RSI is also in the neutral zone like WTI crude suggesting that it as well may be in a long range consolidation.
The next level I’m waiting for is at $99.41, and I’ll consider it broken and in a new rising trend if it clears that level. This would put $101.96 and $104.00 a step higher, with a new downside starting at $96.95, followed by $94.15 and $92.24.
Momentum is bullish as RSI continues to trend above the midline. I will let Brent dictate my bullishness as I will maintain this bias as long as Brent is holding above $96.95. As long as buyers defend this level, I would also defend $99.41. While I am bullish, I will let the market decide the direction as I will reassess this strength should price fall below $94.15.