Gold News: Softer Jobs Data Eases Yield Pressure Before NFP
Gold and silver have been influenced by the partial reversal of interest adjustment expectations in the US, post more relaxed Treasury yields due to softening jobs data. As of writing, private-sector job creation was at 38,000, per ADP data. This shows that the pace of job creation is slowing. Consequently, U.S. two-year and 10-year yields fell in the first trades of the day in Asia. In addition, John Williams, the NY Fed President, said that he does not see the need for hiking interest rates because of the high inflation in the economy.
The next major event to watch out for is the release of non-farm payroll numbers. Even though markets continue to price in a 60-65% chance of a September rate hike, a weaker payroll number may move these expectations sharply in the other direction, more so after the comments made by Kevin Warsh in Jackson Hole.
In terms of the sentiment for gold, geopolitical risk remains complex rather than being bullish for bullion. Even though oil prices fell on Thursday, the tightening monetary policy has a rate headwind that has only eased.
Longer-term concerns for U.S. fiscal sustainability remain in place, along with the diversification of reserves by central banks. The Financial Times has reported that gold is moving more as an alternative to real yield.
Silver has the same monetary policy sensitivity but has another demand base in industrial usage from AI, electronics, vehicles, and improvements in the power grid.
For September 3, the setup for precious metals is clear with softer labor data reducing yield headwinds for the time being. However, the market is waiting for Friday’s payroll data to see if any change in labor market data will keep the Fed-hike view the most important driver in the market.

Gold Technical Analysis: XAU/USD Rebounds From $4,301 but $4,422–$4,465 Resistance Is the Real Test
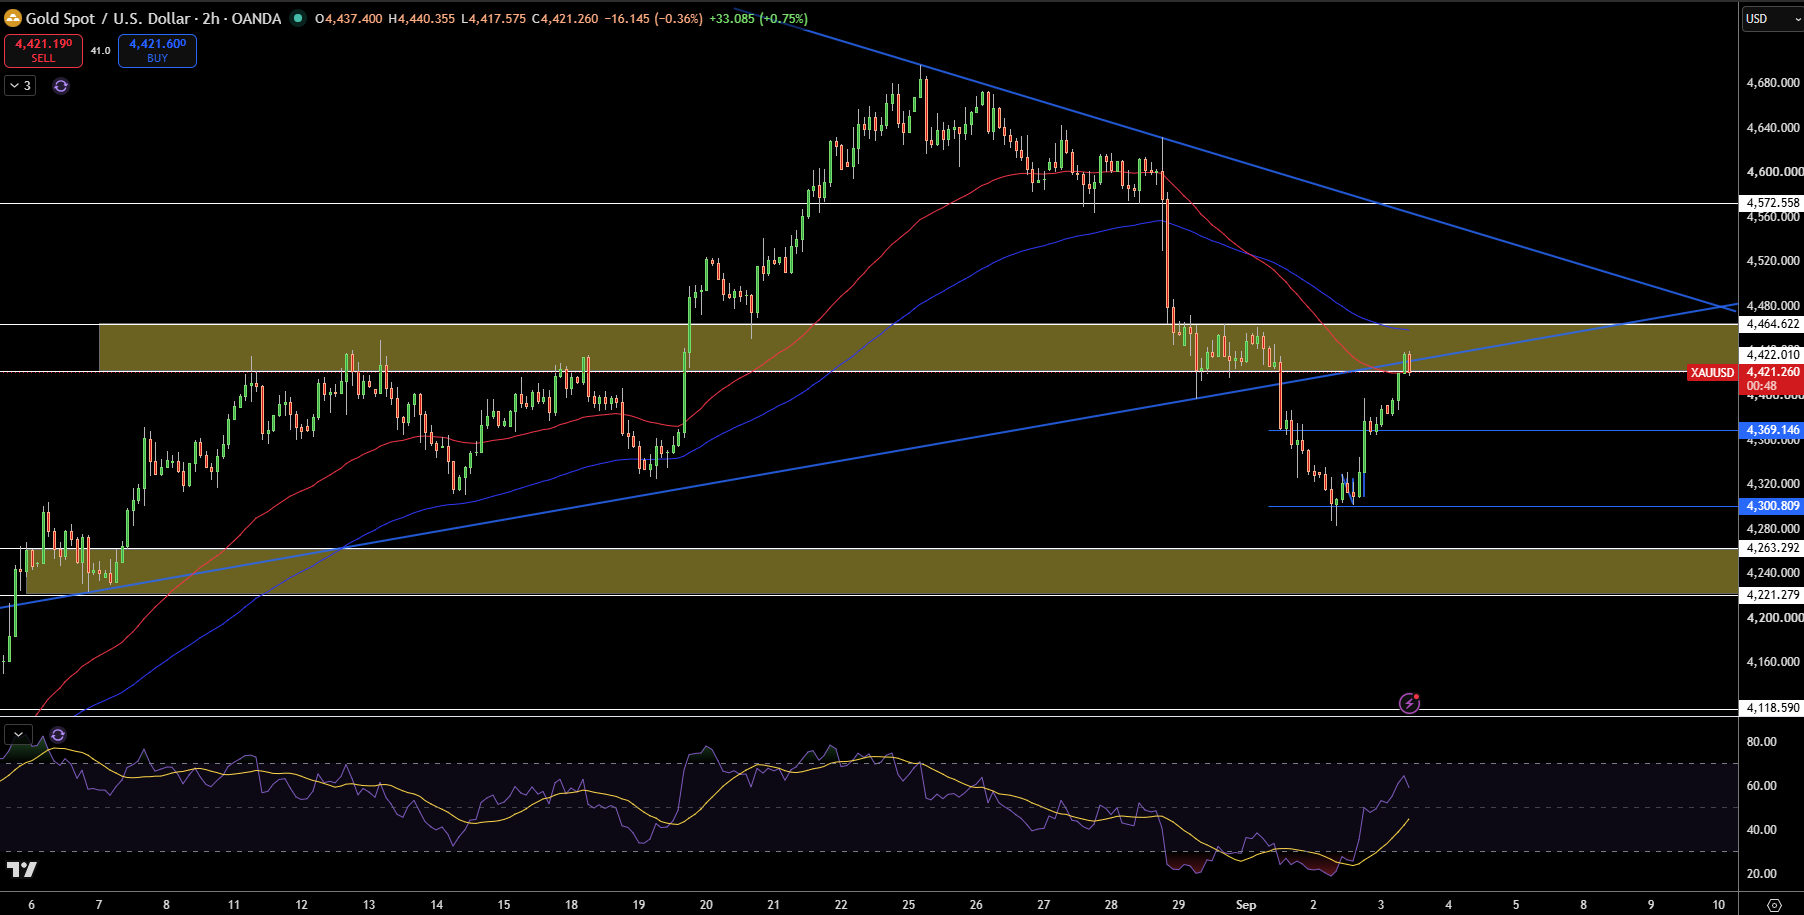
Gold price is currently sitting just north of $4,421 as bulls regroup after a sharp rebound from $4,301. What is interesting to me is the speed of this rebound, as it occurred after the Relative Strength Index (RSI) had fallen significantly into oversold territory. I’m not treating this consolidation as a full-fledged bull reversal because price is now testing a large resistance zone of $4,422 – $4,465, a broken rising trend line, as well as a newer support zone.
Kicking off this resistance zone, we have $4,422, then $4,465, and finally $4,573. On the lower end of this range, we have a smaller demand zone of $4,369, then $4,301, and a larger demand zone of $4,263 – $4,221.
Based on previous RSI movements, I am neutral to slightly bullish over this current consolidation. The key is whether the resistance at $4,465 holds. A break above that resistance would call for a more bullish case and the next target of $4,573. Conversely, if price fails to pierce resistance and breaks back into this consolidation, it would keep the bear case intact targeting $4,369.
Gold Price Forecast
Every new Gold analysis as it publishes, today's technical signal and key levels, live price — on one page.
See all Gold forecastsSilver Technical Analysis: XAG/USD Rebounds From $63.70 as $66.00–$67.21 Becomes the Decision Zone
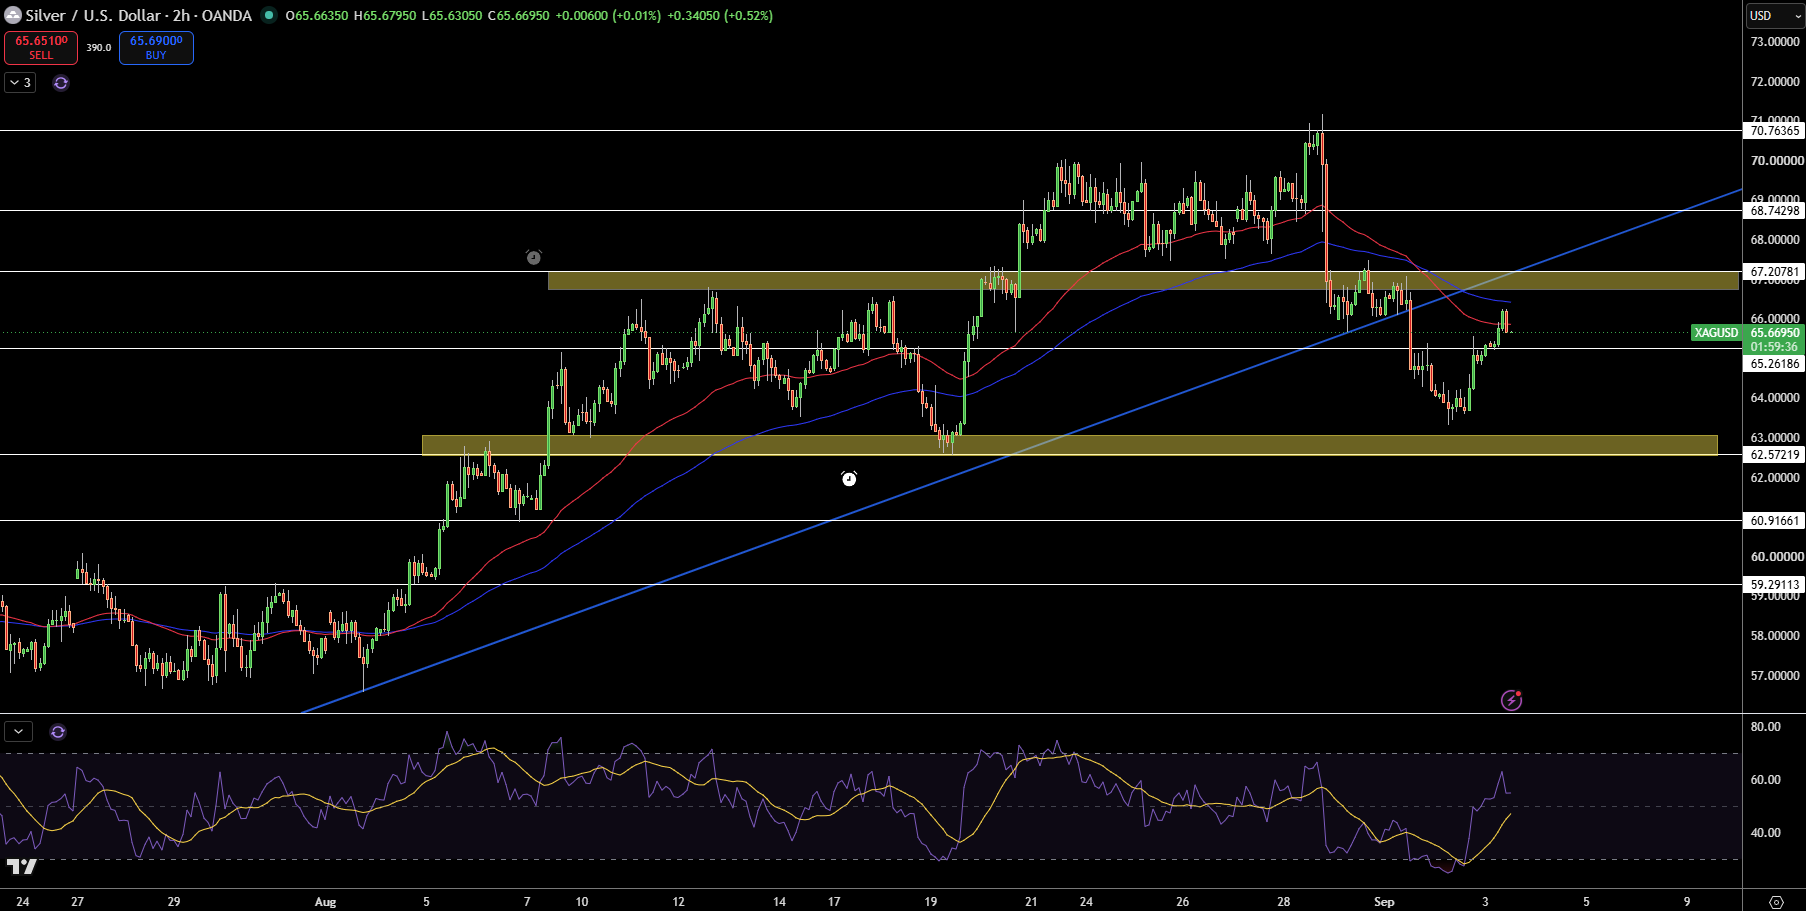
Silver price is trading at $65.67 following a price recovery from the $63.70 level. What stands out to me is that buyers stepped in before the zone of potential support around $62.57. However, I’m not treating this a full-fledged bull reversal because price potential support is forming $66.00, a broken rising trend line, and the moving average. For resistance, $66.00 comes first and is potentially followed by $67.21. For potential support after the current price, we have a potential support of $62.57, then $62.29 and $61.76.
For the RSI movement, I’m slightly bullish over this consolidation. Whether resistance at $66.00 holds will determine the entire trend going forward. A break above resistance would call for a more bullish case and the next target of $67.21. Conversely, if resistance holds and price returns to the consolidation, it would keep a bearish case over this price region and would target $62.29. $62.29 is a potential area of support for the price.
Primary resistance is estimated to be around $66. A more significant level is $67.21. Above that, we see resistance at $68.74. On the downside, initial support is expected at $65.26, followed by $63.70 and $62.57.
RSI has bounced off oversold territory and has begun to move above the neutral territory, which is bullish. In general, I like this setup, however, I will remain cautious until silver is trading above $67.21. A clear re-test of that level would mean the breakdown is losing significance and will allow for testing of resistance at $68.74. A breakdown below $66.00-$67.21 would bring $65.26 back into focus with $63.70 still at risk.