


Gold Gives Back Wednesday’s Rally
Gold could not hold it. Wednesday’s two-week high came apart Thursday as crude blew through $100 on the Brent contract after Houthi attacks on Saudi tankers and the rate-hike trade came roaring back. The 10-year Treasury yield hit 4.707%, its highest since January 2025, the dollar firmed and September hike odds jumped to 80% from 68% Wednesday. The same market that absorbed rising oil and yields on Wednesday broke on the follow-through Thursday. The bears got the second wave they needed and gold gave back the covering rally in full.
At 15:09 GMT, Spot Gold is trading $4,055.73, down $74.03 or -1.79%.
Crude Through $100 Reignited the Rate Trade
Brent pushed through $100 after the Houthi attacks raised the threat to a second shipping route. Hormuz was already impaired and the Red Sea is now a problem after Saudi tankers took fire near Bab el-Mandeb.
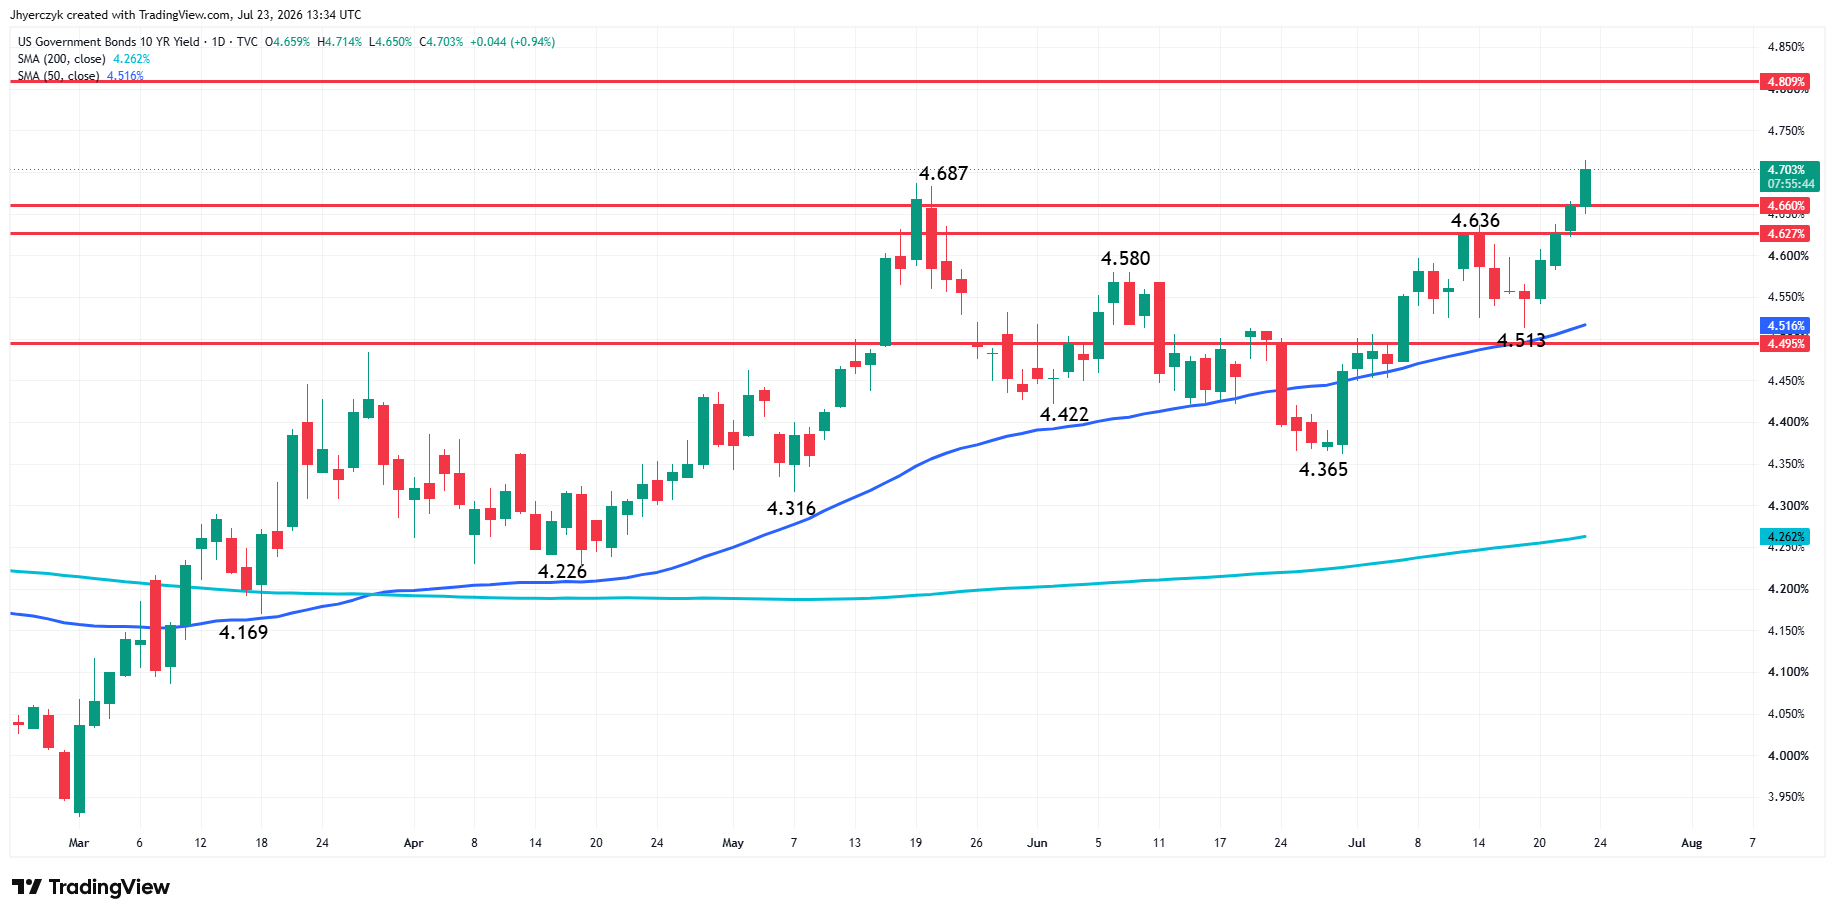
The 10-year yield broke to its highest level since January 2025 at 4.707%, the 2-year climbed to 4.343% and the 30-year pushed above 5.18%. The dollar index rose 0.25% to 101.35.
Wednesday’s rally was built on trapped shorts and dip buying after the bears failed to break gold under a hostile setup. It was never built on lower yields or a weaker dollar. When crude caught fire Thursday and yields followed, the covering rally had nothing underneath it. Gold bulls needed the dollar to roll over and instead it caught a bid as the rate market adjusted.
Claims and the Fed Closed the Door
Initial jobless claims came in at 187,000 for the week ended July 18, well below the 212,000 forecast and the lowest reading since 1969. That removed the one argument gold bulls had left. The economy is not slowing fast enough to give the Fed any reason to back off and the claims number confirmed it on the same morning crude was running.
Gold Price Forecast
Every new Gold analysis as it publishes, today's technical signal and key levels, live price — on one page.
See all Gold forecastsThe FOMC meets next week and traders are pricing an 80% chance of a September hike. The meeting is not about a July move. It is about whether Warsh confirms what the bond market is already pricing. A hawkish statement on energy costs and inflation keeps the dollar firm, yields elevated and gold under pressure. A dovish surprise would need the Fed to look past $100 crude, a 4.70% 10-year and the strongest claims number in 56 years. That is a lot to look past.
Spot Gold (XAUUSD) Technical Analysis
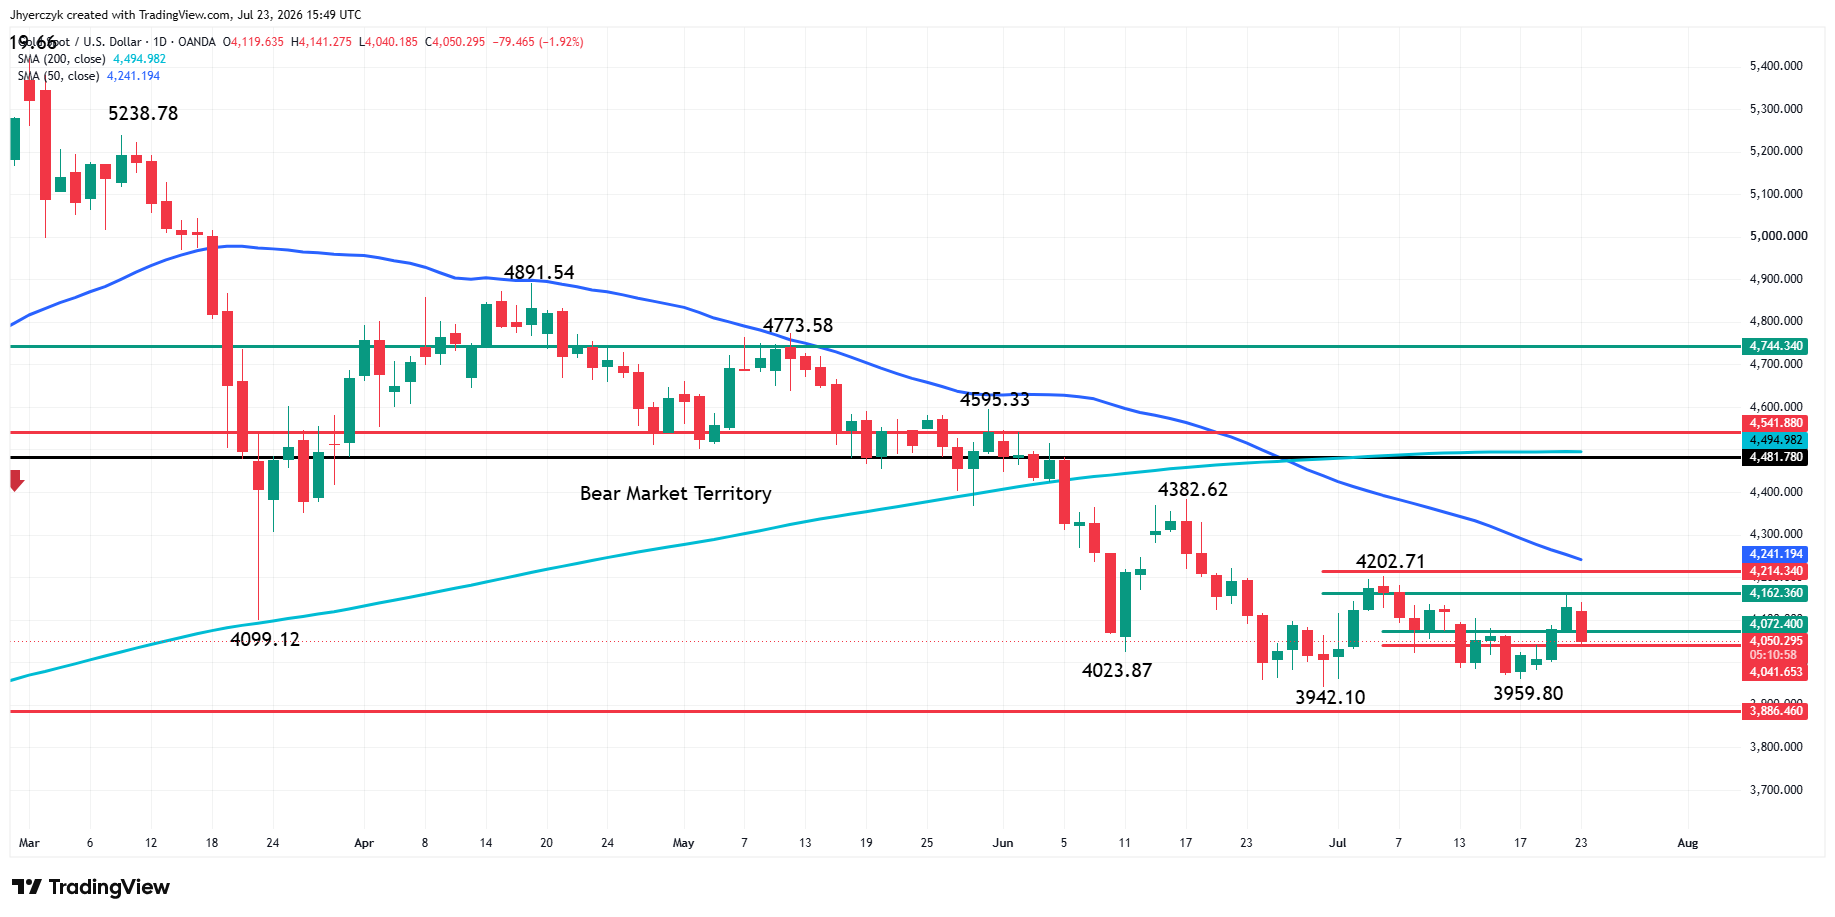
Spot gold is edging lower as we approach the mid-session. Earlier today, yesterday’s high at $4,166.13 became a new minor top when sellers took out yesterday’s low.
On Wednesday, gold tested a retracement zone at $4162.36 to $4214.34 where it ran into sellers. The market is now straddling a short-term retracement zone at $4072.40 to $4041.65.
Based on the position of the 50-day moving average at $4241.15 and the 200-day moving average at $4494.97, the trend is still down.
Looking at the swing chart with its series of lower tops at $4202.72, $4382.62 and $4595.33, to name a few, I have to say, this also indicates a downtrend.
Until that pattern breaks and traders start taking out tops and crossing to the strong side of the moving averages, the market remains tilted lower.
The two bottoms at $3959.80 and $3942.10 are important, but the most important support is the long-term bottom at $3886.46.
What to Watch
Gold needs crude to pull back before anything else changes. Not a ceasefire headline. Actual tanker traffic recovering, crude coming off these levels and the inflation conversation shifting. Until that happens the dollar has support, yields have a reason to stay elevated and the hike trade keeps building into next week’s FOMC meeting. Wednesday showed gold could absorb the first wave of pressure from oil and yields. Thursday showed it could not absorb the second and the difference was crude clearing $100 and claims coming in at a 56-year low on the same session.
The trend is still down with a series of lower tops on the swing chart and both major moving averages well overhead. Gold is straddling a short-term retracement zone that could act as support but the broader pattern has not changed. The two bottoms below and long-term support are the levels that matter if sellers keep pressing and the FOMC delivers the hawkish tone the bond market is already pricing.
If you’d like to know more about how to trade gold, please visit our educational area.